| Param | Original file | Final file |
|---|---|---|
| Filename | modeM0/AS1G07_046T01_9000001124_08162cztM0_level2.evt | modeM0/AS1G07_046T01_9000001124_08162cztM0_level2_quad_clean.evt |
| Size (bytes) | 548,314,560 | 74,206,080 |
| Size | 522.9 MB | 70.8 MB |
| Events in quadrant A | 3,386,595 | 454,224 |
| Events in quadrant B | 3,614,130 | 458,782 |
| Events in quadrant C | 3,991,181 | 453,738 |
| Events in quadrant D | 5,165,818 | 419,317 |
| Mode M0 | |||
|---|---|---|---|
| Quadrant | BADHDUFLAG | Total packets | Discarded packets |
| A | 0 | 14038 | 3 |
| B | 0 | 14710 | 2 |
| C | 0 | 16063 | 2 |
| D | 0 | 19554 | 2 |
| Mode SS | |||
|---|---|---|---|
| Quadrant | BADHDUFLAG | Total packets | Discarded packets |
| A | 0 | 134 | 0 |
| B | 0 | 134 | 0 |
| C | 0 | 134 | 0 |
| D | 0 | 134 | 0 |
| Mode M9 | |||
|---|---|---|---|
| Quadrant | BADHDUFLAG | Total packets | Discarded packets |
| A | 0 | 15 | 0 |
| B | 0 | 15 | 0 |
| C | 0 | 15 | 0 |
| D | 0 | 16 | 0 |
| Quadrant | Total seconds | Saturated seconds | Saturation percentage |
|---|---|---|---|
| A | 6609 | 111 | 1.679528% |
| B | 6609 | 122 | 1.845968% |
| C | 6609 | 111 | 1.679528% |
| D | 6609 | 689 | 10.425178% |
Noise dominated data is calculated using 1-second bins in cleaned event files. If a bin has >2000 counts, and if more than 50% of those come from <1% of pixels, then it is considered to be noise-dominated and hence unusable.
| Quadrant | # 1 sec bins | Bins with >0 counts | Bins with >2000 counts | High rate bins dominated by noise | Noise dominated (total time) | Noise dominated (detector-on time) | Marked lightcurve |
|---|---|---|---|---|---|---|---|
| A | 7819 | 6609 | 0 | 0 | 0.00% | 0.00% | 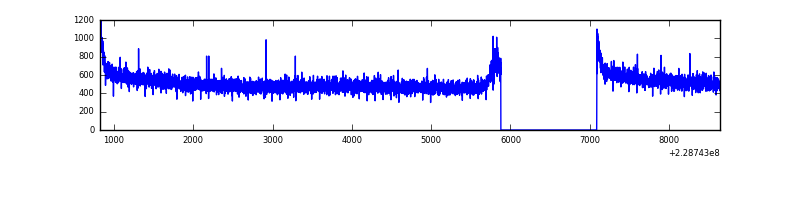 |
| B | 7819 | 6609 | 13 | 13 | 0.17% | 0.20% | 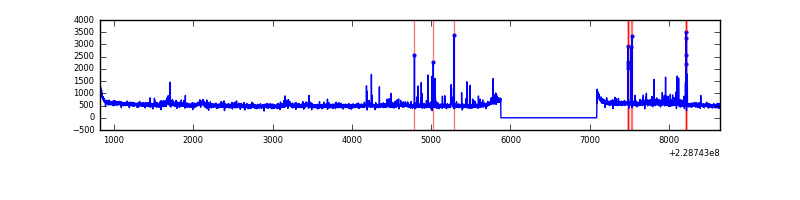 |
| C | 7819 | 6609 | 0 | 0 | 0.00% | 0.00% | 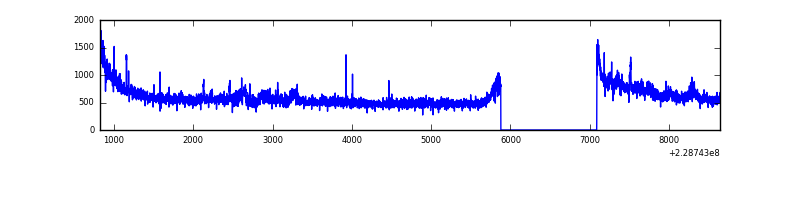 |
| D | 7819 | 6609 | 563 | 563 | 7.20% | 8.52% | 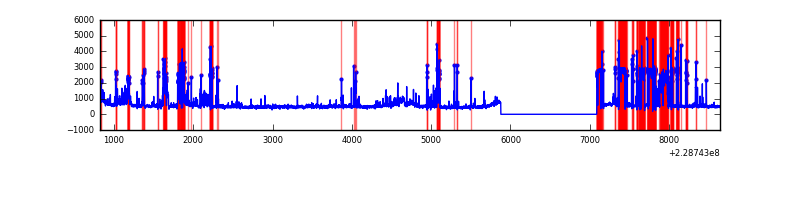 |
Top three noisy pixels from each quadrant. If the there are fewer than three noisy pixels in the level2.evt file, extra rows are filled as -1
| Pixel properties | Quadrant properties | ||||||
|---|---|---|---|---|---|---|---|
| Quadrant | DetID | PixID | Counts | Sigma | Mean | Median | Sigma |
| A | 0 | 226 | 8412 | 42.43 | 878 | 862 | 177.9 |
| A | 12 | 194 | 7797 | 38.98 | 878 | 862 | 177.9 |
| A | 13 | 254 | 4968 | 23.08 | 878 | 862 | 177.9 |
| B | 10 | 16 | 71678 | 429.81 | 871 | 855 | 164.8 |
| B | 0 | 214 | 70358 | 421.8 | 871 | 855 | 164.8 |
| B | 0 | 219 | 47643 | 283.94 | 871 | 855 | 164.8 |
| C | 1 | 16 | 697333 | 3591.03 | 844 | 850 | 194.0 |
| C | 13 | 61 | 6415 | 28.69 | 844 | 850 | 194.0 |
| C | 12 | 4 | 3058 | 11.38 | 844 | 850 | 194.0 |
| D | 1 | 52 | 1440219 | 7350.61 | 800 | 778 | 195.8 |
| D | 12 | 227 | 453106 | 2309.85 | 800 | 778 | 195.8 |
| D | 12 | 33 | 78679 | 397.81 | 800 | 778 | 195.8 |
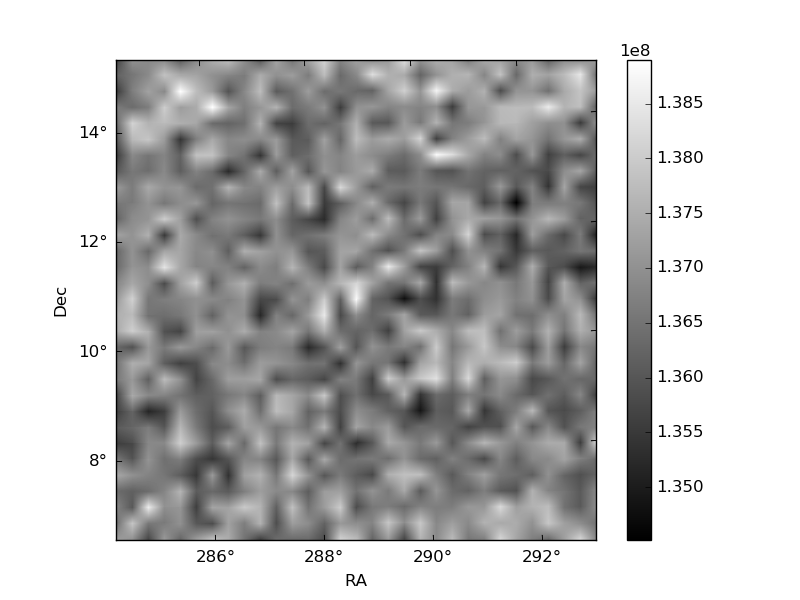
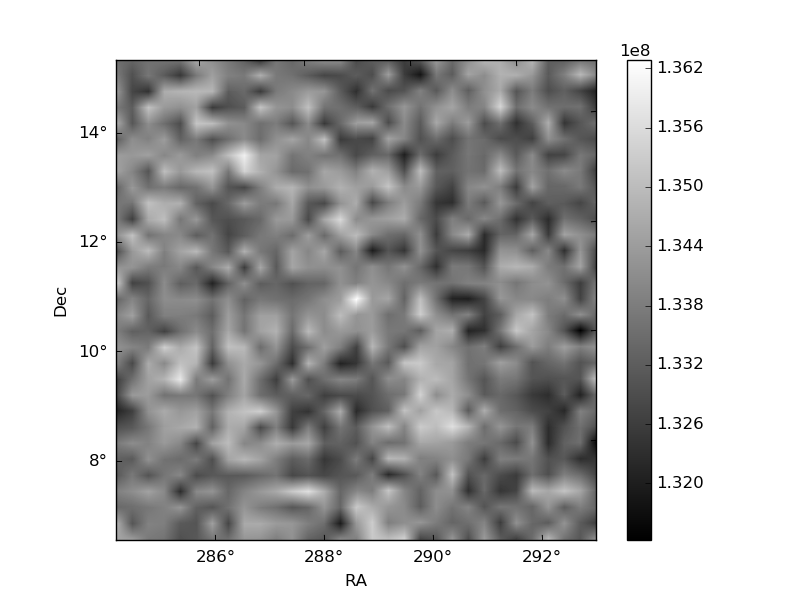
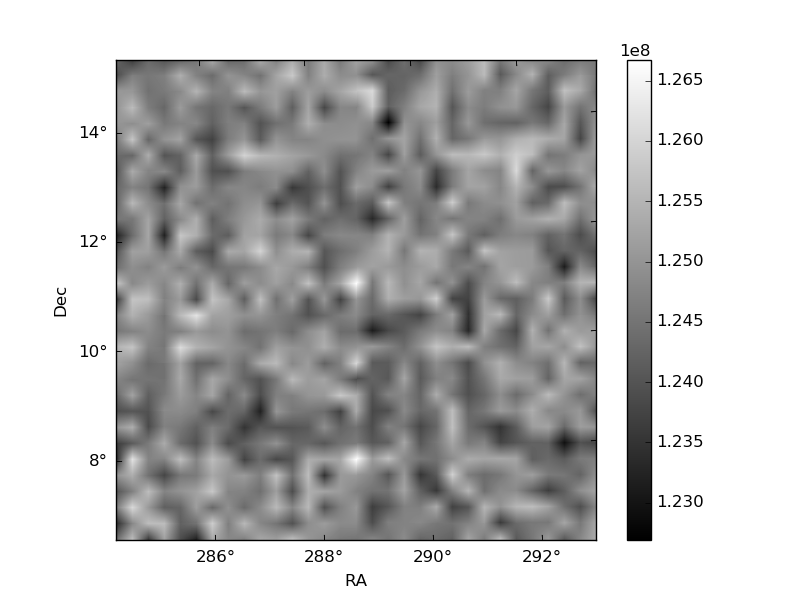
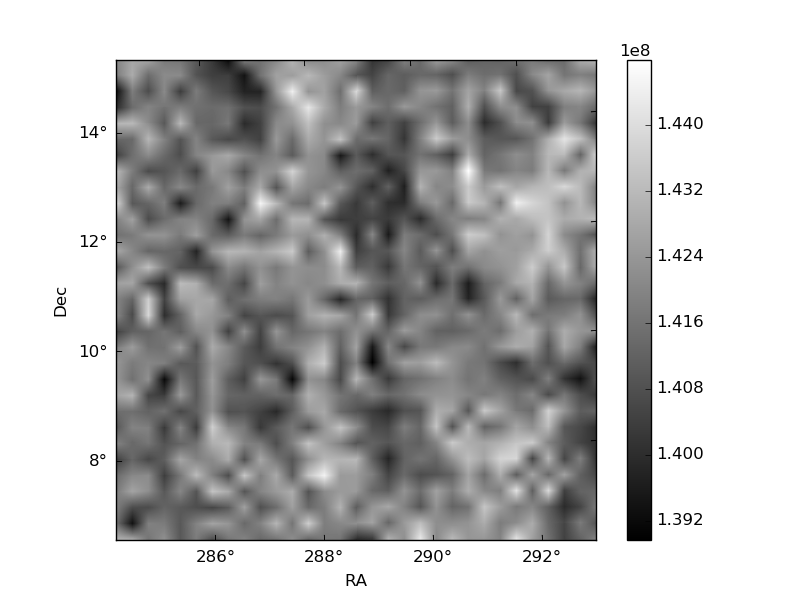
Histogram calculated using DETX and DETY for each event in the final _common_clean file
| Quadrant A | 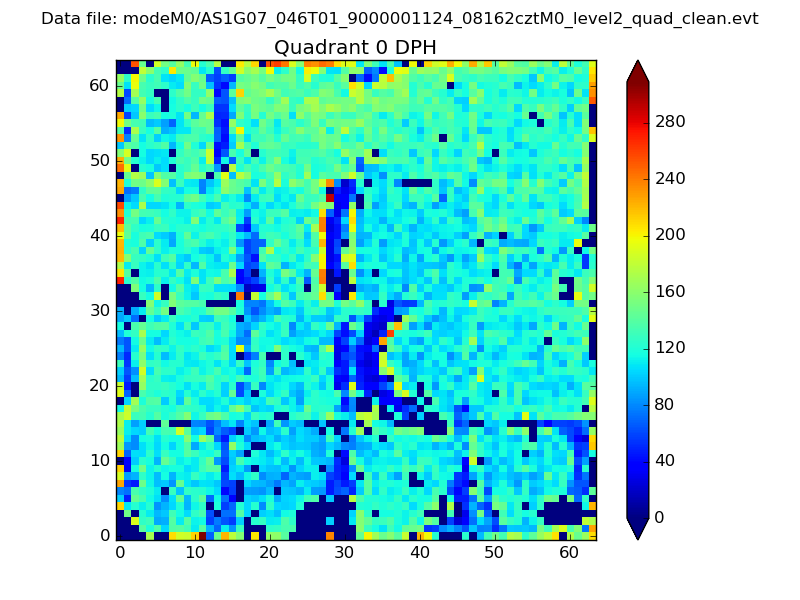 |
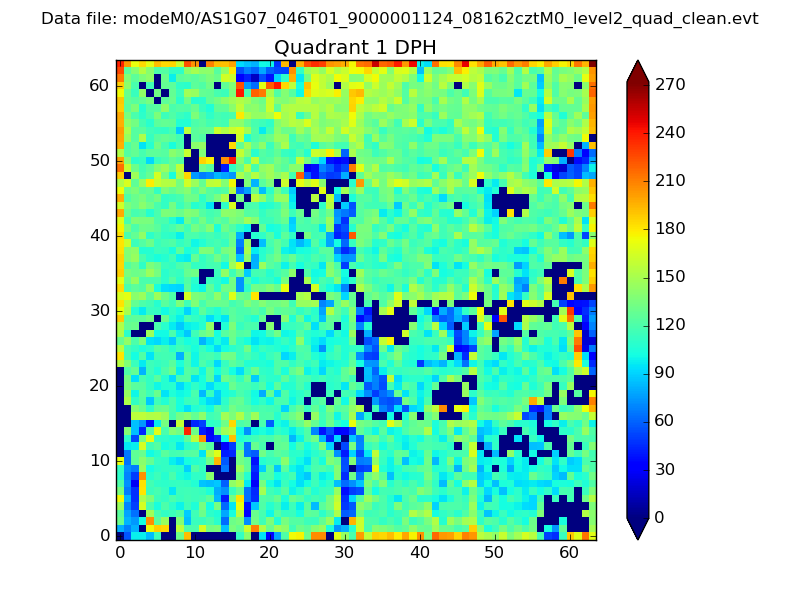 |
Quadrant B |
|---|---|---|---|
| Quadrant D | 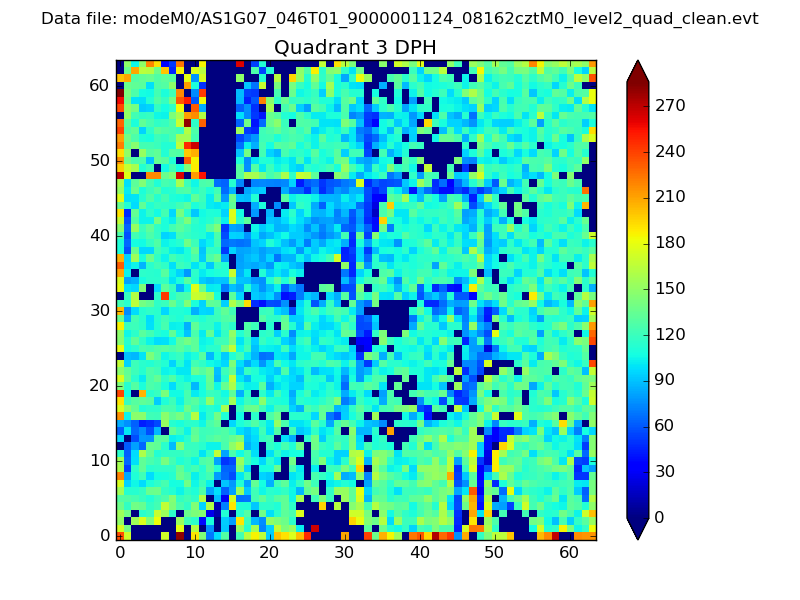 |
 |
Quadrant C |
| Plot type | Count rate plots | Images |
|---|---|---|
| Comparison with Poisson distribution Blue bars denote a histogram of data divided into 1 sec bins. Red curve is a Poisson curve with rate = median count rate of data. |
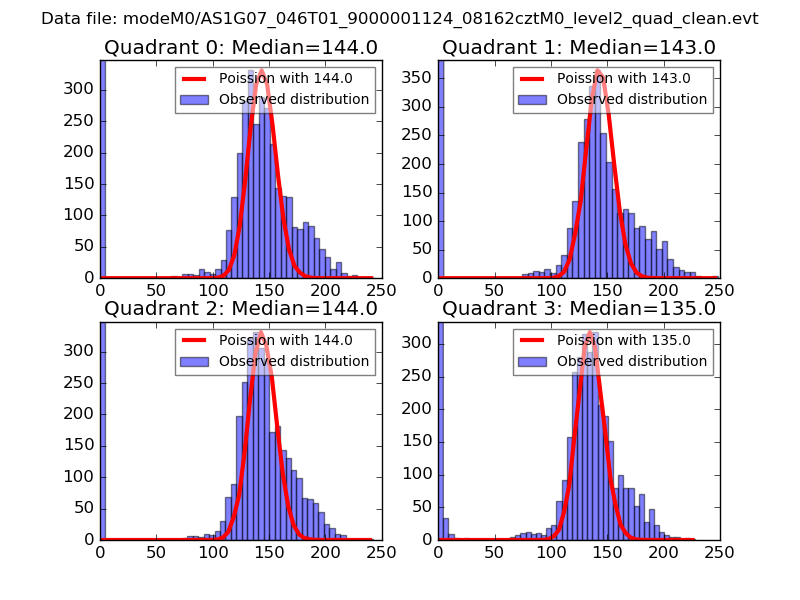 |
 |
| Quadrant-wise count rates Data is divided into 100 sec bins |
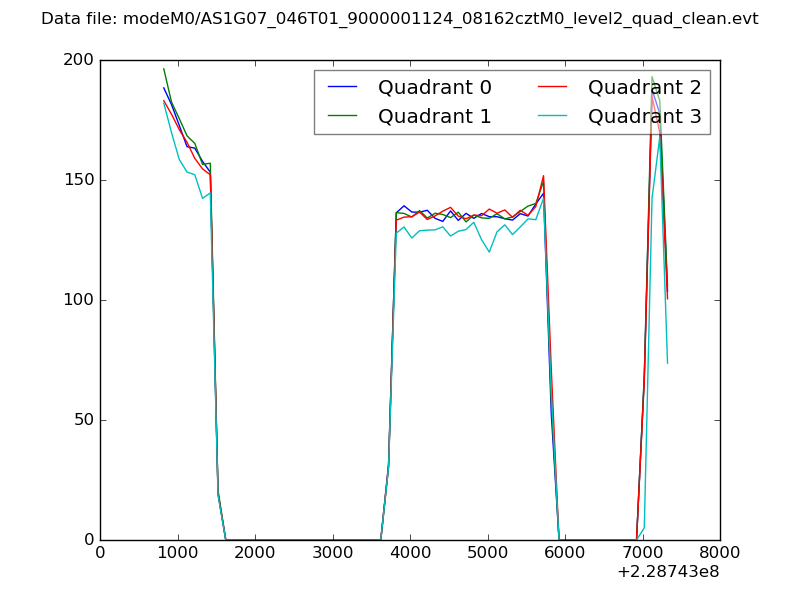 |
|
| Module-wise count rates for Quadrant A Data is divided into 100 sec bins |
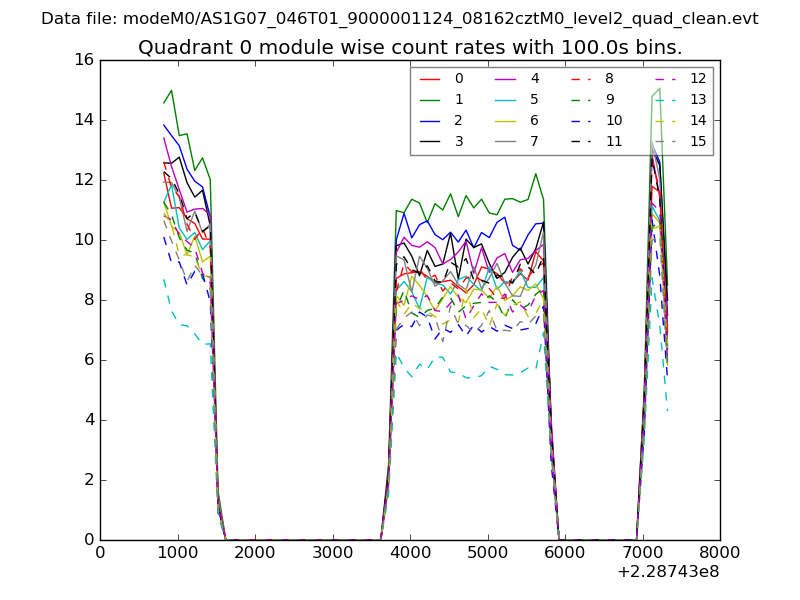 |
 |
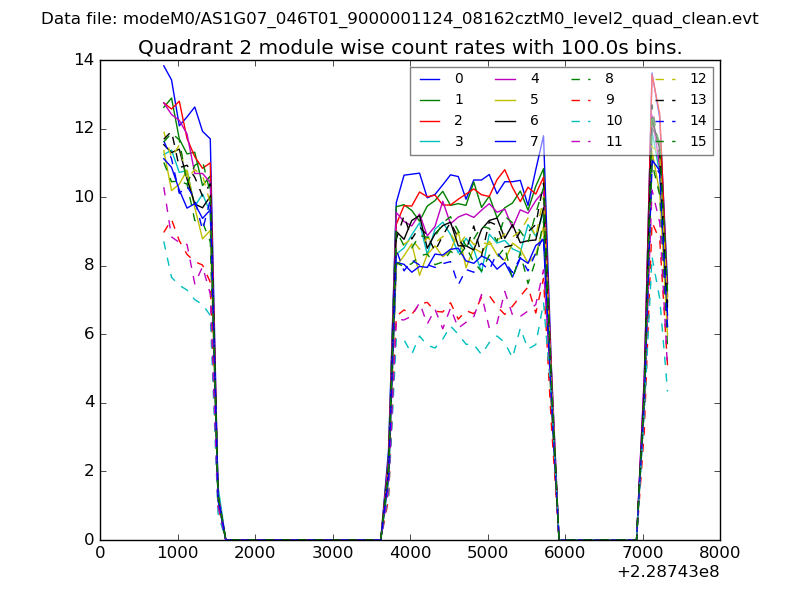
| Module-wise count rates for Quadrant B Data is divided into 100 sec bins |
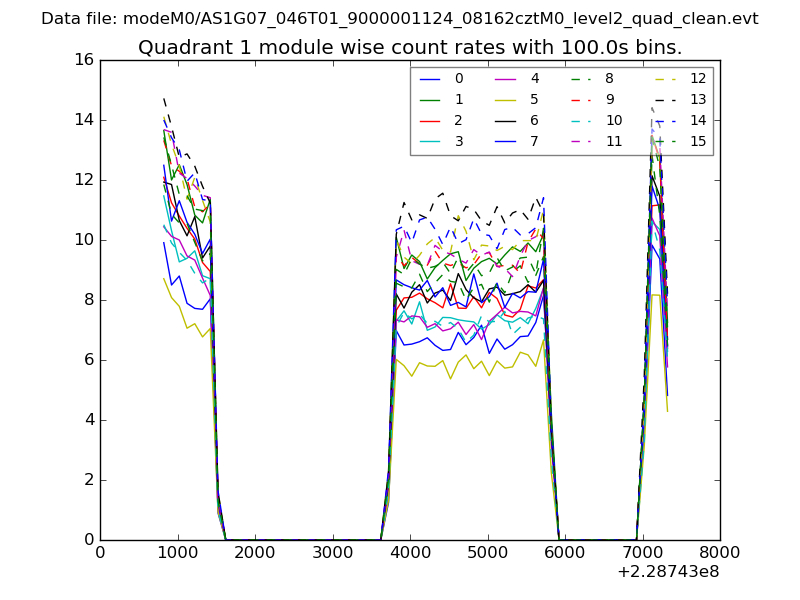 |
 |
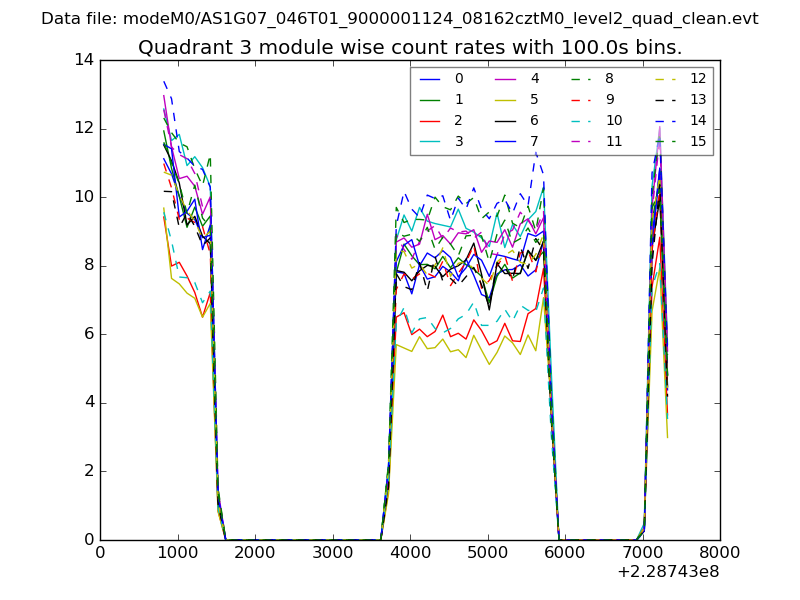
| Module-wise count rates for Quadrant C Data is divided into 100 sec bins |
 |
 |
| Module-wise count rates for Quadrant D Data is divided into 100 sec bins |
 |
 |
| Parameter | Plot |
|---|---|
| CZT HV Monitor | 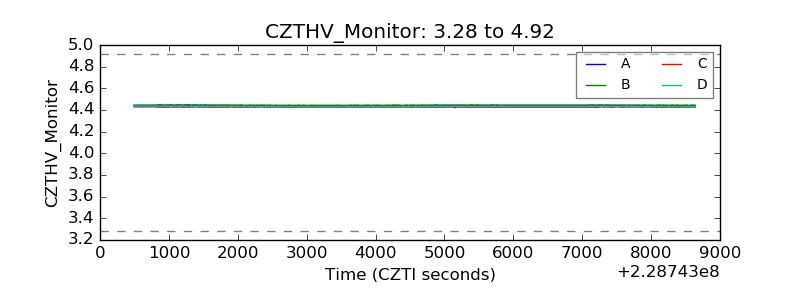 |
| D_VDD | 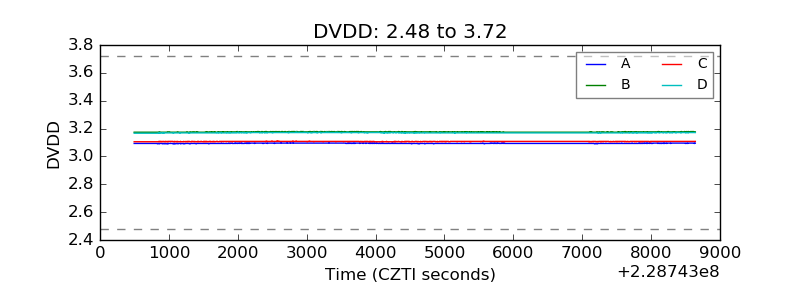 |
| Temperature 1 | 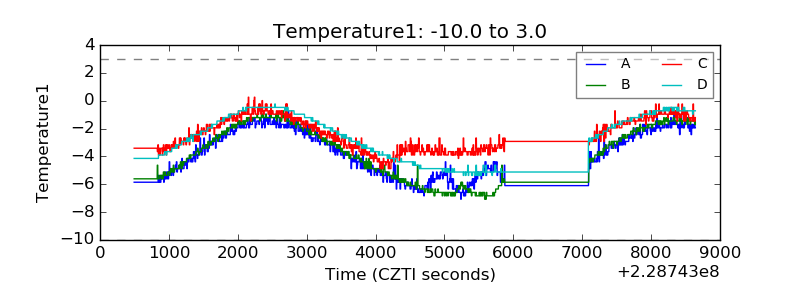 |
| Veto HV Monitor | 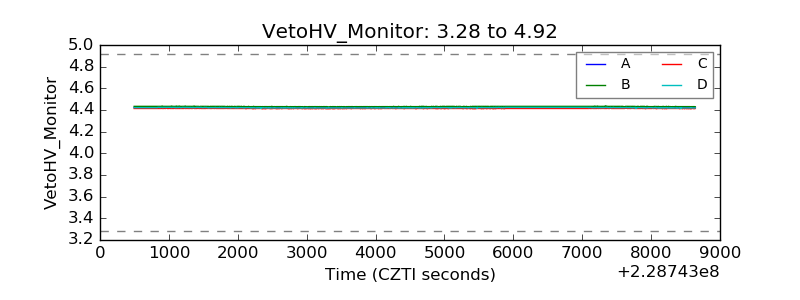 |
| Veto LLD | 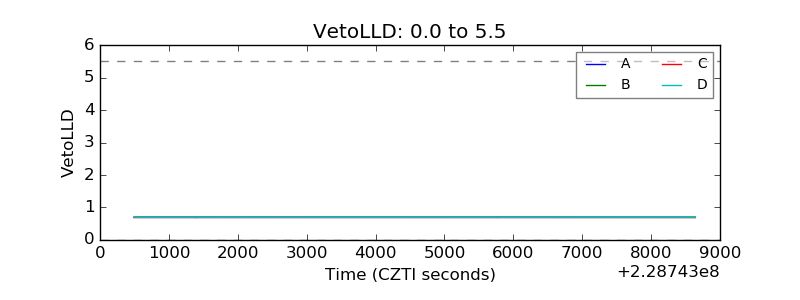 |
| Alpha Counter | 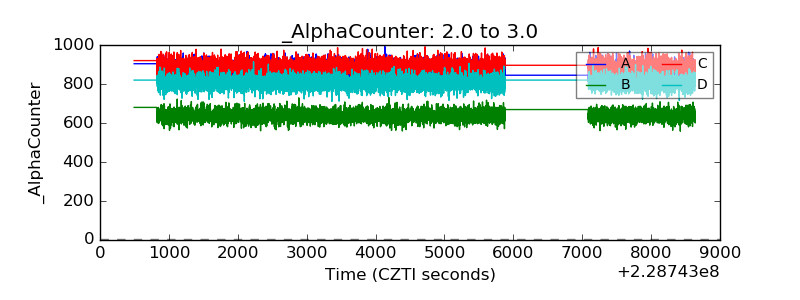 |
| _CPM_Rate | 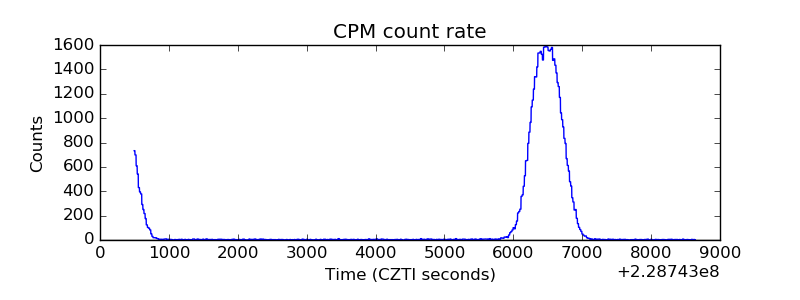 |
| CZT Counter |  |
| +2.5 Volts monitor |  |
| +5 Volts monitor |  |
| _ROLL_ROT | 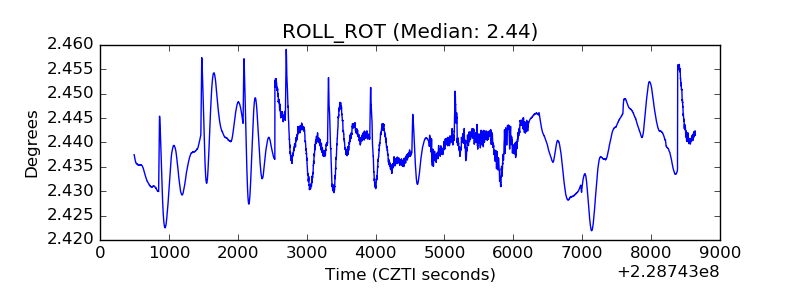 |
| _Roll_DEC | 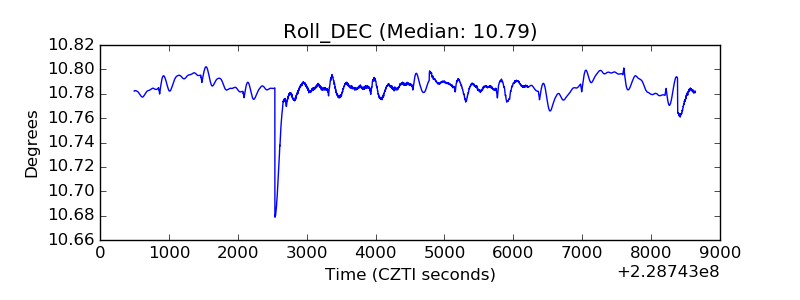 |
| _Roll_RA | 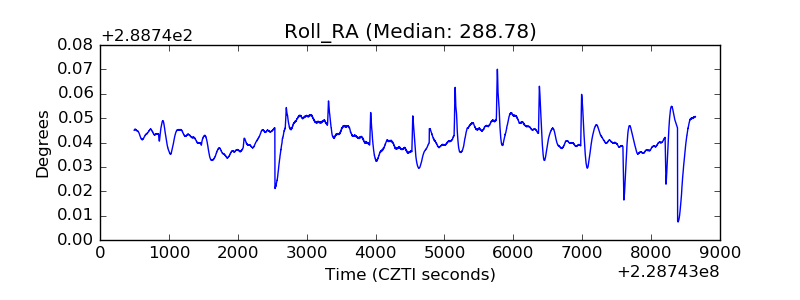 |
| Veto Counter | 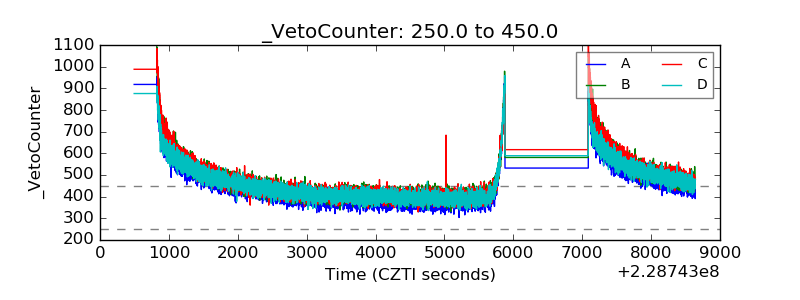 |