| Param | Original file | Final file |
|---|---|---|
| Filename | modeM0/AS1G07_046T01_9000001124_08163cztM0_level2.evt | modeM0/AS1G07_046T01_9000001124_08163cztM0_level2_quad_clean.evt |
| Size (bytes) | 268,557,120 | 26,890,560 |
| Size | 256.1 MB | 25.6 MB |
| Events in quadrant A | 1,651,438 | 148,010 |
| Events in quadrant B | 1,746,141 | 148,288 |
| Events in quadrant C | 1,906,535 | 146,370 |
| Events in quadrant D | 2,605,001 | 137,979 |
| Mode M0 | |||
|---|---|---|---|
| Quadrant | BADHDUFLAG | Total packets | Discarded packets |
| A | 0 | 6821 | 0 |
| B | 0 | 7179 | 0 |
| C | 0 | 7739 | 0 |
| D | 0 | 9777 | 0 |
| Mode SS | |||
|---|---|---|---|
| Quadrant | BADHDUFLAG | Total packets | Discarded packets |
| A | 0 | 64 | 0 |
| B | 0 | 64 | 0 |
| C | 0 | 64 | 0 |
| D | 0 | 64 | 0 |
| Quadrant | Total seconds | Saturated seconds | Saturation percentage |
|---|---|---|---|
| A | 3284 | 2 | 0.060901% |
| B | 3284 | 18 | 0.548112% |
| C | 3284 | 2 | 0.060901% |
| D | 3284 | 400 | 12.180268% |
Noise dominated data is calculated using 1-second bins in cleaned event files. If a bin has >2000 counts, and if more than 50% of those come from <1% of pixels, then it is considered to be noise-dominated and hence unusable.
| Quadrant | # 1 sec bins | Bins with >0 counts | Bins with >2000 counts | High rate bins dominated by noise | Noise dominated (total time) | Noise dominated (detector-on time) | Marked lightcurve |
|---|---|---|---|---|---|---|---|
| A | 3284 | 3284 | 0 | 0 | 0.00% | 0.00% | 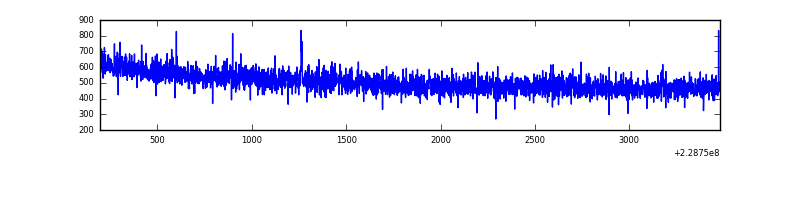 |
| B | 3284 | 3284 | 11 | 11 | 0.33% | 0.33% | 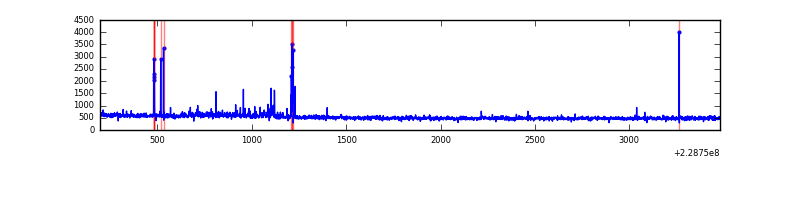 |
| C | 3284 | 3284 | 0 | 0 | 0.00% | 0.00% | 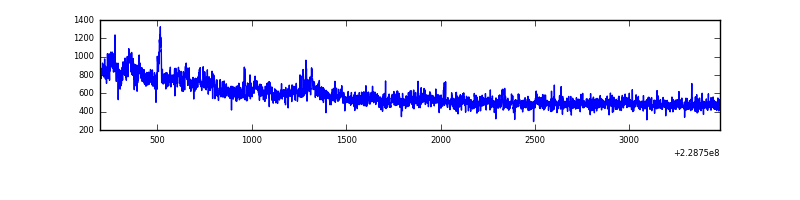 |
| D | 3284 | 3284 | 375 | 375 | 11.42% | 11.42% | 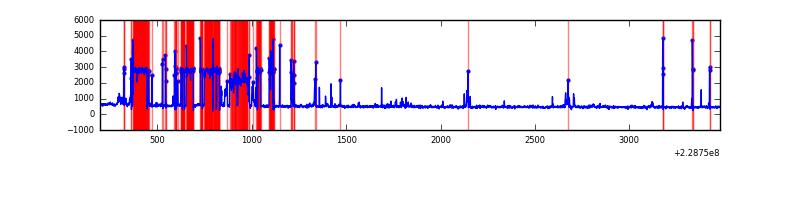 |
Top three noisy pixels from each quadrant. If the there are fewer than three noisy pixels in the level2.evt file, extra rows are filled as -1
| Pixel properties | Quadrant properties | ||||||
|---|---|---|---|---|---|---|---|
| Quadrant | DetID | PixID | Counts | Sigma | Mean | Median | Sigma |
| A | 0 | 226 | 4209 | 43.01 | 427 | 419 | 88.1 |
| A | 12 | 194 | 3801 | 38.38 | 427 | 419 | 88.1 |
| A | 13 | 254 | 3408 | 33.92 | 427 | 419 | 88.1 |
| B | 0 | 214 | 43445 | 532.79 | 424 | 415 | 80.8 |
| B | 10 | 16 | 31553 | 385.55 | 424 | 415 | 80.8 |
| B | 4 | 173 | 15444 | 186.09 | 424 | 415 | 80.8 |
| C | 1 | 16 | 306000 | 3219.01 | 410 | 414 | 94.9 |
| C | 13 | 61 | 3167 | 29.0 | 410 | 414 | 94.9 |
| C | 3 | 202 | 1053 | 6.73 | 410 | 414 | 94.9 |
| D | 1 | 52 | 1085356 | 11458.13 | 380 | 369 | 94.7 |
| D | 12 | 233 | 40042 | 418.97 | 380 | 369 | 94.7 |
| D | 13 | 169 | 13708 | 140.87 | 380 | 369 | 94.7 |
Histogram calculated using DETX and DETY for each event in the final _common_clean file
| Quadrant A | 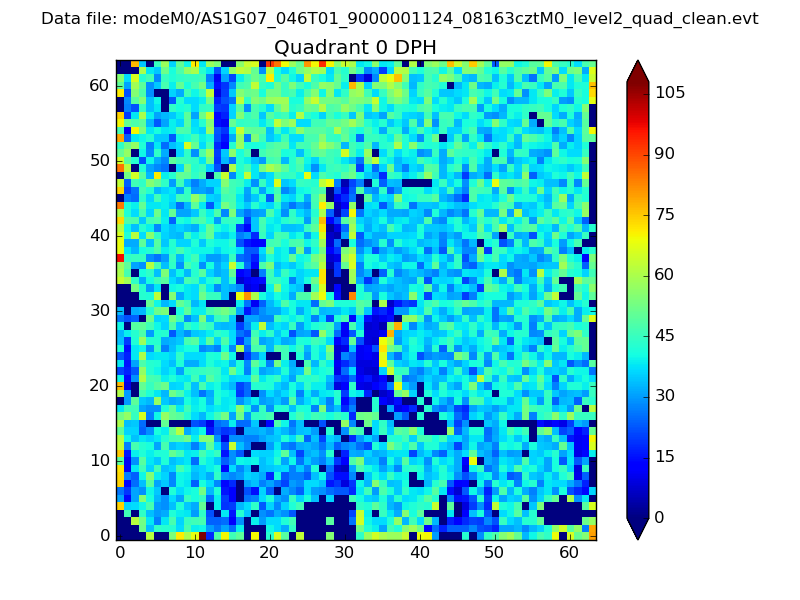 |
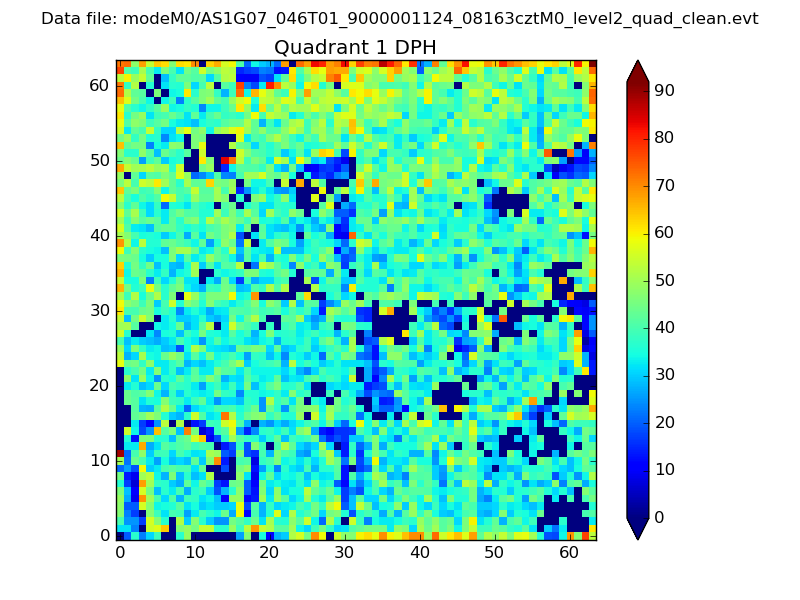 |
Quadrant B |
|---|---|---|---|
| Quadrant D | 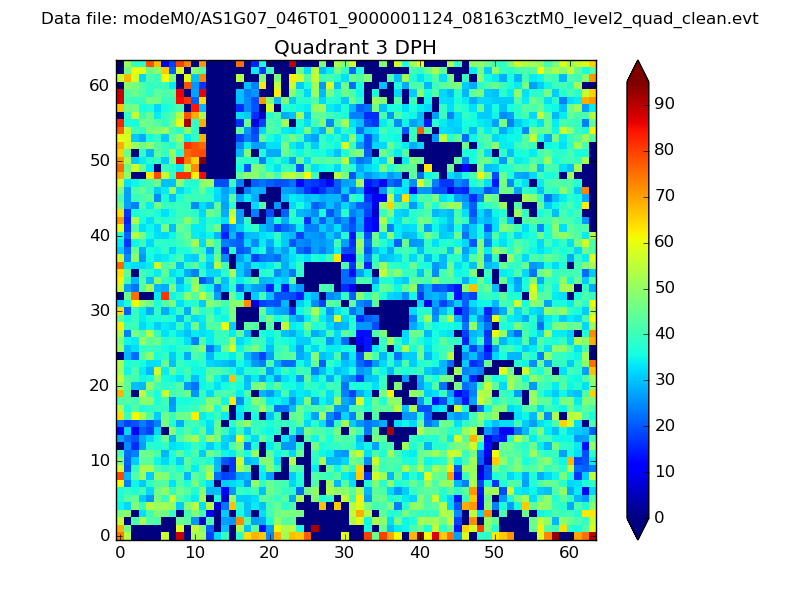 |
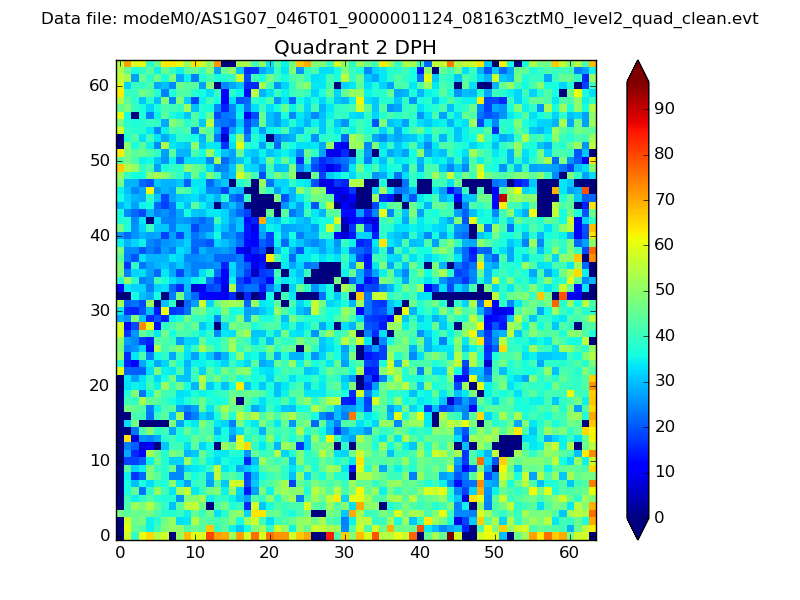 |
Quadrant C |
| Plot type | Count rate plots | Images |
|---|---|---|
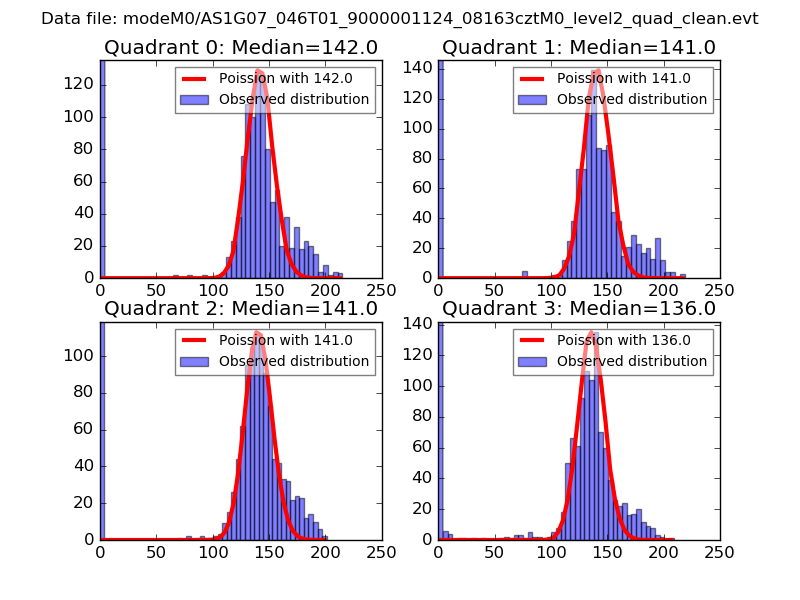
| Comparison with Poisson distribution Blue bars denote a histogram of data divided into 1 sec bins. Red curve is a Poisson curve with rate = median count rate of data. |
 |
 |
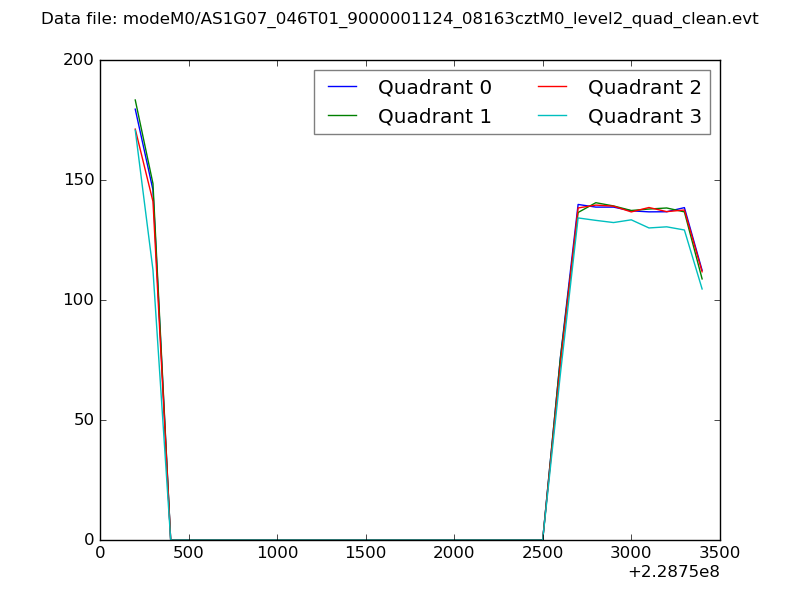
| Quadrant-wise count rates Data is divided into 100 sec bins |
 |
|
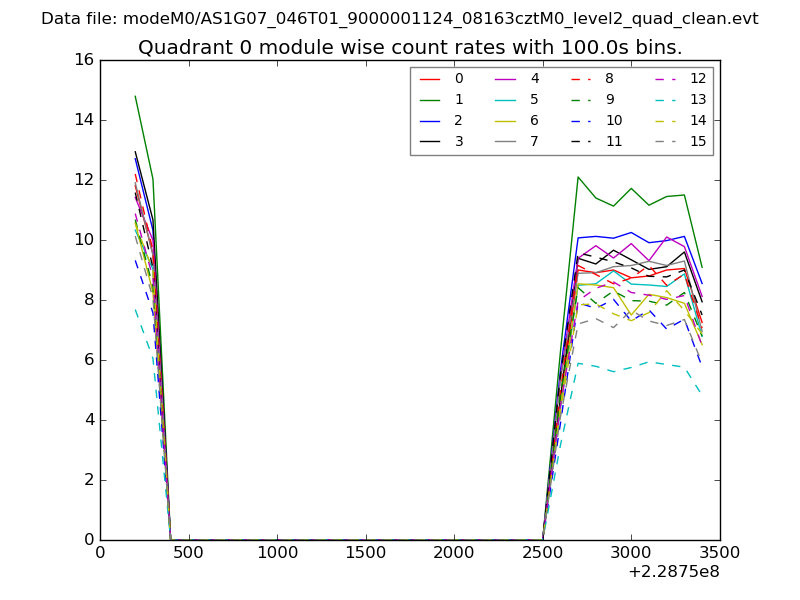
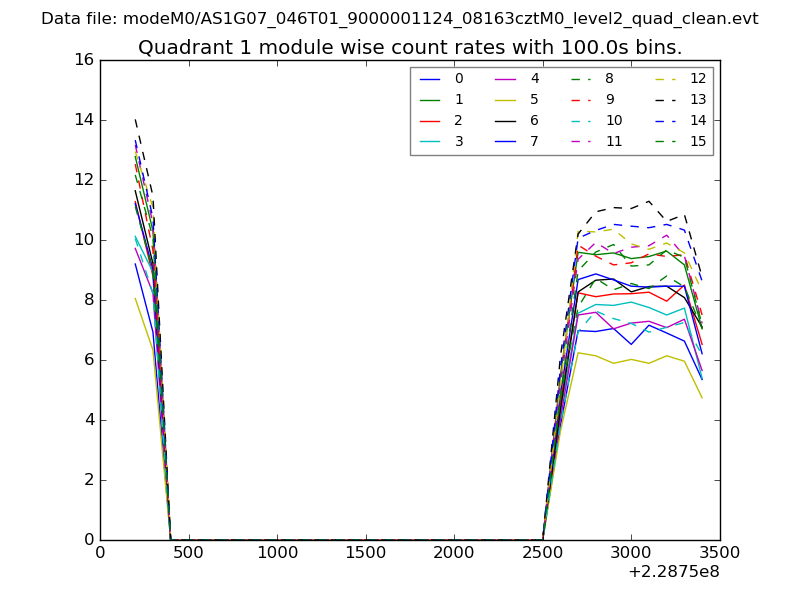
| Module-wise count rates for Quadrant A Data is divided into 100 sec bins |
 |
 |
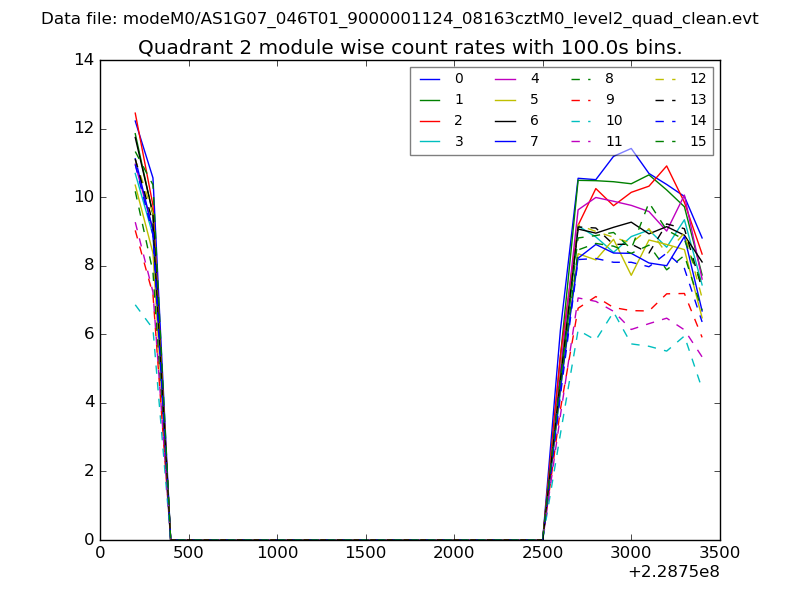
| Module-wise count rates for Quadrant B Data is divided into 100 sec bins |
 |
 |
| Module-wise count rates for Quadrant C Data is divided into 100 sec bins |
 |
 |
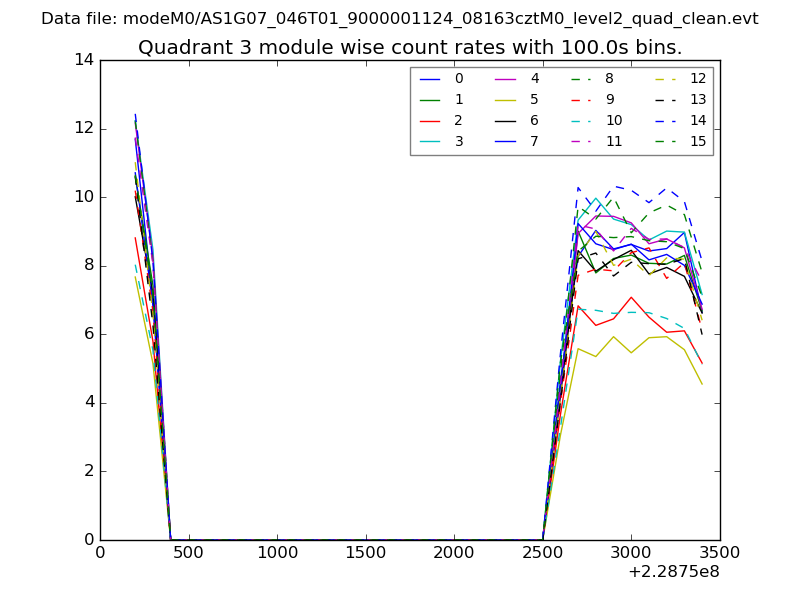
| Module-wise count rates for Quadrant D Data is divided into 100 sec bins |
 |
 |
| Parameter | Plot |
|---|---|
| CZT HV Monitor | 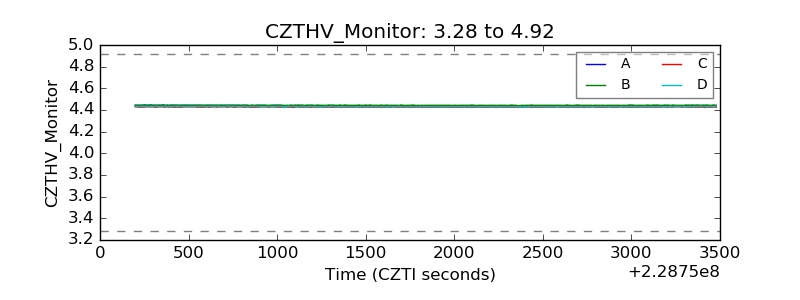 |
| D_VDD | 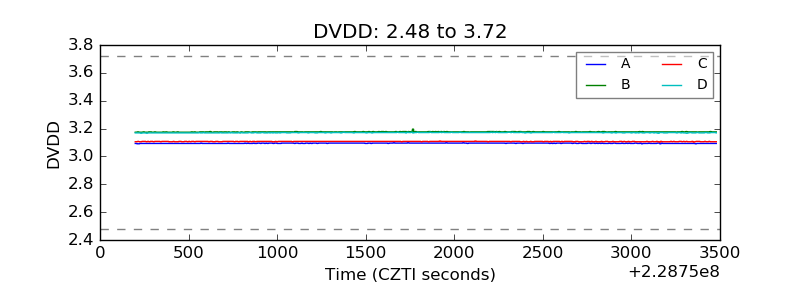 |
| Temperature 1 |  |
| Veto HV Monitor | 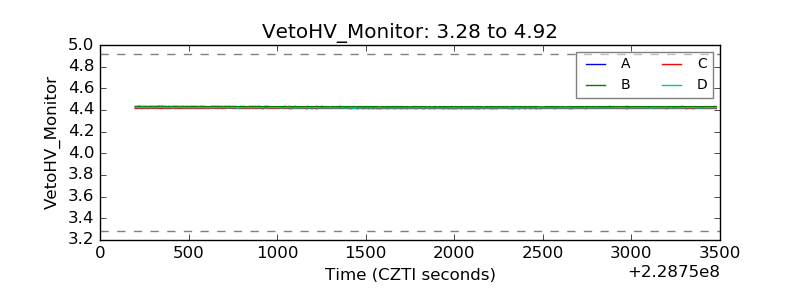 |
| Veto LLD | 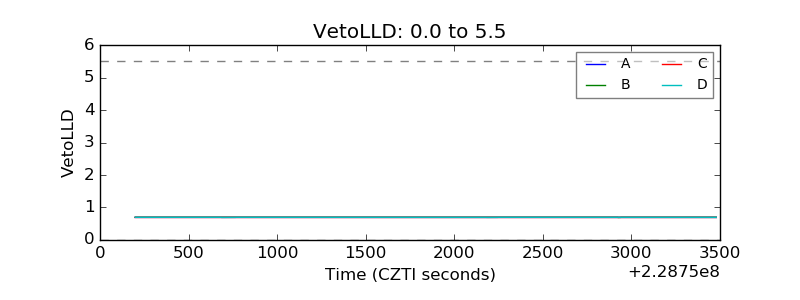 |
| Alpha Counter | 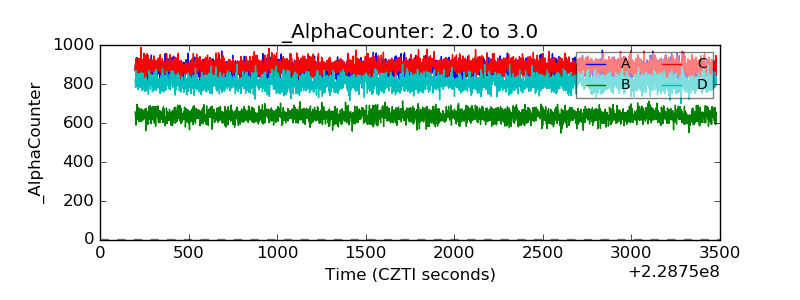 |
| _CPM_Rate | 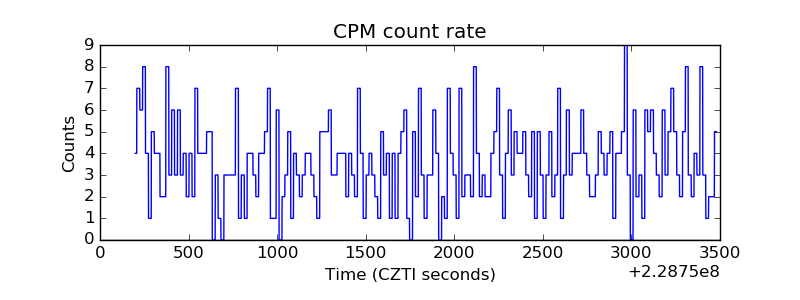 |
| CZT Counter | 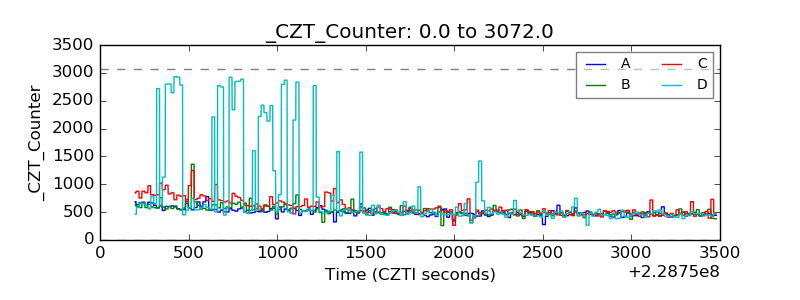 |
| +2.5 Volts monitor |  |
| +5 Volts monitor |  |
| _ROLL_ROT | 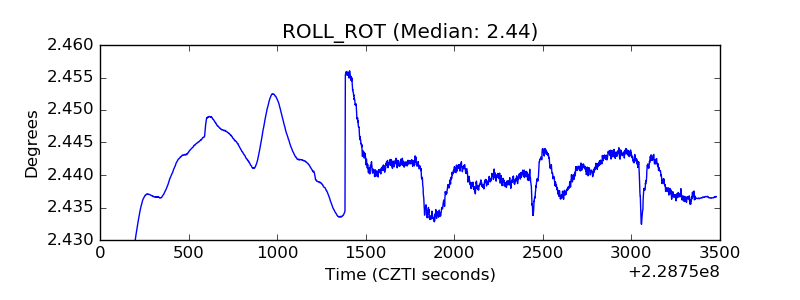 |
| _Roll_DEC | 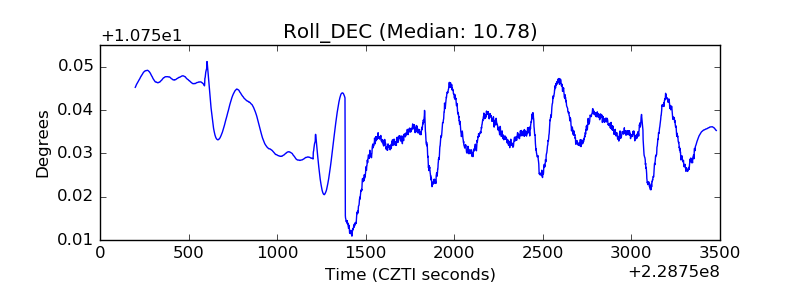 |
| _Roll_RA | 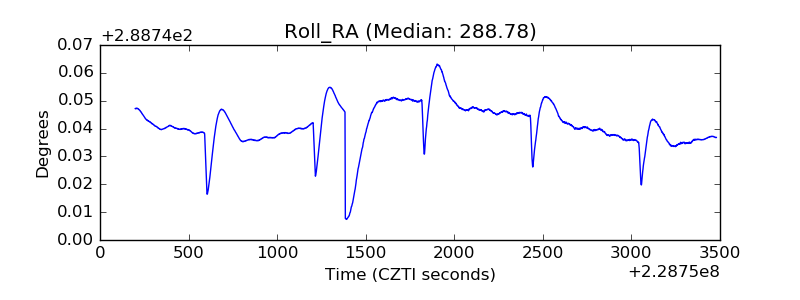 |
| Veto Counter | 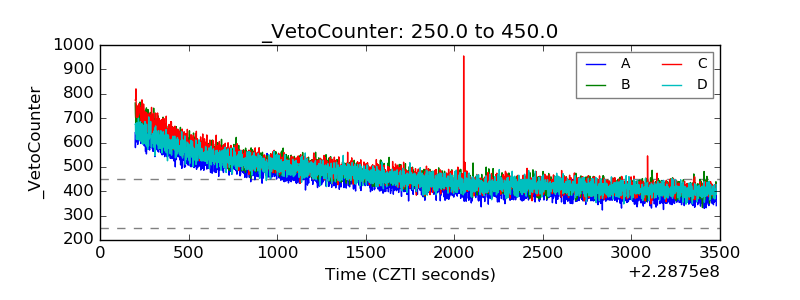 |