| Param | Original file | Final file |
|---|---|---|
| Filename | modeM0/AS1A03_036T01_9000001128cztM0_level2.fits | modeM0/AS1A03_036T01_9000001128cztM0_level2_quad_clean.evt |
| Size (bytes) | 504,918,720 | 521,697,600 |
| Size | 481.5 MB | 497.5 MB |
| Events in quadrant A | 3,024,116 | 3,180,148 |
| Events in quadrant B | 2,906,838 | 3,131,559 |
| Events in quadrant C | 2,998,616 | 3,013,250 |
| Events in quadrant D | 2,550,566 | 2,664,681 |
| Mode M9 | |||
|---|---|---|---|
| Quadrant | BADHDUFLAG | Total packets | Discarded packets |
| A | 0 | 70 | 0 |
| B | 0 | 70 | 0 |
| C | 0 | 70 | 0 |
| D | 0 | 70 | 0 |
| Mode SS | |||
|---|---|---|---|
| Quadrant | BADHDUFLAG | Total packets | Discarded packets |
| A | 0 | 1134 | 0 |
| B | 0 | 1134 | 0 |
| C | 0 | 1134 | 0 |
| D | 0 | 1134 | 0 |
| Mode M0 | |||
|---|---|---|---|
| Quadrant | BADHDUFLAG | Total packets | Discarded packets |
| A | 0 | 113462 | 0 |
| B | 0 | 120393 | 0 |
| C | 0 | 113053 | 0 |
| D | 0 | 135723 | 0 |
| Quadrant | Total seconds | Saturated seconds | Saturation percentage |
|---|---|---|---|
| A | 55536 | 451 | 0.812086% |
| B | 55535 | 1148 | 2.067165% |
| C | 55536 | 365 | 0.657231% |
| D | 55536 | 2037 | 3.667891% |
Noise dominated data is calculated using 1-second bins in cleaned event files. If a bin has >2000 counts, and if more than 50% of those come from <1% of pixels, then it is considered to be noise-dominated and hence unusable.
| Quadrant | # 1 sec bins | Bins with >0 counts | Bins with >2000 counts | High rate bins dominated by noise | Noise dominated (total time) | Noise dominated (detector-on time) | Marked lightcurve |
|---|---|---|---|---|---|---|---|
| A | 62546 | 55533 | 0 | 0 | 0.00% | 0.00% |  |
| B | 62546 | 55431 | 0 | 0 | 0.00% | 0.00% |  |
| C | 62546 | 55533 | 0 | 0 | 0.00% | 0.00% |  |
| D | 62546 | 55520 | 0 | 0 | 0.00% | 0.00% |  |
Top three noisy pixels from each quadrant. If the there are fewer than three noisy pixels in the level2.evt file, extra rows are filled as -1
| Pixel properties | Quadrant properties | ||||||
|---|---|---|---|---|---|---|---|
| Quadrant | DetID | PixID | Counts | Sigma | Mean | Median | Sigma |
| A | 0 | 29 | 2971 | 11.14 | 786 | 732 | 201.0 |
| A | 7 | 110 | 2489 | 8.74 | 786 | 732 | 201.0 |
| A | 0 | 30 | 2326 | 7.93 | 786 | 732 | 201.0 |
| B | 2 | 9 | 2535 | 11.66 | 766 | 726 | 155.2 |
| B | 14 | 254 | 2017 | 8.32 | 766 | 726 | 155.2 |
| B | 3 | 17 | 1960 | 7.95 | 766 | 726 | 155.2 |
| C | 12 | 241 | 2157 | 6.76 | 790 | 729 | 211.1 |
| C | 1 | 80 | 2129 | 6.63 | 790 | 729 | 211.1 |
| C | 1 | 81 | 2106 | 6.52 | 790 | 729 | 211.1 |
| D | 6 | 231 | 1856 | 6.17 | 727 | 659 | 194.0 |
| D | 3 | 14 | 1829 | 6.03 | 727 | 659 | 194.0 |
| D | 10 | 189 | 1798 | 5.87 | 727 | 659 | 194.0 |
Histogram calculated using DETX and DETY for each event in the final _common_clean file
| Quadrant A | 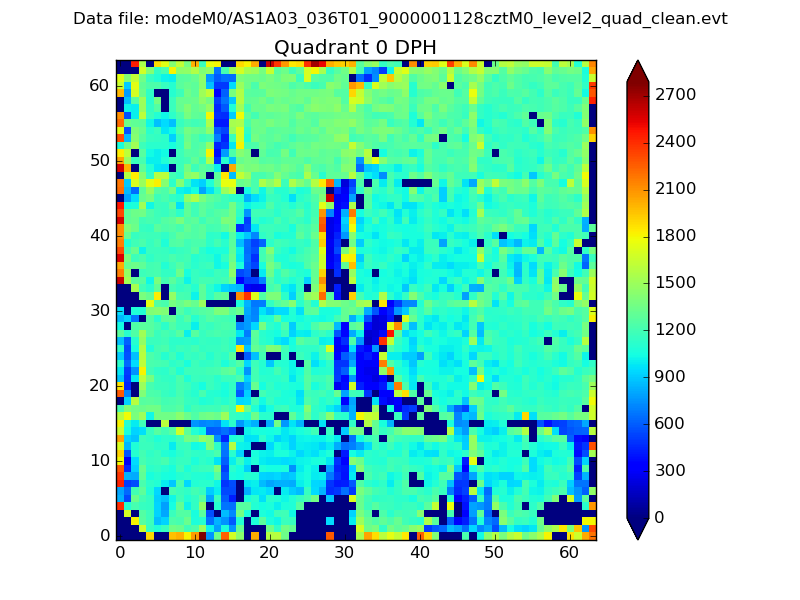 |
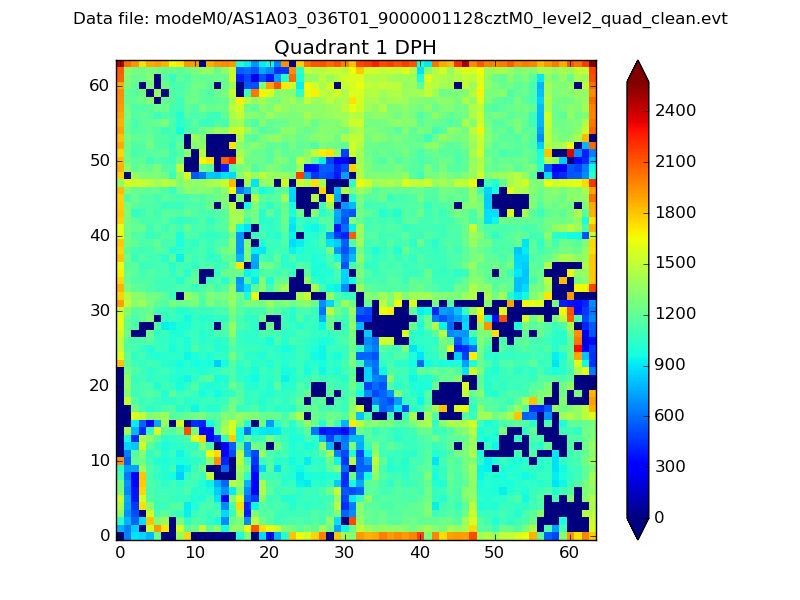 |
Quadrant B |
|---|---|---|---|
| Quadrant D |  |
 |
Quadrant C |
| Plot type | Count rate plots | Images |
|---|---|---|
| Comparison with Poisson distribution Blue bars denote a histogram of data divided into 1 sec bins. Red curve is a Poisson curve with rate = median count rate of data. |
 |
 |
| Quadrant-wise count rates Data is divided into 100 sec bins |
 |
|
| Module-wise count rates for Quadrant A Data is divided into 100 sec bins |
 |
 |
| Module-wise count rates for Quadrant B Data is divided into 100 sec bins |
 |
 |
| Module-wise count rates for Quadrant C Data is divided into 100 sec bins |
 |
 |
| Module-wise count rates for Quadrant D Data is divided into 100 sec bins |
 |
 |
| Parameter | Plot |
|---|---|
| CZT HV Monitor |  |
| D_VDD |  |
| Temperature 1 |  |
| Veto HV Monitor |  |
| Veto LLD |  |
| Alpha Counter |  |
| _CPM_Rate |  |
| CZT Counter |  |
| +2.5 Volts monitor |  |
| +5 Volts monitor |  |
| _ROLL_ROT |  |
| _Roll_DEC |  |
| _Roll_RA |  |
| Veto Counter |  |