| Param | Original file | Final file |
|---|---|---|
| Filename | modeM0/AS1A03_036T01_9000001128_08180cztM0_level2.evt | modeM0/AS1A03_036T01_9000001128_08180cztM0_level2_quad_clean.evt |
| Size (bytes) | 472,124,160 | 91,333,440 |
| Size | 450.3 MB | 87.1 MB |
| Events in quadrant A | 3,025,147 | 593,417 |
| Events in quadrant B | 4,055,860 | 555,435 |
| Events in quadrant C | 2,997,609 | 589,789 |
| Events in quadrant D | 3,766,808 | 562,687 |
| Mode M9 | |||
|---|---|---|---|
| Quadrant | BADHDUFLAG | Total packets | Discarded packets |
| A | 0 | 9 | 0 |
| B | 0 | 9 | 0 |
| C | 0 | 9 | 0 |
| D | 0 | 9 | 0 |
| Mode SS | |||
|---|---|---|---|
| Quadrant | BADHDUFLAG | Total packets | Discarded packets |
| A | 0 | 134 | 0 |
| B | 0 | 134 | 0 |
| C | 0 | 134 | 0 |
| D | 0 | 134 | 0 |
| Mode M0 | |||
|---|---|---|---|
| Quadrant | BADHDUFLAG | Total packets | Discarded packets |
| A | 0 | 13670 | 2 |
| B | 0 | 16525 | 1 |
| C | 0 | 13621 | 1 |
| D | 0 | 15827 | 1 |
| Quadrant | Total seconds | Saturated seconds | Saturation percentage |
|---|---|---|---|
| A | 6664 | 43 | 0.645258% |
| B | 6664 | 484 | 7.262905% |
| C | 6664 | 56 | 0.840336% |
| D | 6664 | 150 | 2.250900% |
Noise dominated data is calculated using 1-second bins in cleaned event files. If a bin has >2000 counts, and if more than 50% of those come from <1% of pixels, then it is considered to be noise-dominated and hence unusable.
| Quadrant | # 1 sec bins | Bins with >0 counts | Bins with >2000 counts | High rate bins dominated by noise | Noise dominated (total time) | Noise dominated (detector-on time) | Marked lightcurve |
|---|---|---|---|---|---|---|---|
| A | 7549 | 6665 | 0 | 0 | 0.00% | 0.00% | 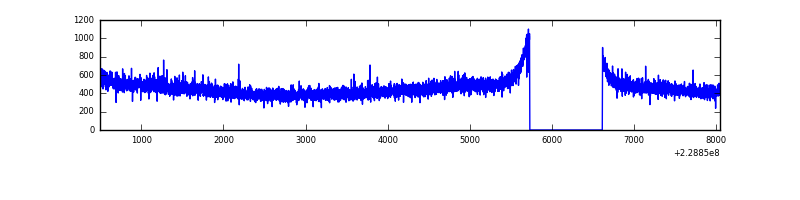 |
| B | 7549 | 6665 | 332 | 332 | 4.40% | 4.98% | 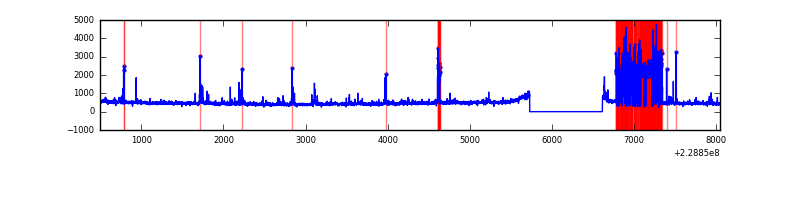 |
| C | 7549 | 6665 | 0 | 0 | 0.00% | 0.00% | 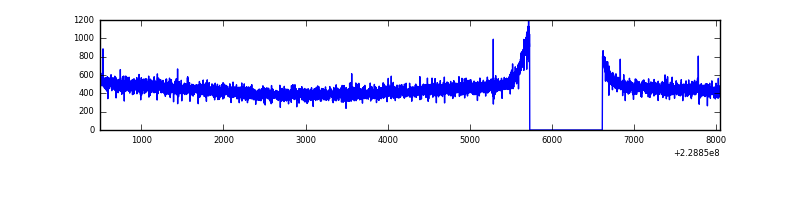 |
| D | 7549 | 6665 | 54 | 54 | 0.72% | 0.81% | 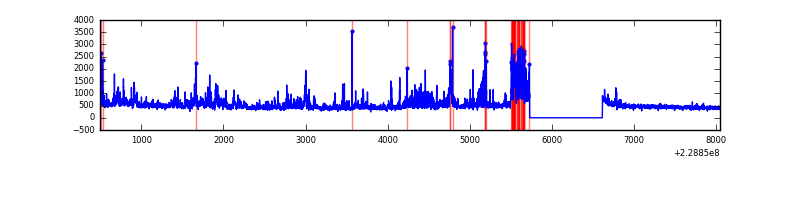 |
Top three noisy pixels from each quadrant. If the there are fewer than three noisy pixels in the level2.evt file, extra rows are filled as -1
| Pixel properties | Quadrant properties | ||||||
|---|---|---|---|---|---|---|---|
| Quadrant | DetID | PixID | Counts | Sigma | Mean | Median | Sigma |
| A | 8 | 15 | 21089 | 127.54 | 778 | 760 | 159.4 |
| A | 0 | 226 | 7466 | 42.07 | 778 | 760 | 159.4 |
| A | 12 | 194 | 7188 | 40.33 | 778 | 760 | 159.4 |
| B | 0 | 213 | 944739 | 6760.41 | 743 | 725 | 139.6 |
| B | 4 | 81 | 136738 | 974.04 | 743 | 725 | 139.6 |
| B | 10 | 16 | 32268 | 225.89 | 743 | 725 | 139.6 |
| C | 1 | 3 | 6296 | 30.93 | 767 | 769 | 178.7 |
| C | 13 | 61 | 5785 | 28.07 | 767 | 769 | 178.7 |
| C | 3 | 202 | 1936 | 6.53 | 767 | 769 | 178.7 |
| D | 1 | 52 | 451168 | 2420.83 | 759 | 737 | 186.1 |
| D | 12 | 227 | 167797 | 897.86 | 759 | 737 | 186.1 |
| D | 12 | 233 | 101283 | 540.38 | 759 | 737 | 186.1 |
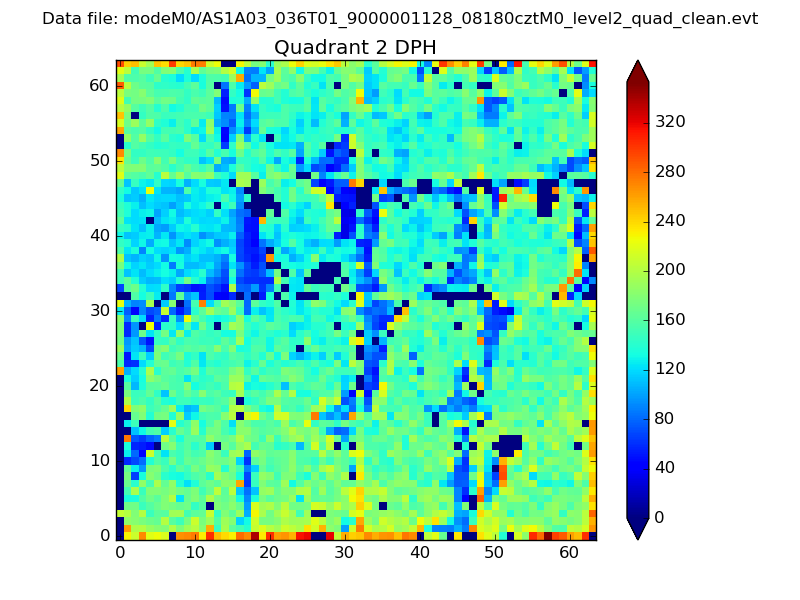
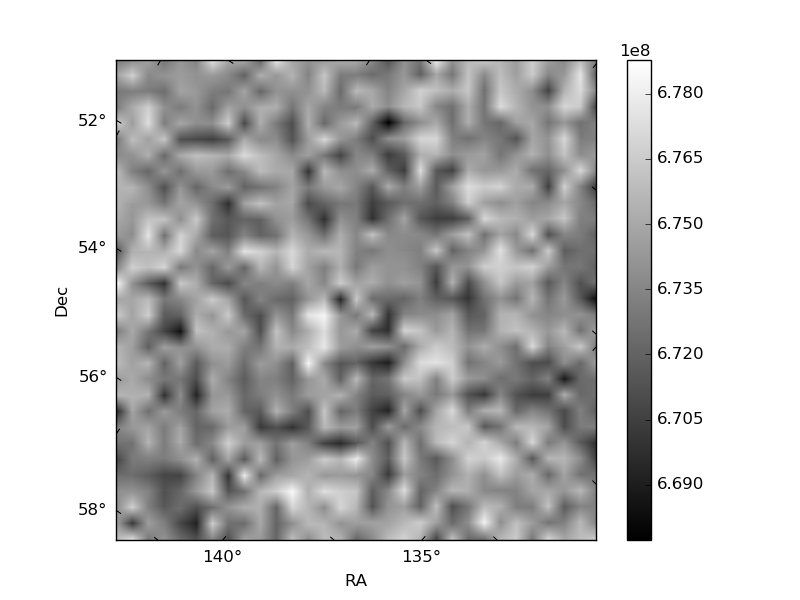
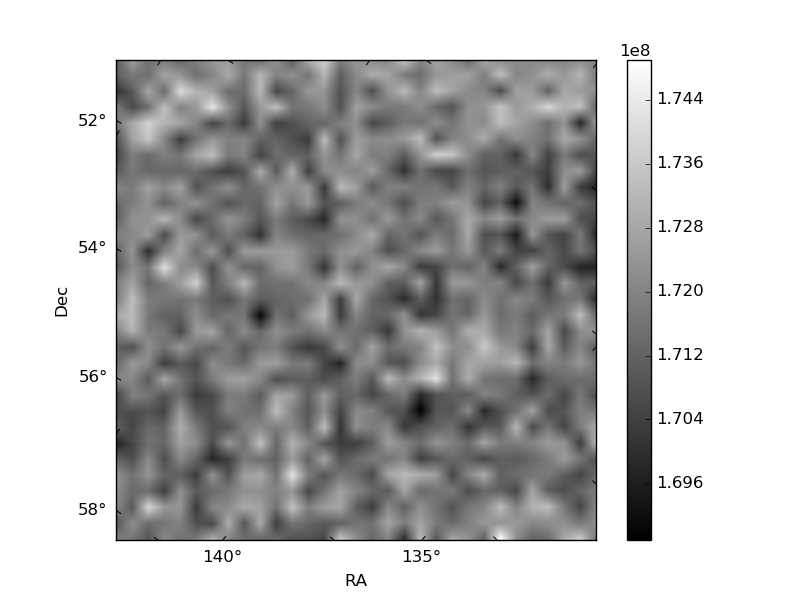
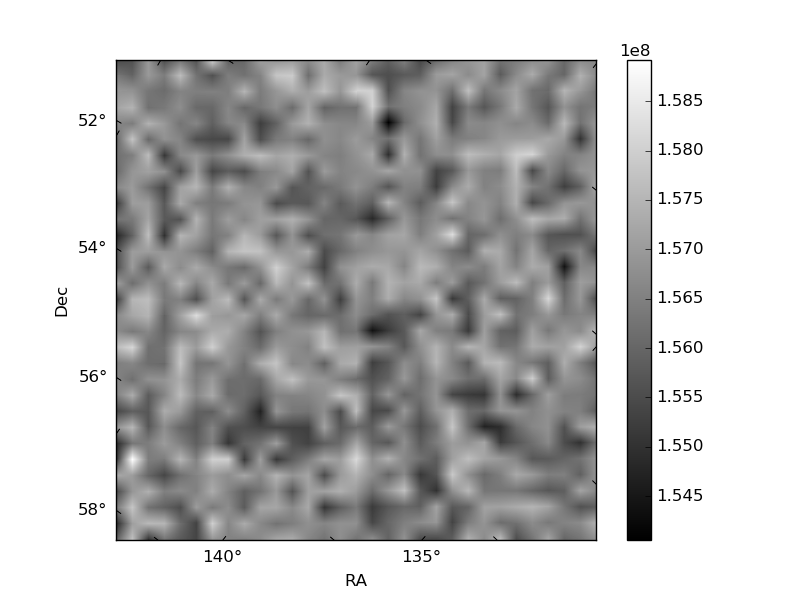
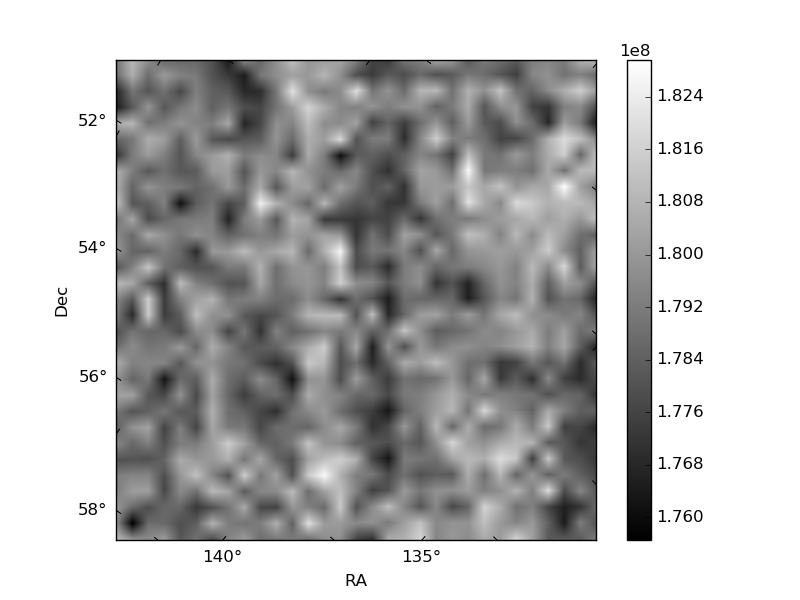
Histogram calculated using DETX and DETY for each event in the final _common_clean file
| Quadrant A | 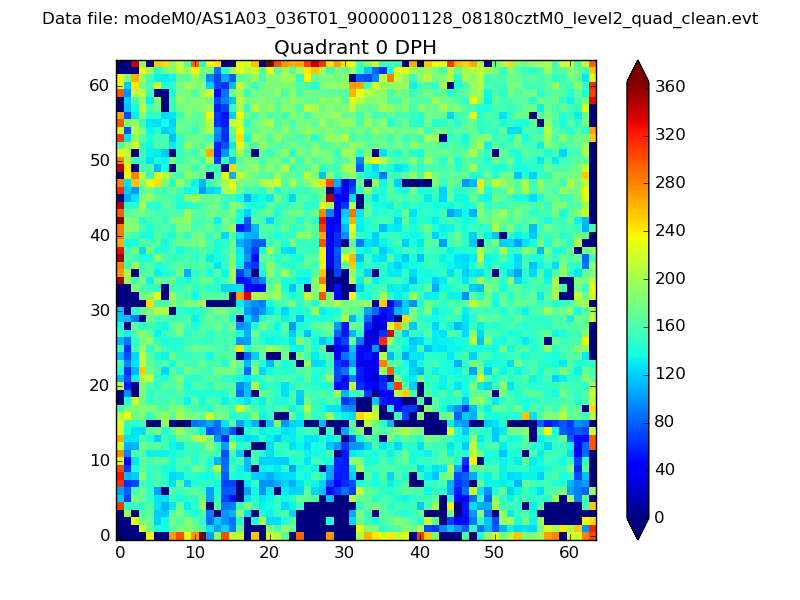 |
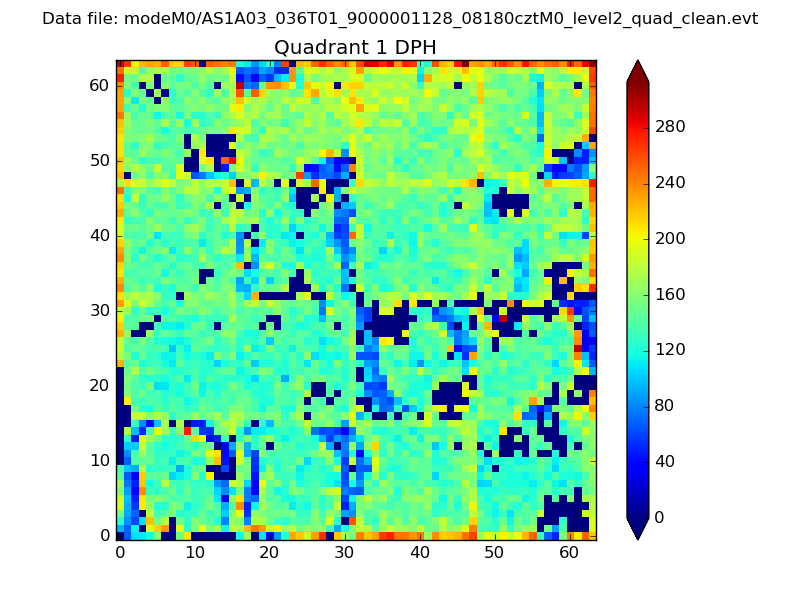 |
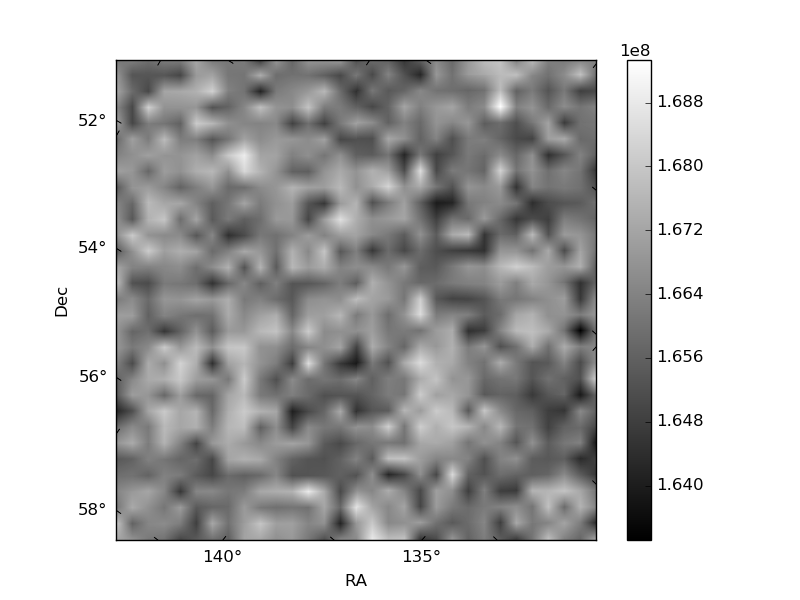
Quadrant B |
|---|---|---|---|
| Quadrant D | 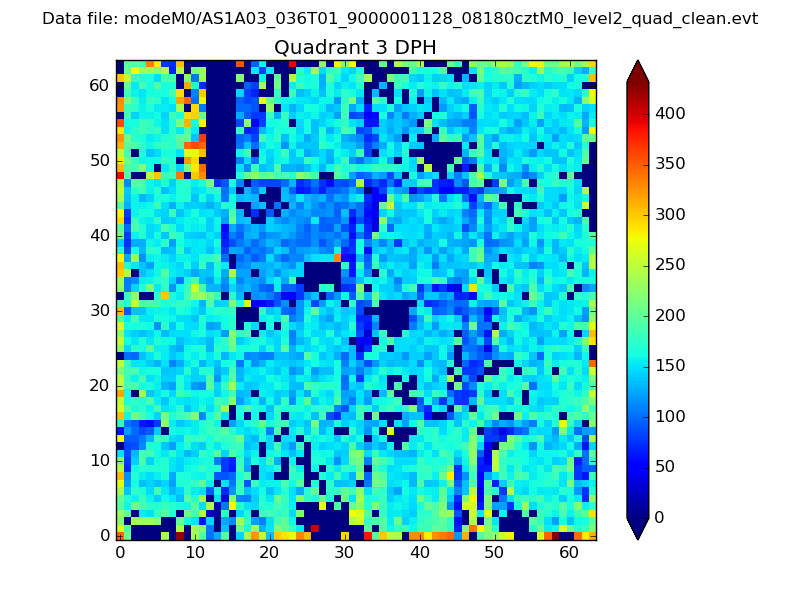 |
 |
Quadrant C |
| Plot type | Count rate plots | Images |
|---|---|---|
| Comparison with Poisson distribution Blue bars denote a histogram of data divided into 1 sec bins. Red curve is a Poisson curve with rate = median count rate of data. |
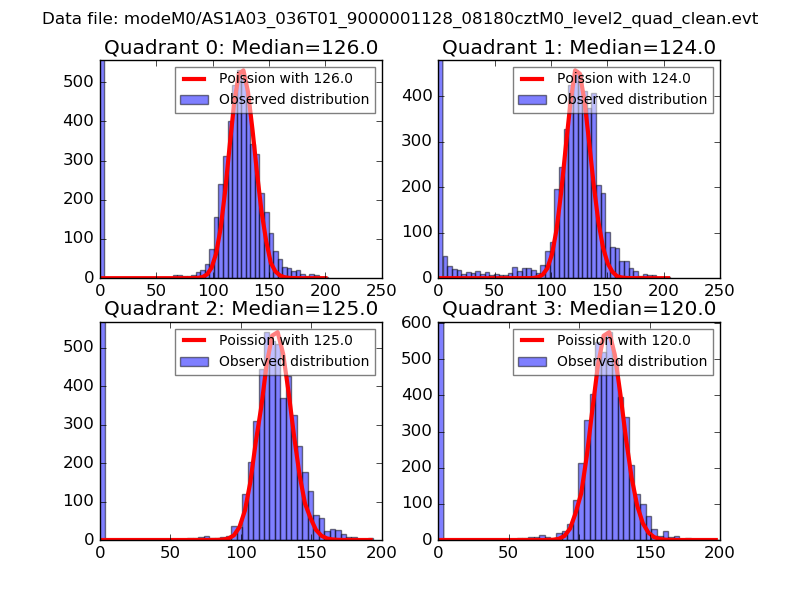 |
 |
| Quadrant-wise count rates Data is divided into 100 sec bins |
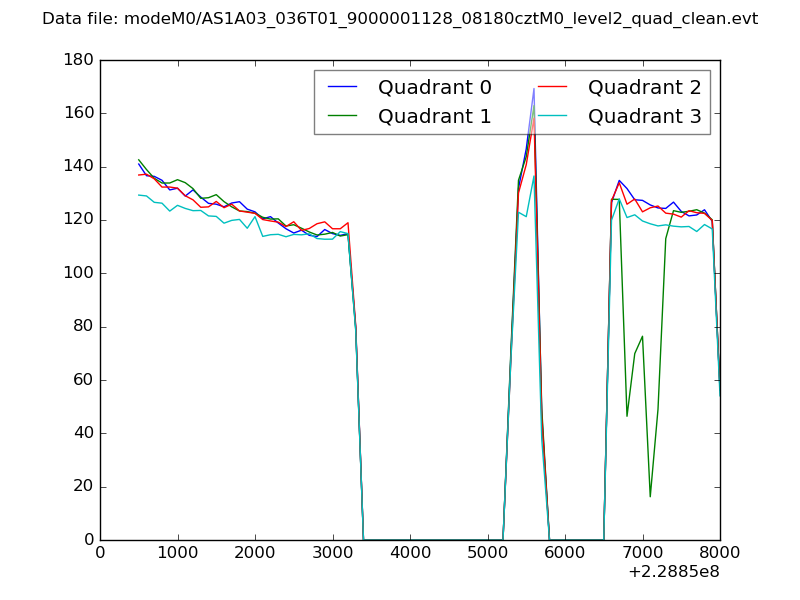 |
|
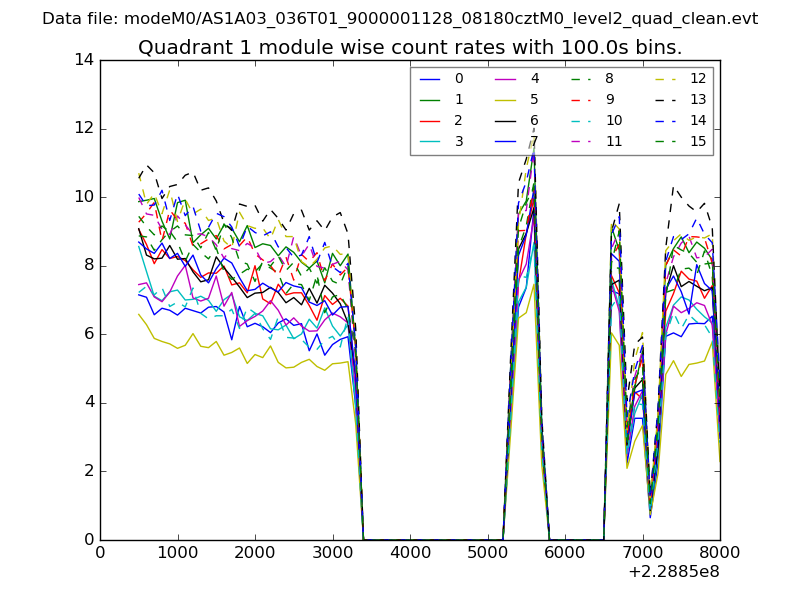
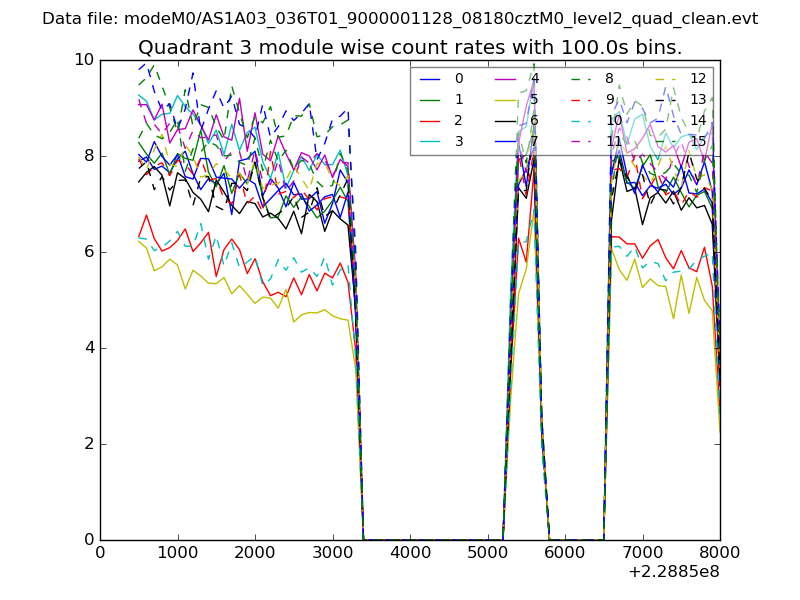
| Module-wise count rates for Quadrant A Data is divided into 100 sec bins |
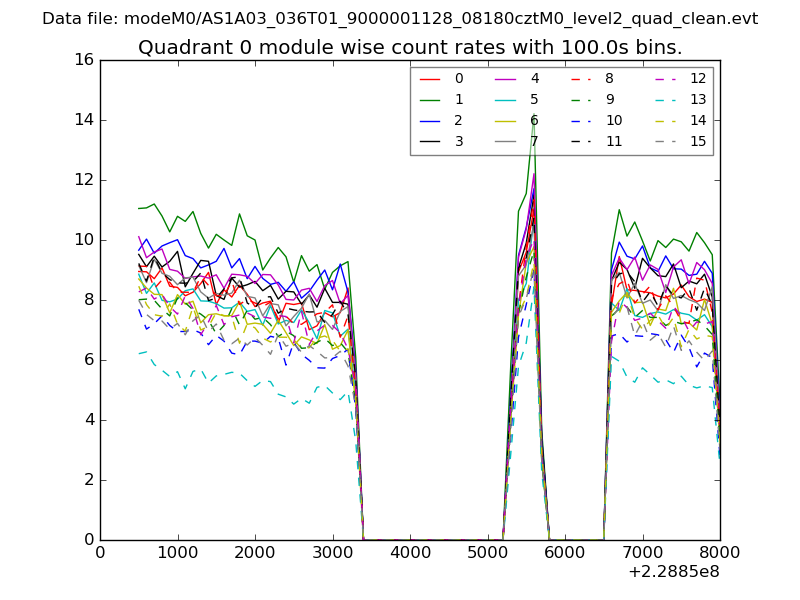 |
 |
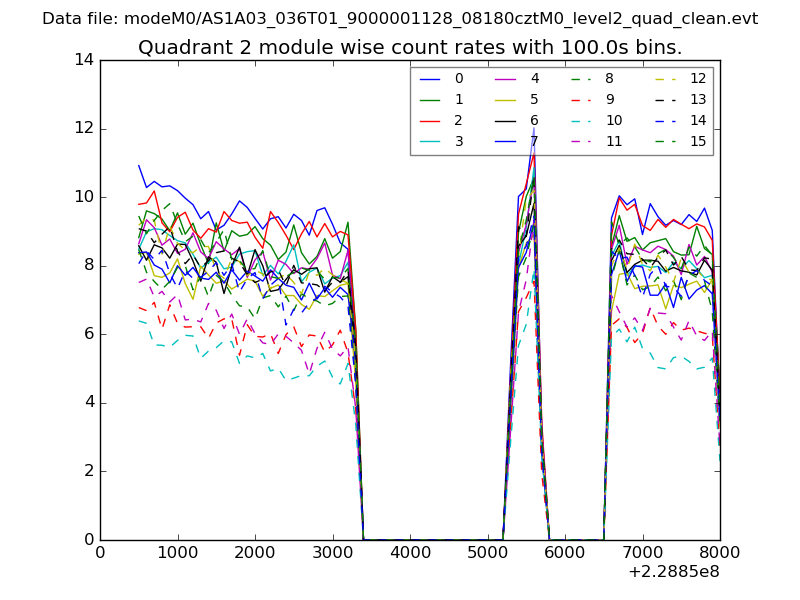
| Module-wise count rates for Quadrant B Data is divided into 100 sec bins |
 |
 |
| Module-wise count rates for Quadrant C Data is divided into 100 sec bins |
 |
 |
| Module-wise count rates for Quadrant D Data is divided into 100 sec bins |
 |
 |
| Parameter | Plot |
|---|---|
| CZT HV Monitor | 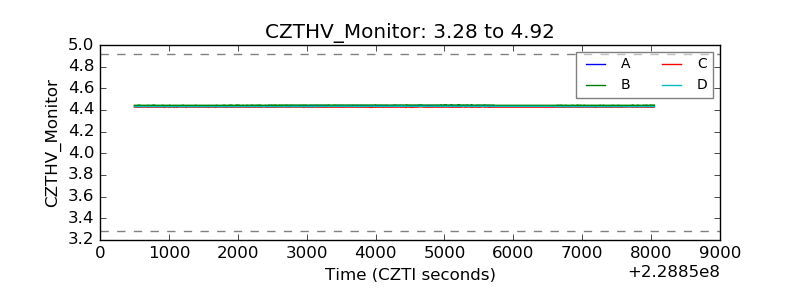 |
| D_VDD | 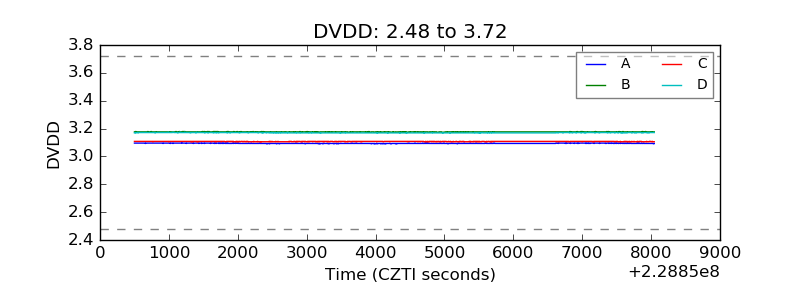 |
| Temperature 1 | 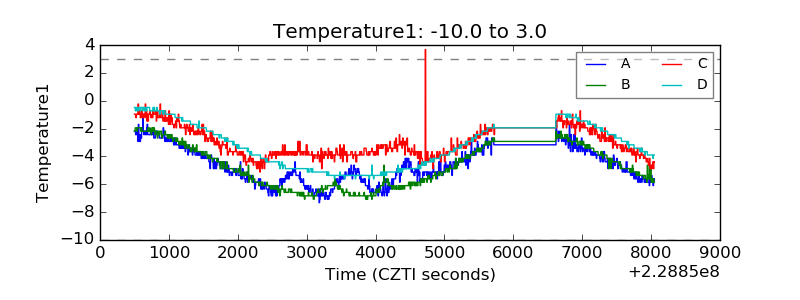 |
| Veto HV Monitor | 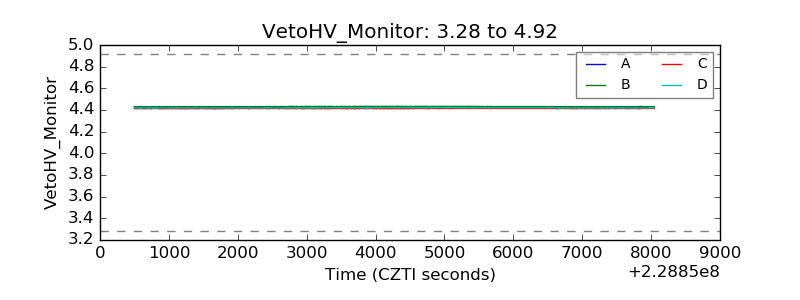 |
| Veto LLD | 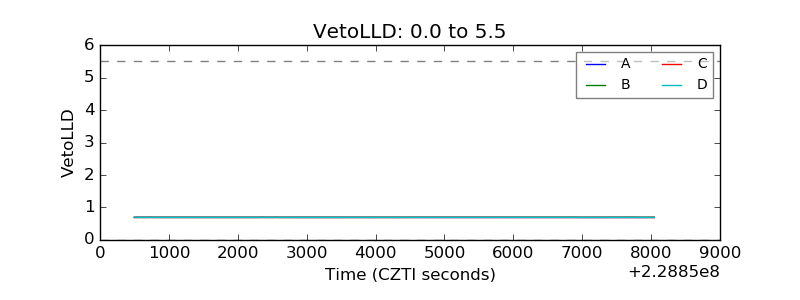 |
| Alpha Counter | 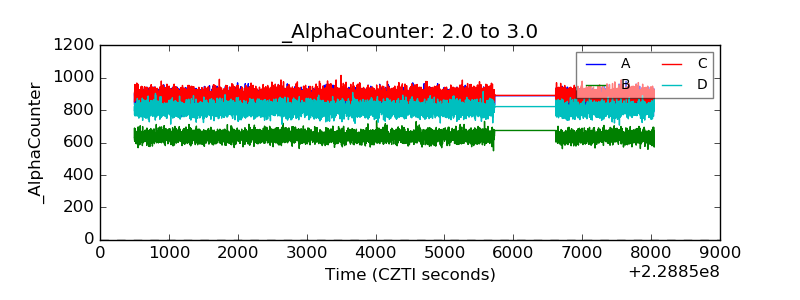 |
| _CPM_Rate | 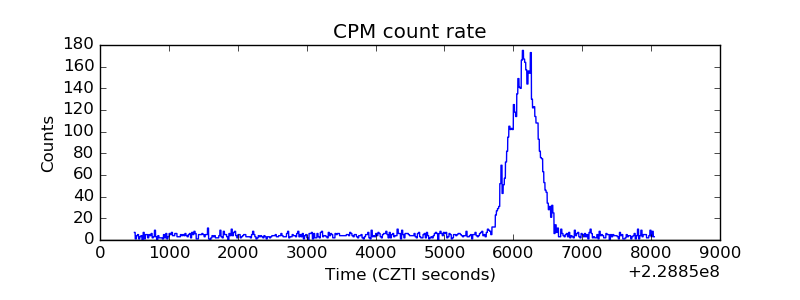 |
| CZT Counter | 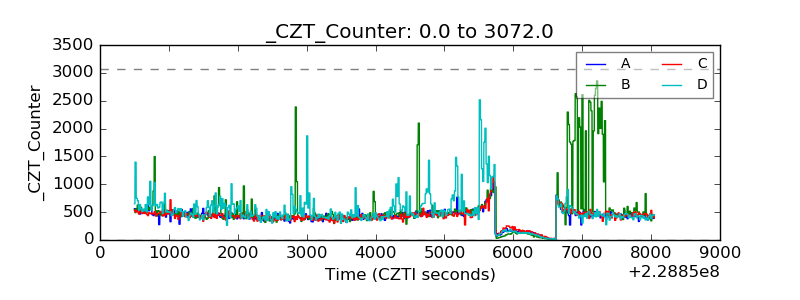 |
| +2.5 Volts monitor | 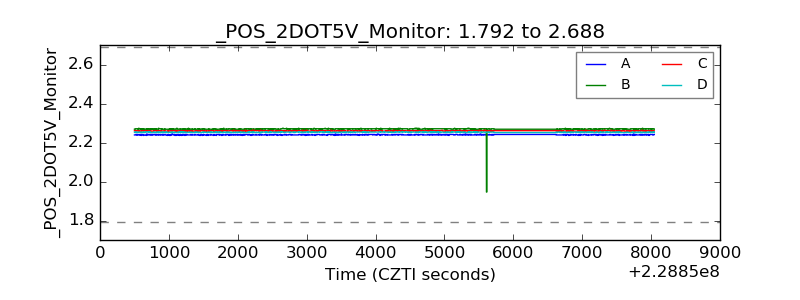 |
| +5 Volts monitor | 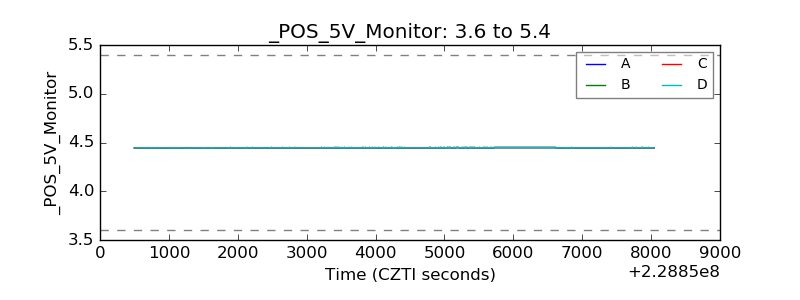 |
| _ROLL_ROT | 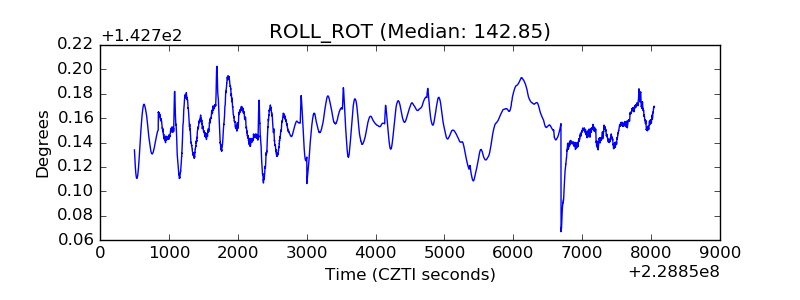 |
| _Roll_DEC | 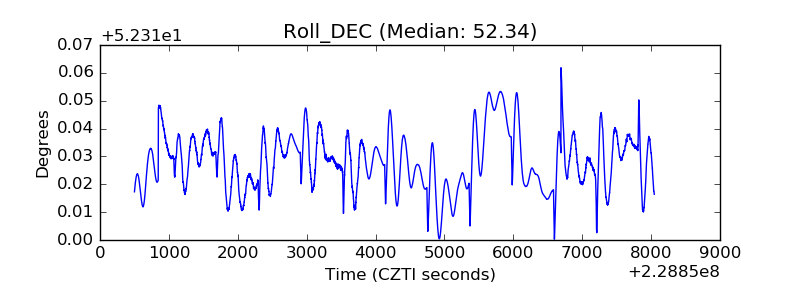 |
| _Roll_RA | 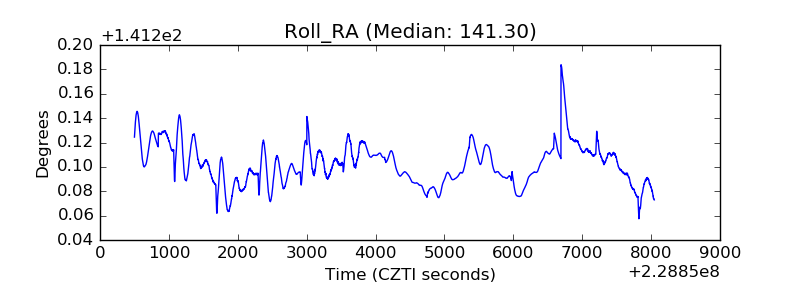 |
| Veto Counter | 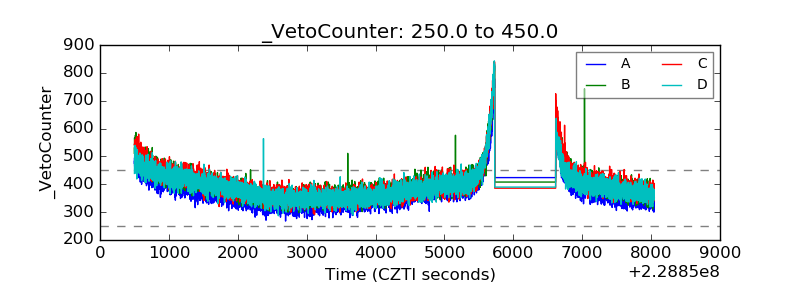 |