| Param | Original file | Final file |
|---|---|---|
| Filename | modeM0/AS1A03_036T01_9000001128_08181cztM0_level2.evt | modeM0/AS1A03_036T01_9000001128_08181cztM0_level2_quad_clean.evt |
| Size (bytes) | 480,366,720 | 98,352,000 |
| Size | 458.1 MB | 93.8 MB |
| Events in quadrant A | 3,197,123 | 637,826 |
| Events in quadrant B | 4,125,674 | 600,698 |
| Events in quadrant C | 3,162,279 | 632,216 |
| Events in quadrant D | 3,577,327 | 610,330 |
| Mode M9 | |||
|---|---|---|---|
| Quadrant | BADHDUFLAG | Total packets | Discarded packets |
| A | 0 | 5 | 0 |
| B | 0 | 5 | 0 |
| C | 0 | 5 | 0 |
| D | 0 | 5 | 0 |
| Mode SS | |||
|---|---|---|---|
| Quadrant | BADHDUFLAG | Total packets | Discarded packets |
| A | 0 | 146 | 0 |
| B | 0 | 146 | 0 |
| C | 0 | 146 | 0 |
| D | 0 | 146 | 0 |
| Mode M0 | |||
|---|---|---|---|
| Quadrant | BADHDUFLAG | Total packets | Discarded packets |
| A | 0 | 14625 | 4 |
| B | 0 | 17246 | 3 |
| C | 0 | 14569 | 3 |
| D | 0 | 15831 | 3 |
| Quadrant | Total seconds | Saturated seconds | Saturation percentage |
|---|---|---|---|
| A | 7136 | 23 | 0.322309% |
| B | 7136 | 444 | 6.221973% |
| C | 7136 | 9 | 0.126121% |
| D | 7137 | 47 | 0.658540% |
Noise dominated data is calculated using 1-second bins in cleaned event files. If a bin has >2000 counts, and if more than 50% of those come from <1% of pixels, then it is considered to be noise-dominated and hence unusable.
| Quadrant | # 1 sec bins | Bins with >0 counts | Bins with >2000 counts | High rate bins dominated by noise | Noise dominated (total time) | Noise dominated (detector-on time) | Marked lightcurve |
|---|---|---|---|---|---|---|---|
| A | 7691 | 7138 | 0 | 0 | 0.00% | 0.00% | 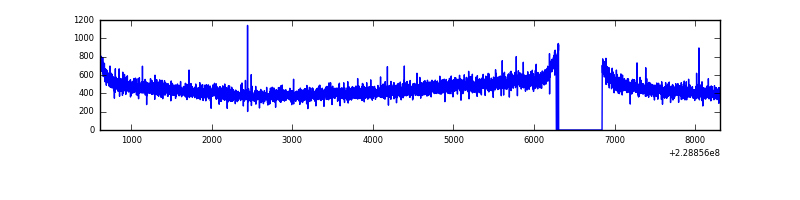 |
| B | 7691 | 7138 | 317 | 317 | 4.12% | 4.44% | 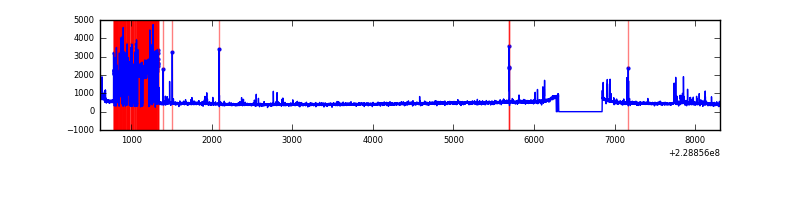 |
| C | 7691 | 7138 | 0 | 0 | 0.00% | 0.00% | 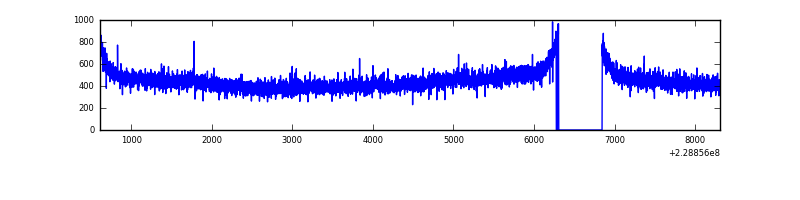 |
| D | 7692 | 7139 | 35 | 35 | 0.46% | 0.49% | 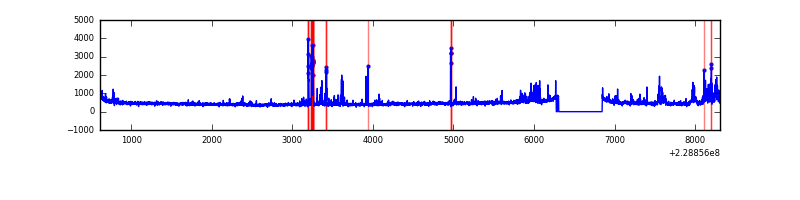 |
Top three noisy pixels from each quadrant. If the there are fewer than three noisy pixels in the level2.evt file, extra rows are filled as -1
| Pixel properties | Quadrant properties | ||||||
|---|---|---|---|---|---|---|---|
| Quadrant | DetID | PixID | Counts | Sigma | Mean | Median | Sigma |
| A | 8 | 15 | 24763 | 142.67 | 823 | 802 | 168.0 |
| A | 0 | 226 | 7808 | 41.71 | 823 | 802 | 168.0 |
| A | 12 | 194 | 7440 | 39.52 | 823 | 802 | 168.0 |
| B | 0 | 213 | 923677 | 6121.29 | 789 | 770 | 150.8 |
| B | 10 | 16 | 45574 | 297.17 | 789 | 770 | 150.8 |
| B | 4 | 81 | 32117 | 207.91 | 789 | 770 | 150.8 |
| C | 1 | 3 | 6304 | 29.43 | 809 | 811 | 186.7 |
| C | 13 | 61 | 6152 | 28.61 | 809 | 811 | 186.7 |
| C | 7 | 159 | 2368 | 8.34 | 809 | 811 | 186.7 |
| D | 1 | 52 | 190141 | 961.2 | 806 | 783 | 197.0 |
| D | 2 | 14 | 134284 | 677.67 | 806 | 783 | 197.0 |
| D | 12 | 227 | 113577 | 572.55 | 806 | 783 | 197.0 |
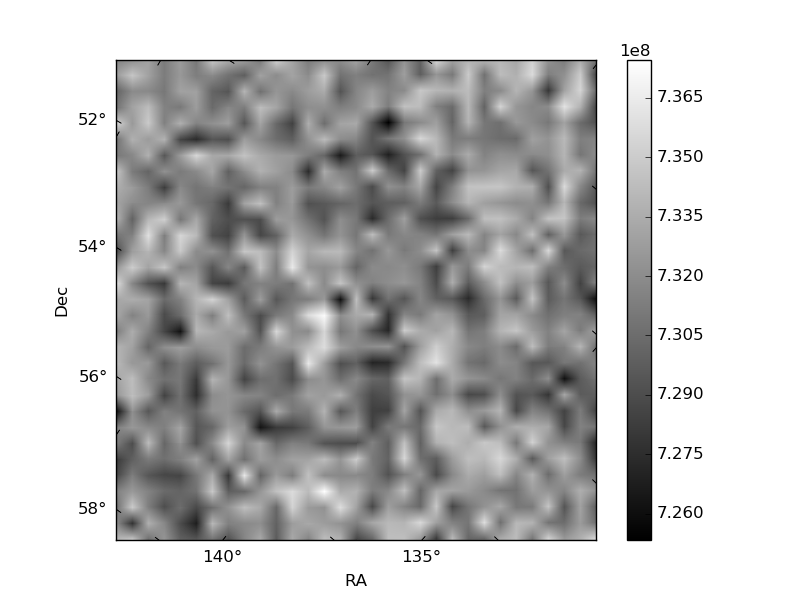
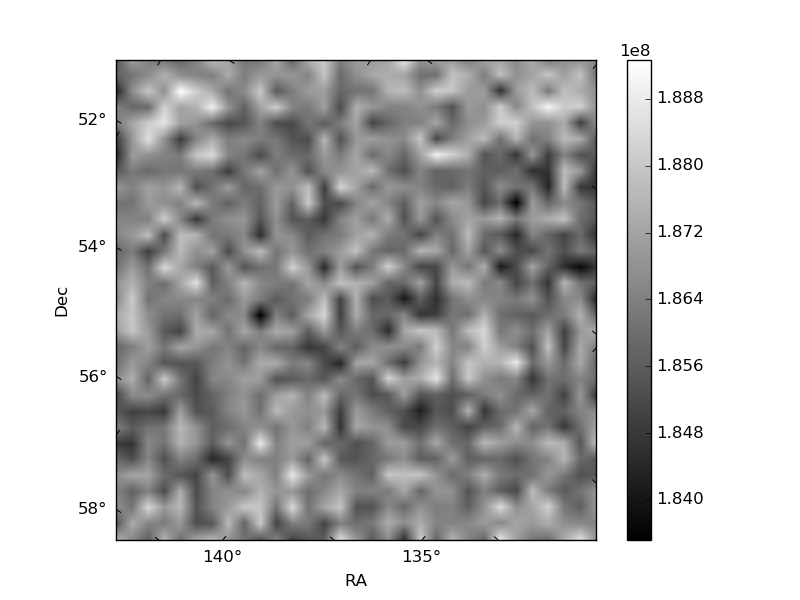
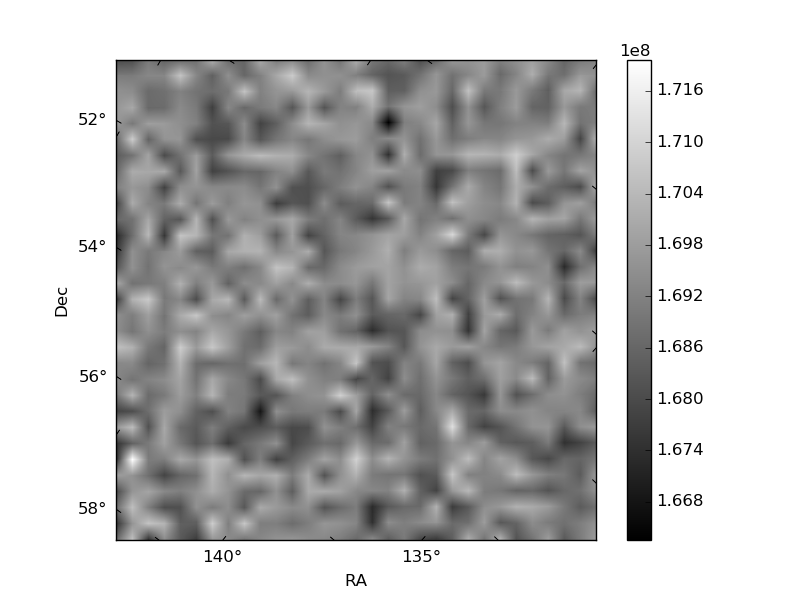
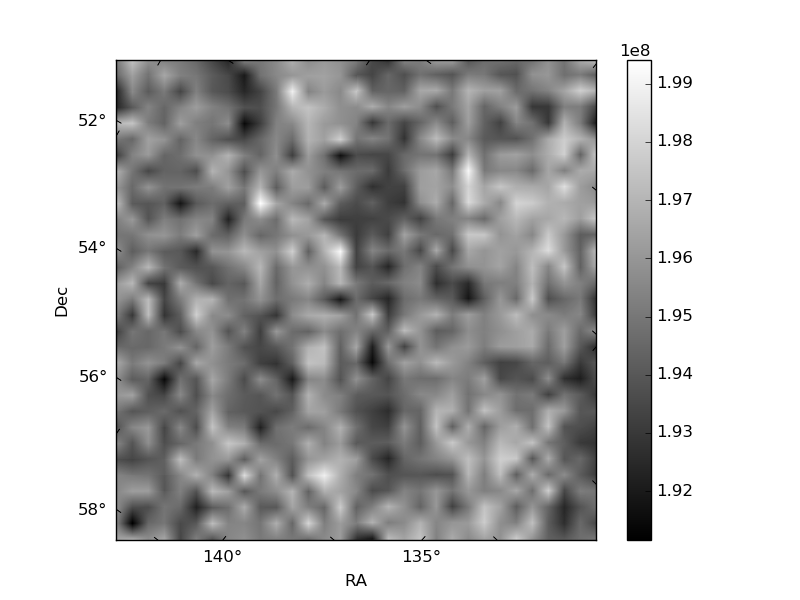
Histogram calculated using DETX and DETY for each event in the final _common_clean file
| Quadrant A | 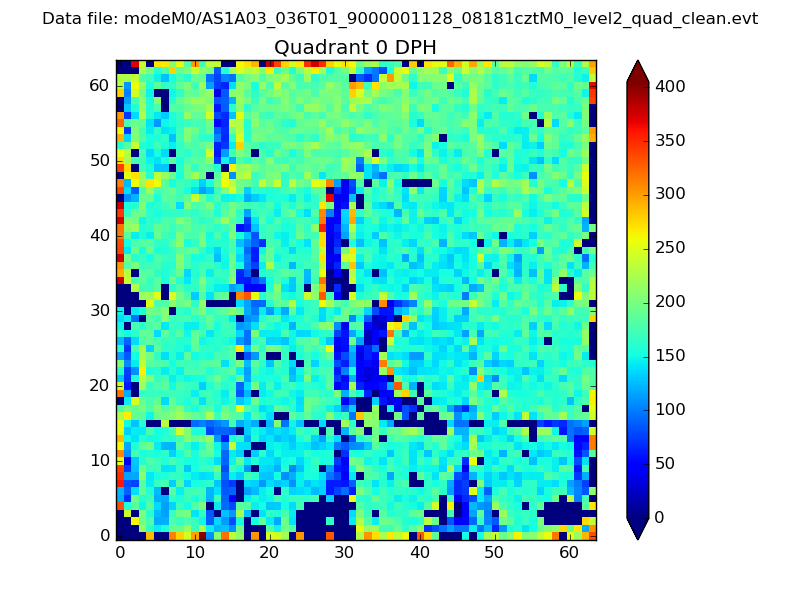 |
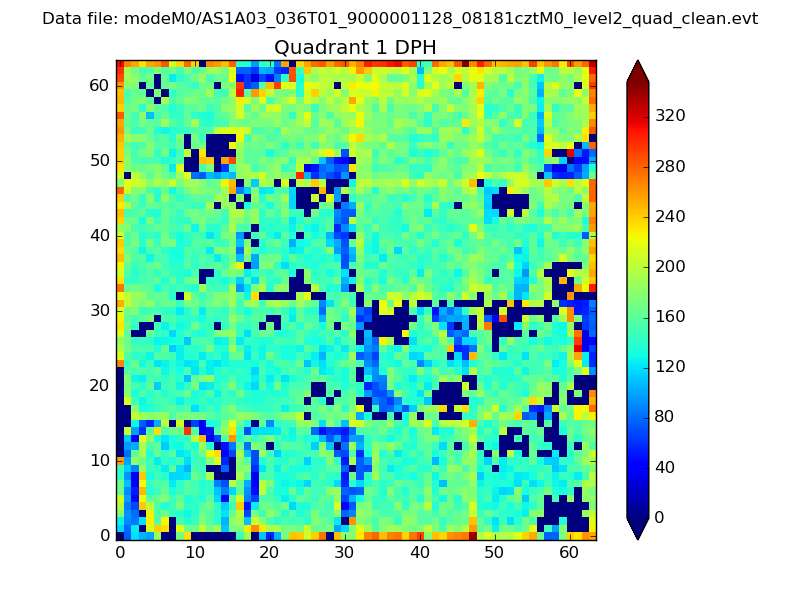 |
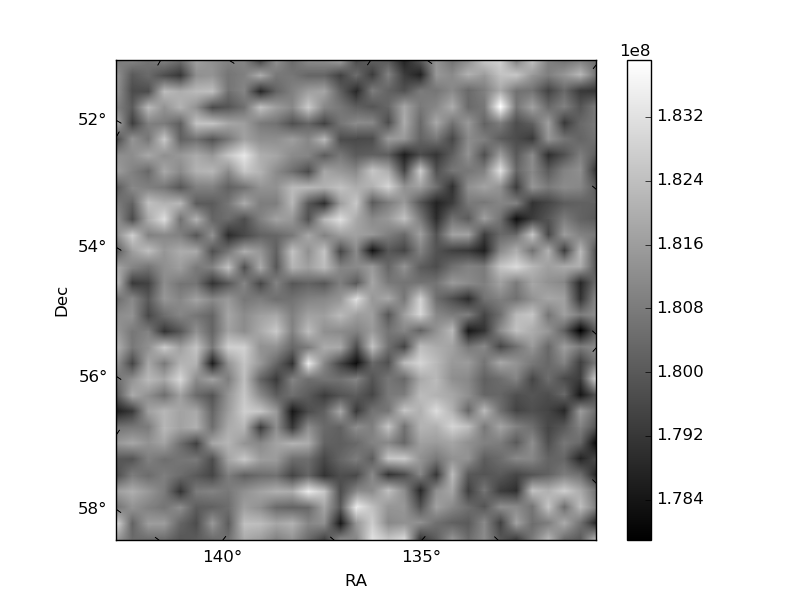
Quadrant B |
|---|---|---|---|
| Quadrant D | 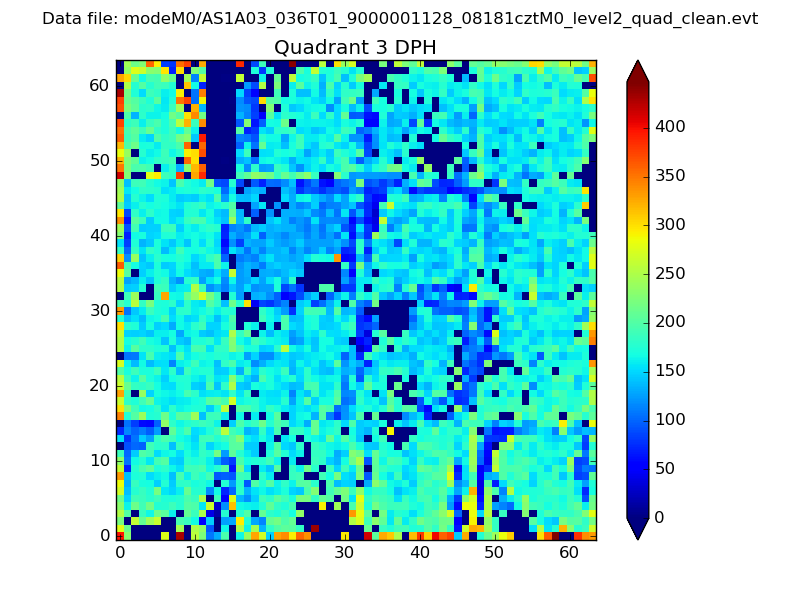 |
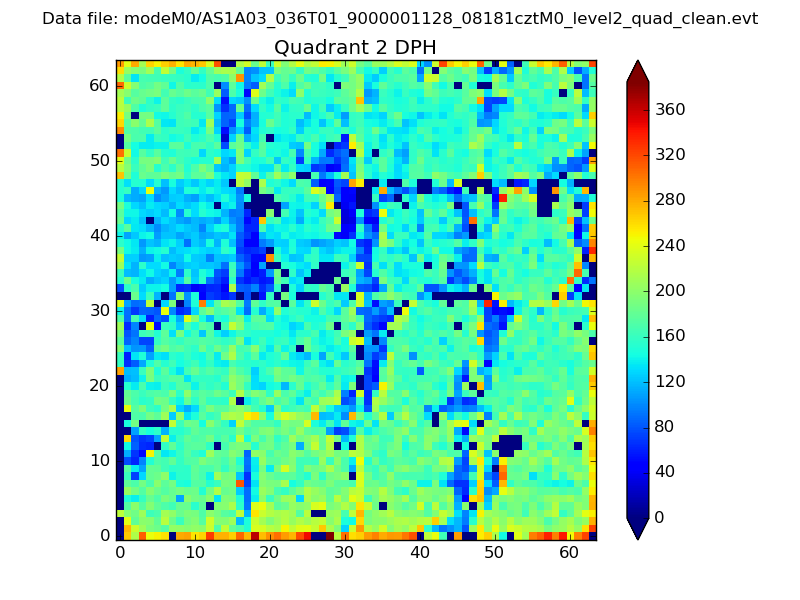 |
Quadrant C |
| Plot type | Count rate plots | Images |
|---|---|---|
| Comparison with Poisson distribution Blue bars denote a histogram of data divided into 1 sec bins. Red curve is a Poisson curve with rate = median count rate of data. |
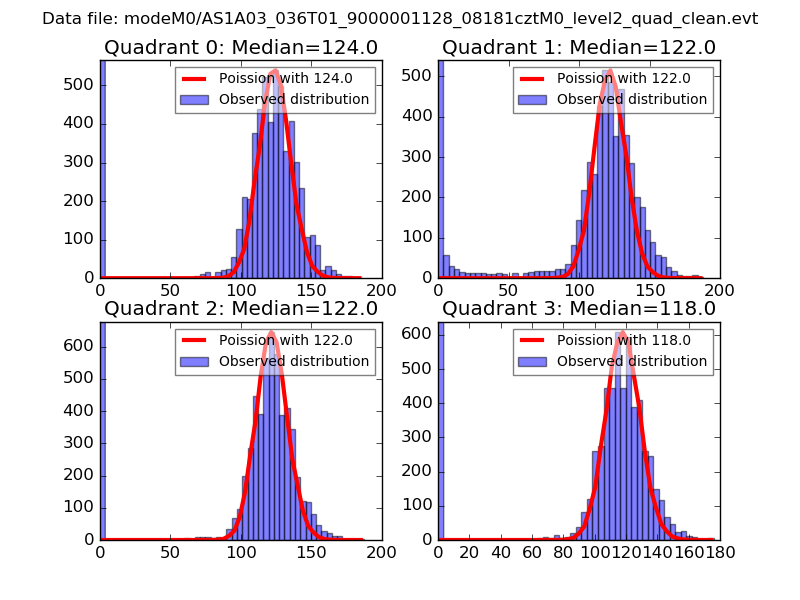 |
 |
| Quadrant-wise count rates Data is divided into 100 sec bins |
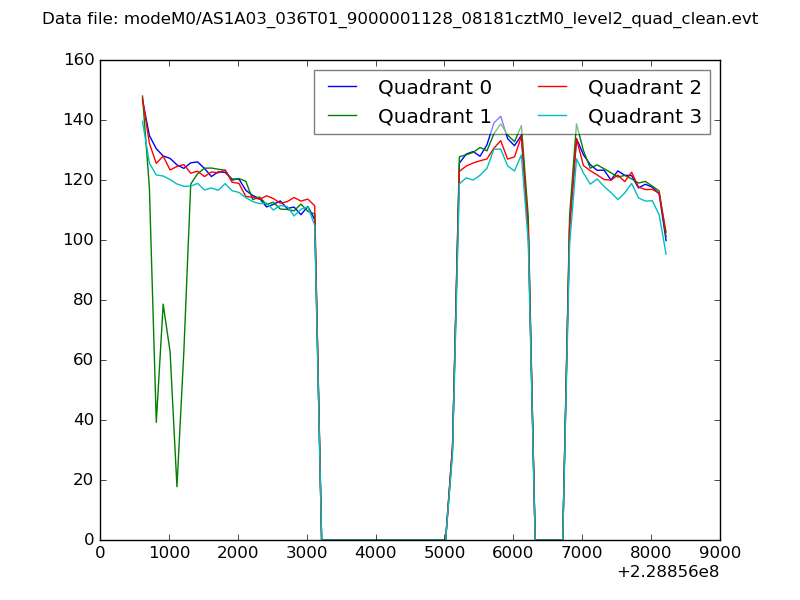 |
|
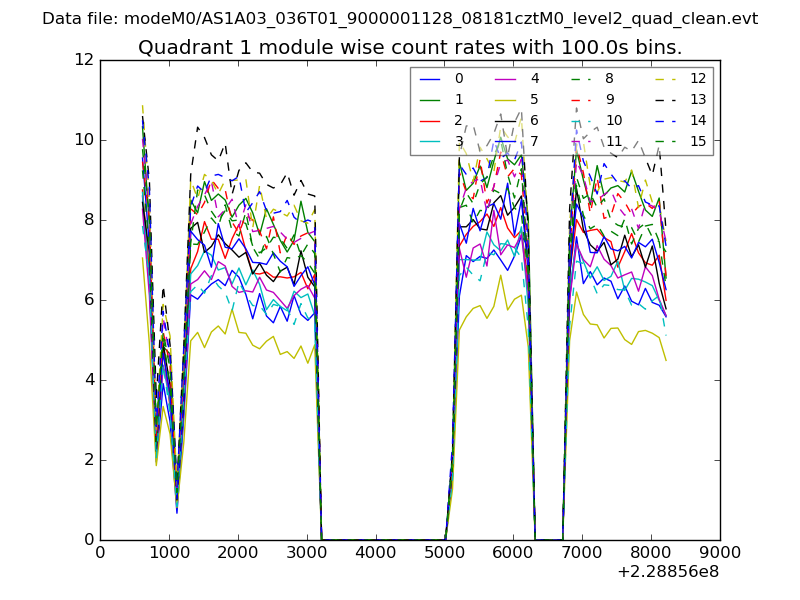
| Module-wise count rates for Quadrant A Data is divided into 100 sec bins |
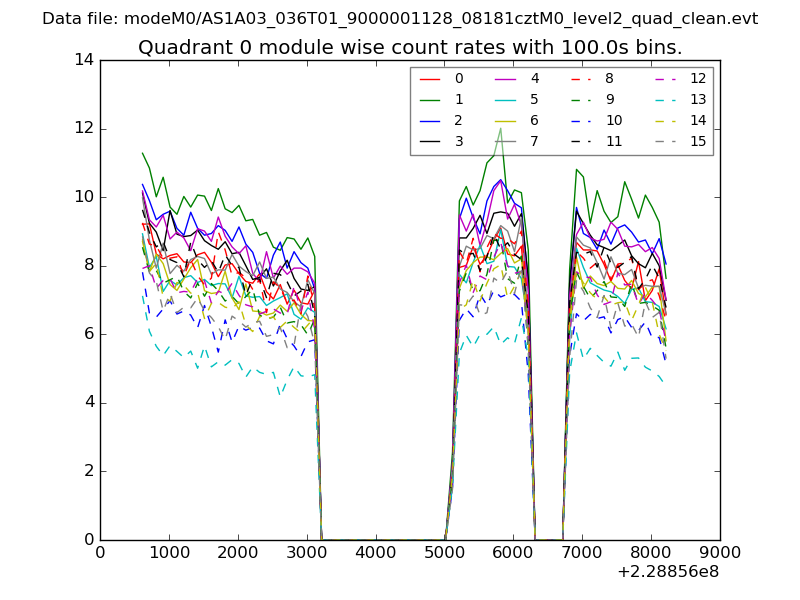 |
 |
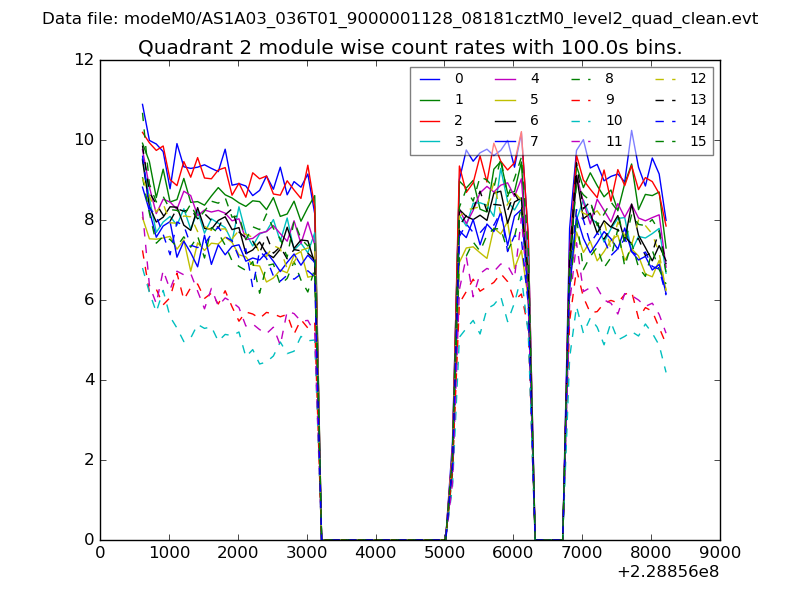
| Module-wise count rates for Quadrant B Data is divided into 100 sec bins |
 |
 |
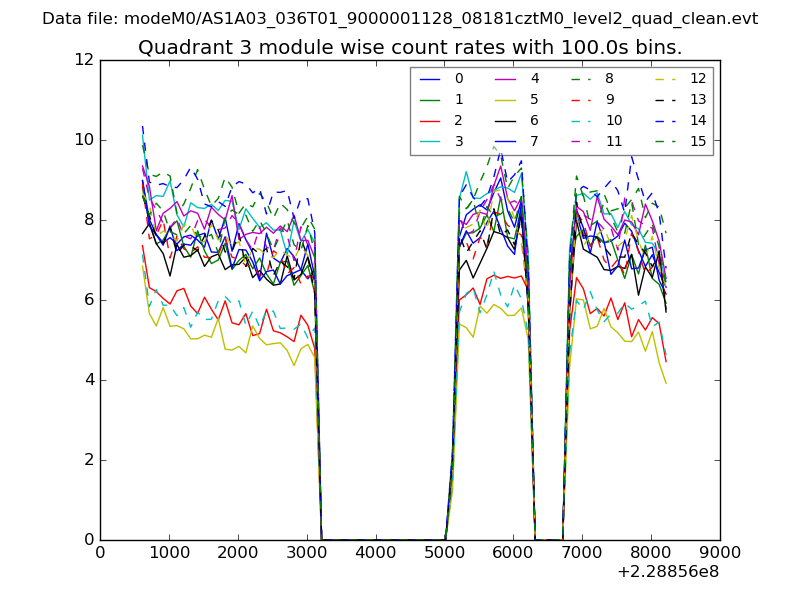
| Module-wise count rates for Quadrant C Data is divided into 100 sec bins |
 |
 |
| Module-wise count rates for Quadrant D Data is divided into 100 sec bins |
 |
 |
| Parameter | Plot |
|---|---|
| CZT HV Monitor | 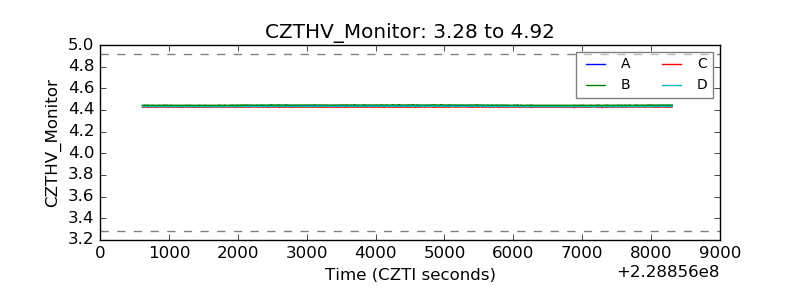 |
| D_VDD | 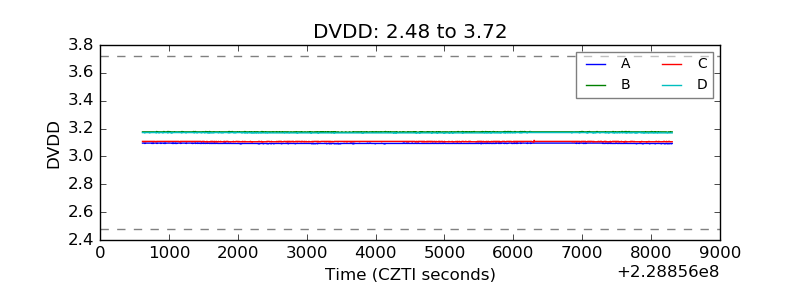 |
| Temperature 1 | 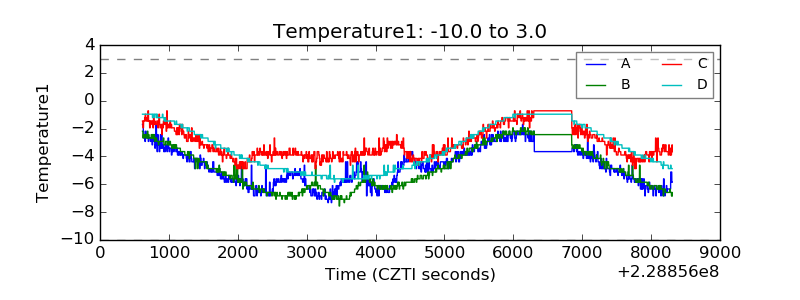 |
| Veto HV Monitor | 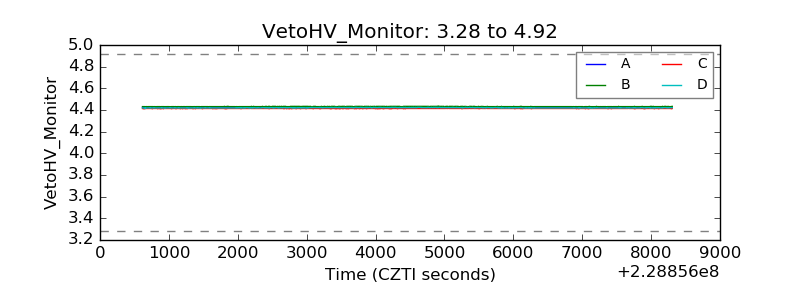 |
| Veto LLD | 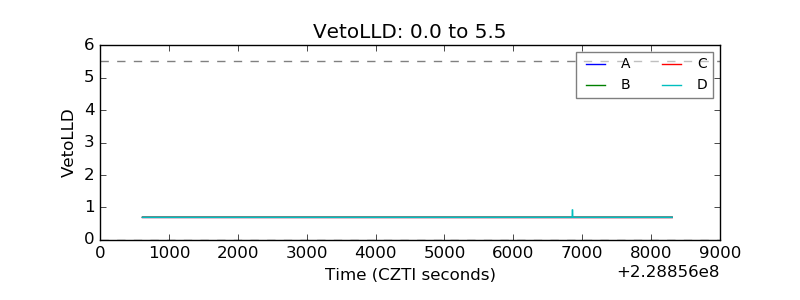 |
| Alpha Counter |  |
| _CPM_Rate | 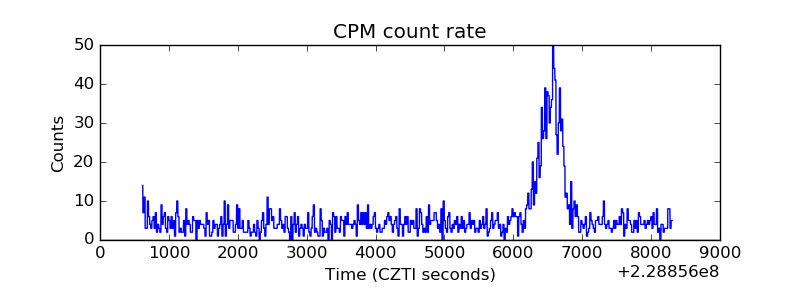 |
| CZT Counter | 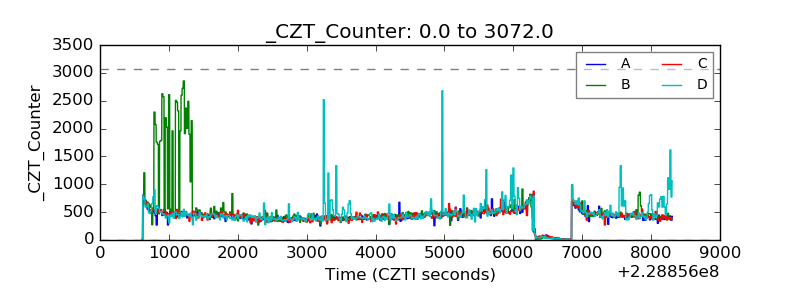 |
| +2.5 Volts monitor |  |
| +5 Volts monitor |  |
| _ROLL_ROT | 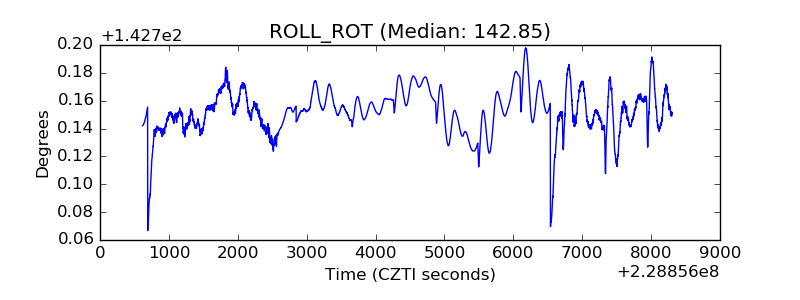 |
| _Roll_DEC | 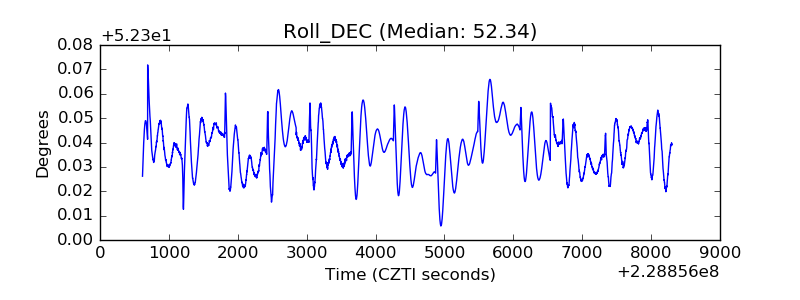 |
| _Roll_RA | 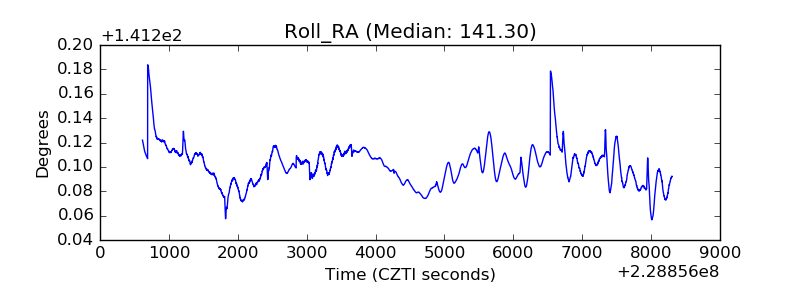 |
| Veto Counter | 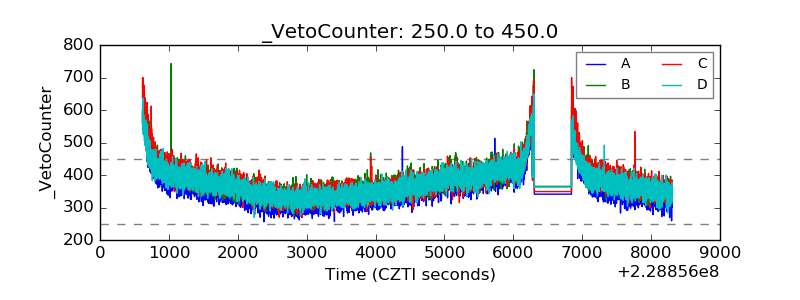 |