| Param | Original file | Final file |
|---|---|---|
| Filename | modeM0/AS1A03_036T01_9000001128_08186cztM0_level2.evt | modeM0/AS1A03_036T01_9000001128_08186cztM0_level2_quad_clean.evt |
| Size (bytes) | 1,113,433,920 | 195,537,600 |
| Size | 1.0 GB | 186.5 MB |
| Events in quadrant A | 7,215,299 | 1,224,731 |
| Events in quadrant B | 7,678,681 | 1,240,405 |
| Events in quadrant C | 7,009,273 | 1,220,383 |
| Events in quadrant D | 10,729,768 | 1,127,692 |
| Mode M9 | |||
|---|---|---|---|
| Quadrant | BADHDUFLAG | Total packets | Discarded packets |
| A | 0 | 14 | 0 |
| B | 0 | 14 | 0 |
| C | 0 | 14 | 0 |
| D | 0 | 14 | 0 |
| Mode SS | |||
|---|---|---|---|
| Quadrant | BADHDUFLAG | Total packets | Discarded packets |
| A | 0 | 328 | 0 |
| B | 0 | 328 | 0 |
| C | 0 | 328 | 0 |
| D | 0 | 328 | 0 |
| Mode M0 | |||
|---|---|---|---|
| Quadrant | BADHDUFLAG | Total packets | Discarded packets |
| A | 0 | 32661 | 5 |
| B | 0 | 33756 | 4 |
| C | 0 | 32586 | 4 |
| D | 0 | 43293 | 4 |
| Quadrant | Total seconds | Saturated seconds | Saturation percentage |
|---|---|---|---|
| A | 16069 | 101 | 0.628539% |
| B | 16069 | 180 | 1.120169% |
| C | 16069 | 72 | 0.448068% |
| D | 16069 | 912 | 5.675524% |
Noise dominated data is calculated using 1-second bins in cleaned event files. If a bin has >2000 counts, and if more than 50% of those come from <1% of pixels, then it is considered to be noise-dominated and hence unusable.
| Quadrant | # 1 sec bins | Bins with >0 counts | Bins with >2000 counts | High rate bins dominated by noise | Noise dominated (total time) | Noise dominated (detector-on time) | Marked lightcurve |
|---|---|---|---|---|---|---|---|
| A | 17494 | 16073 | 0 | 0 | 0.00% | 0.00% |  |
| B | 17494 | 16072 | 37 | 37 | 0.21% | 0.23% | 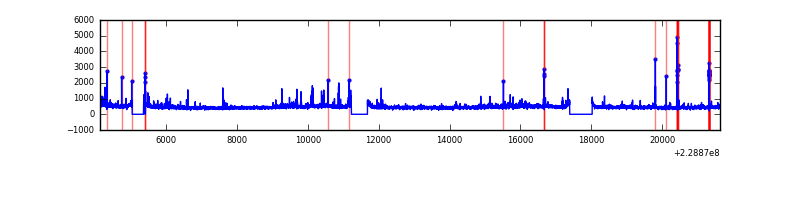 |
| C | 17494 | 16073 | 0 | 0 | 0.00% | 0.00% | 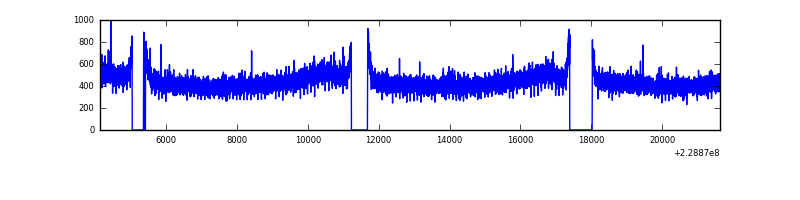 |
| D | 17494 | 16072 | 641 | 641 | 3.66% | 3.99% | 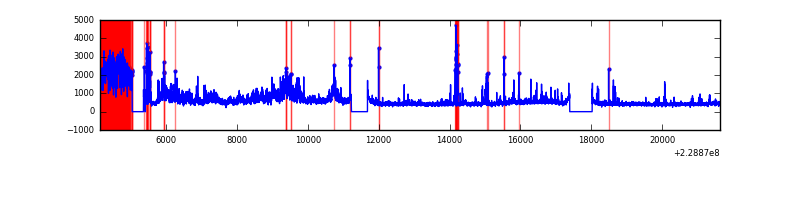 |
Top three noisy pixels from each quadrant. If the there are fewer than three noisy pixels in the level2.evt file, extra rows are filled as -1
| Pixel properties | Quadrant properties | ||||||
|---|---|---|---|---|---|---|---|
| Quadrant | DetID | PixID | Counts | Sigma | Mean | Median | Sigma |
| A | 8 | 15 | 106532 | 279.11 | 1843 | 1801 | 375.2 |
| A | 0 | 226 | 17606 | 42.12 | 1843 | 1801 | 375.2 |
| A | 12 | 194 | 16489 | 39.14 | 1843 | 1801 | 375.2 |
| B | 0 | 214 | 192060 | 539.99 | 1849 | 1801 | 352.3 |
| B | 0 | 213 | 106748 | 297.86 | 1849 | 1801 | 352.3 |
| B | 4 | 173 | 63262 | 174.44 | 1849 | 1801 | 352.3 |
| C | 13 | 61 | 13899 | 29.19 | 1797 | 1801 | 414.4 |
| C | 3 | 202 | 4479 | 6.46 | 1797 | 1801 | 414.4 |
| C | 7 | 159 | 4265 | 5.95 | 1797 | 1801 | 414.4 |
| D | 6 | 6 | 1718170 | 4023.1 | 1757 | 1702 | 426.7 |
| D | 13 | 122 | 1388047 | 3249.35 | 1757 | 1702 | 426.7 |
| D | 13 | 105 | 340120 | 793.19 | 1757 | 1702 | 426.7 |
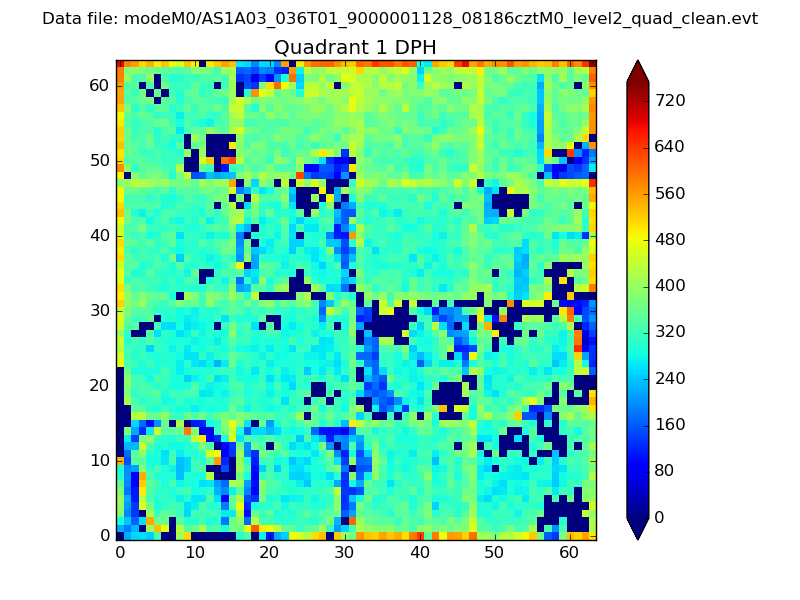
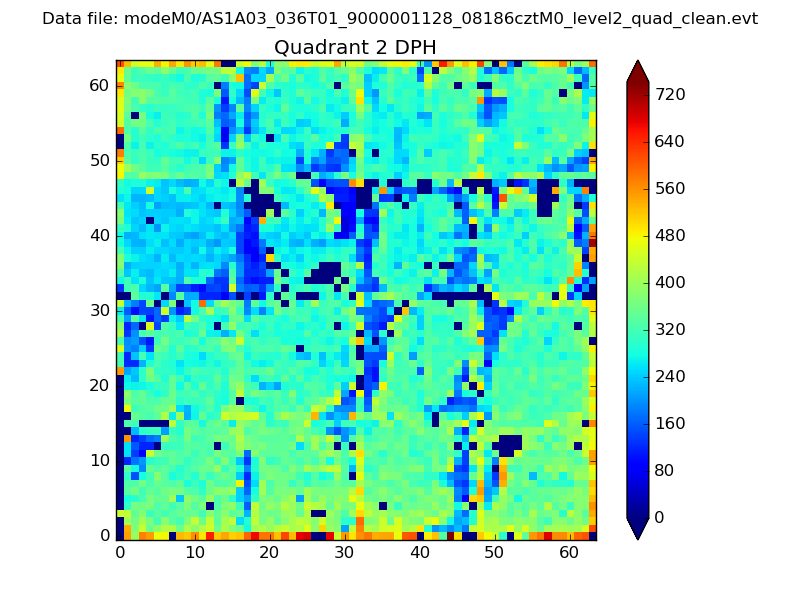
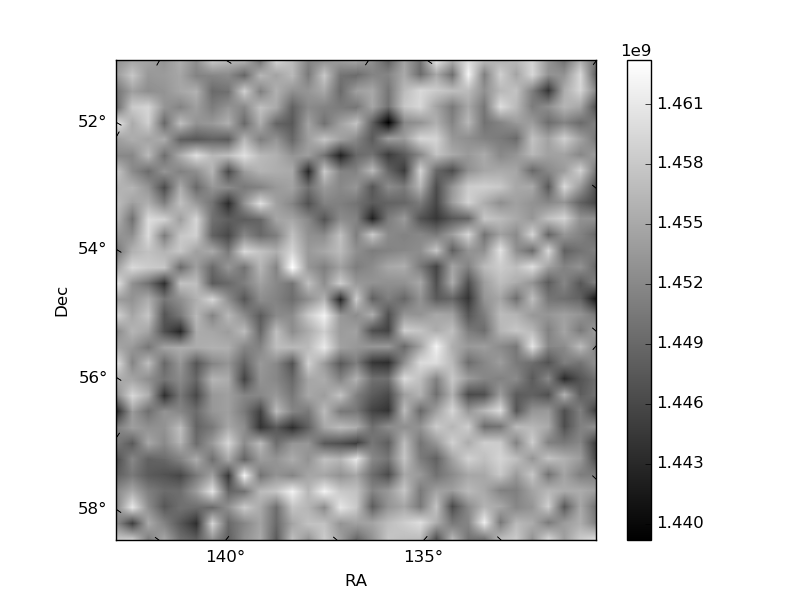
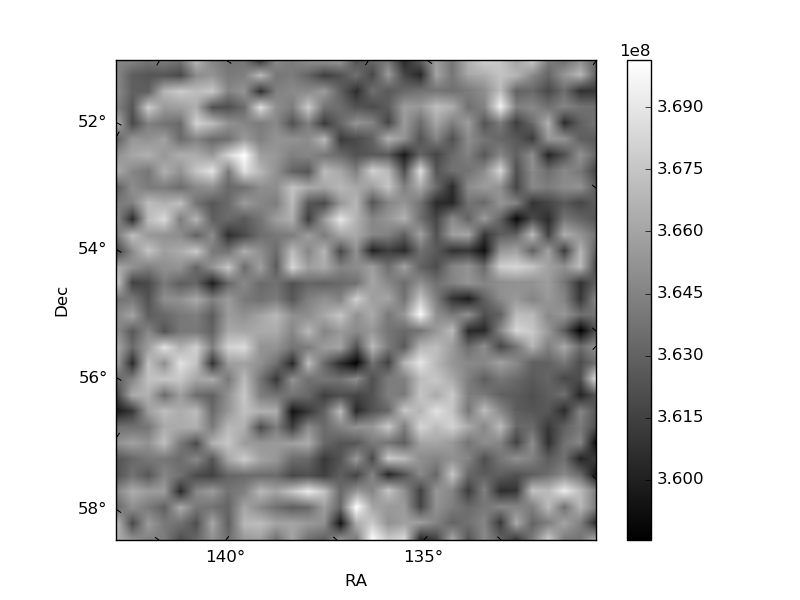
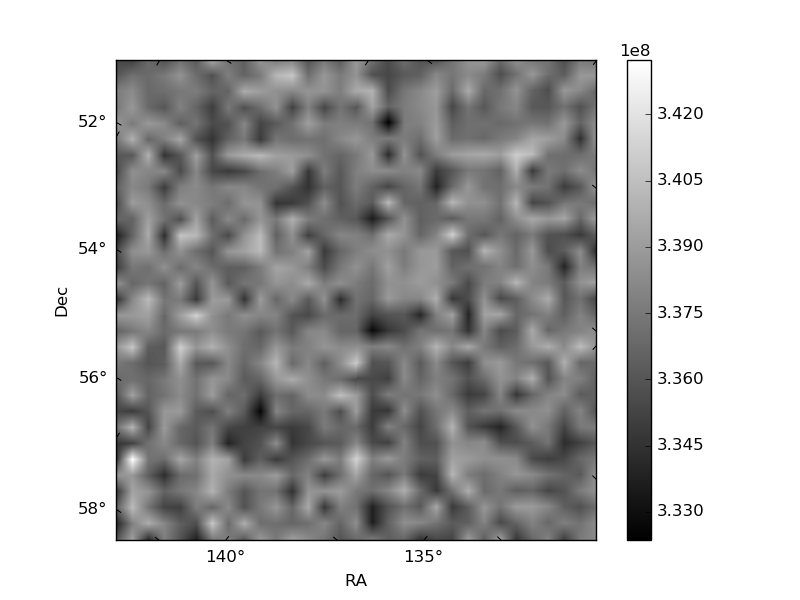
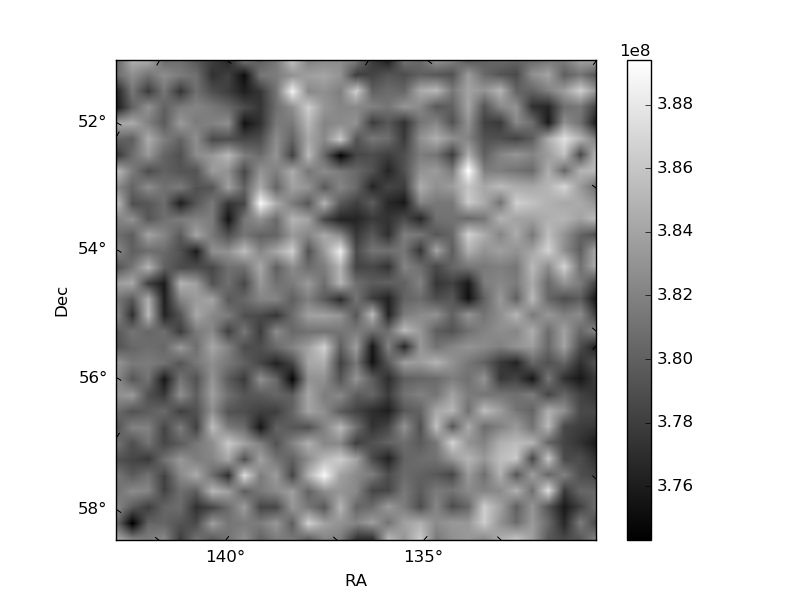
Histogram calculated using DETX and DETY for each event in the final _common_clean file
| Quadrant A | 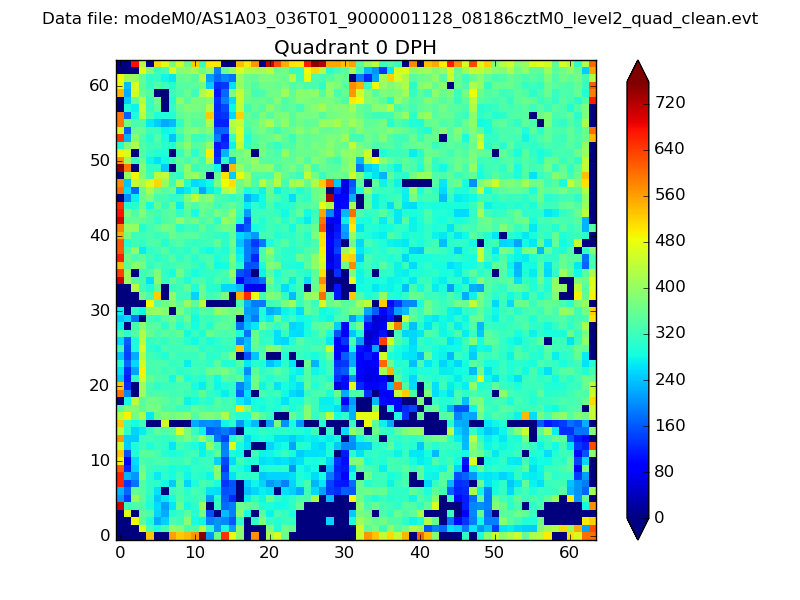 |
 |
Quadrant B |
|---|---|---|---|
| Quadrant D | 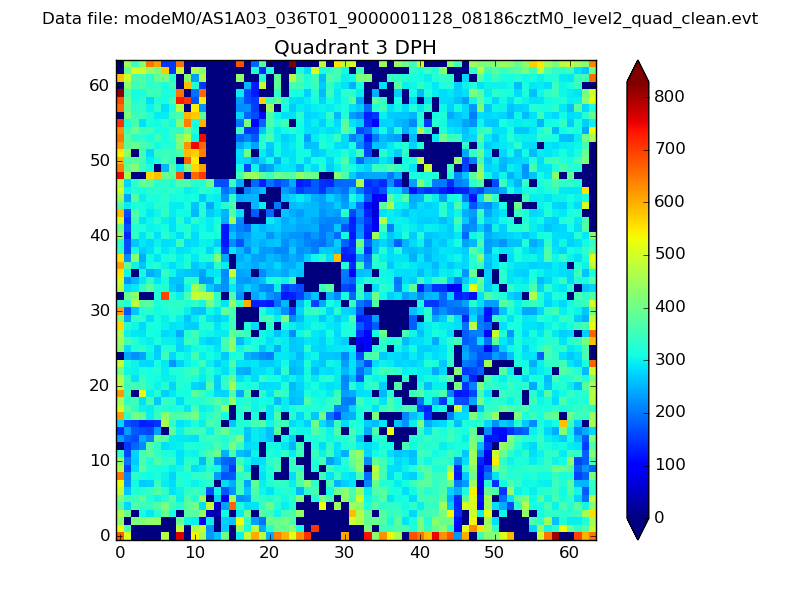 |
 |
Quadrant C |
| Plot type | Count rate plots | Images |
|---|---|---|
| Comparison with Poisson distribution Blue bars denote a histogram of data divided into 1 sec bins. Red curve is a Poisson curve with rate = median count rate of data. |
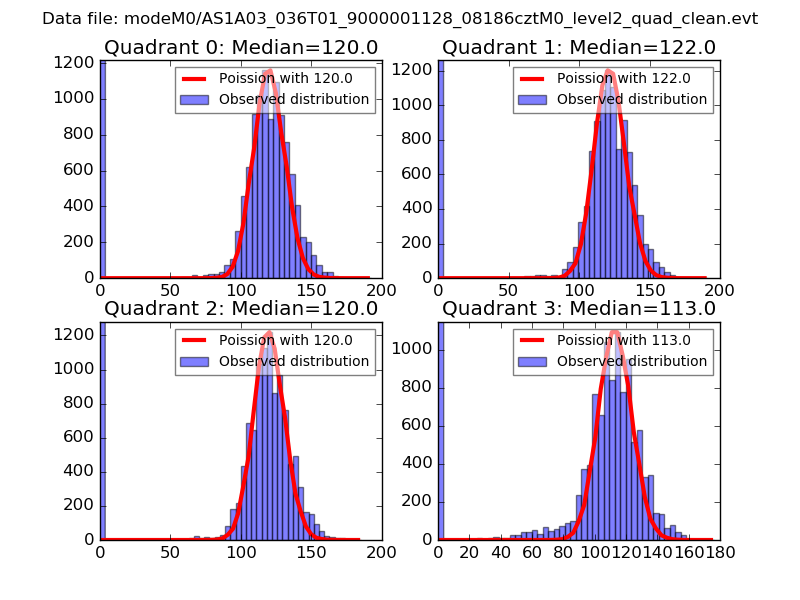 |
 |
| Quadrant-wise count rates Data is divided into 100 sec bins |
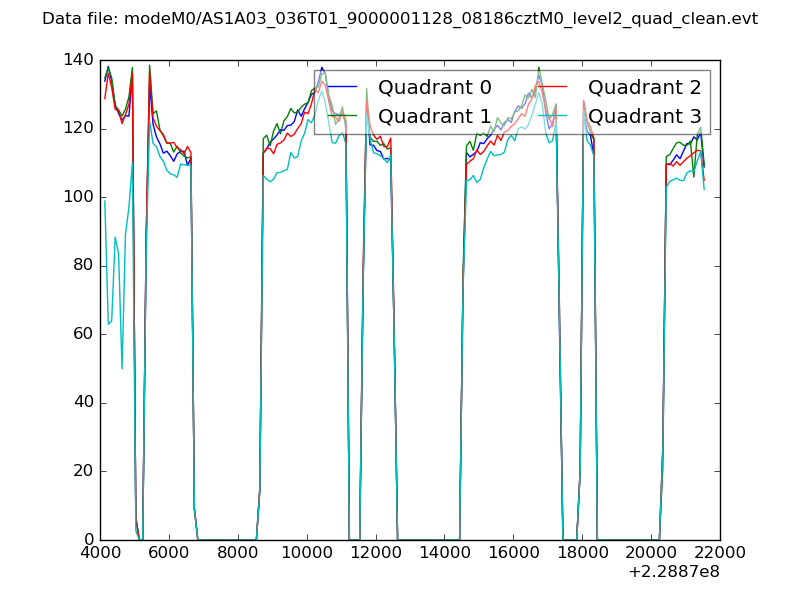 |
|
| Module-wise count rates for Quadrant A Data is divided into 100 sec bins |
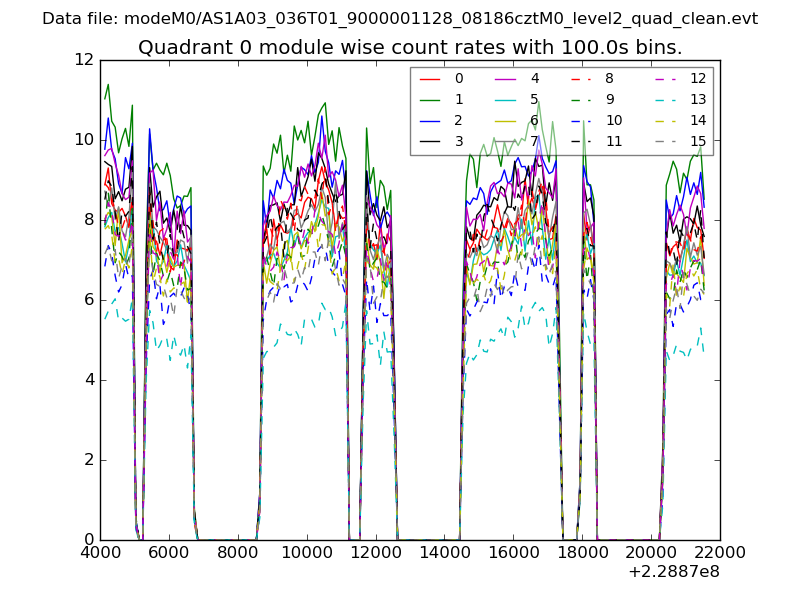 |
 |
| Module-wise count rates for Quadrant B Data is divided into 100 sec bins |
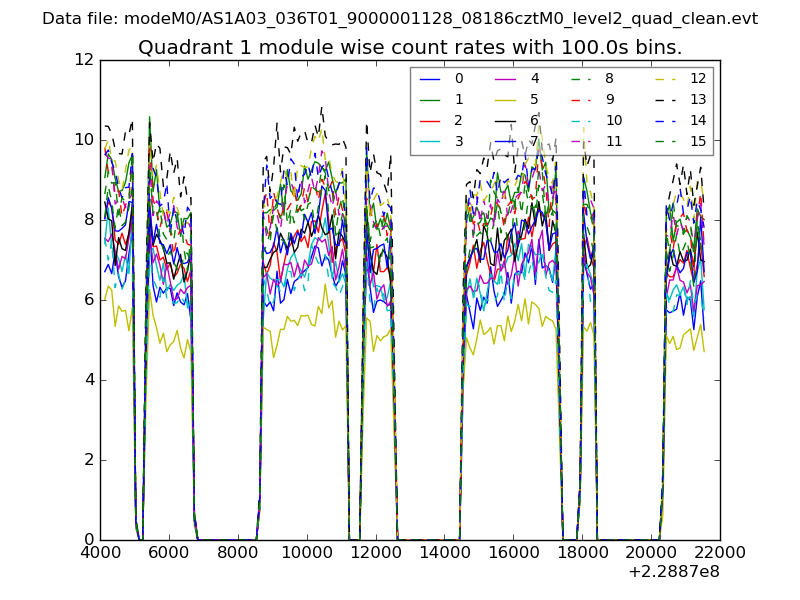 |
 |
| Module-wise count rates for Quadrant C Data is divided into 100 sec bins |
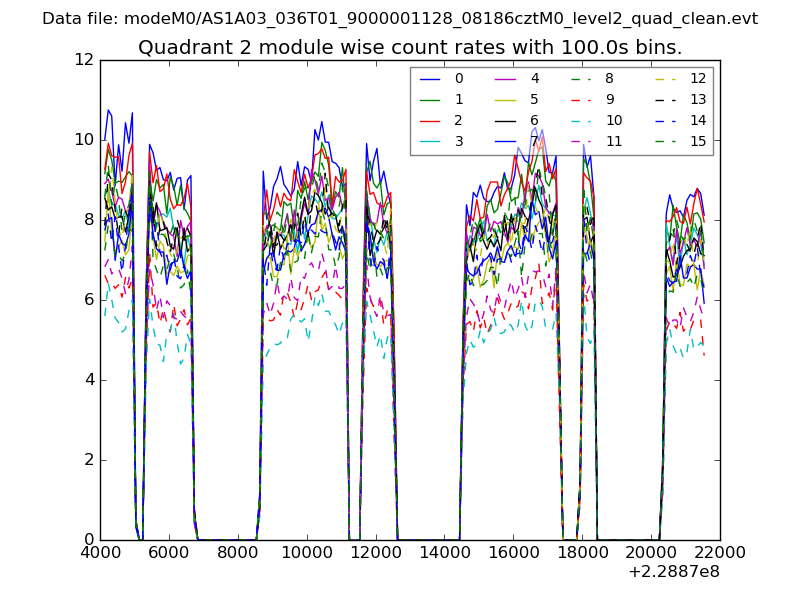 |
 |
| Module-wise count rates for Quadrant D Data is divided into 100 sec bins |
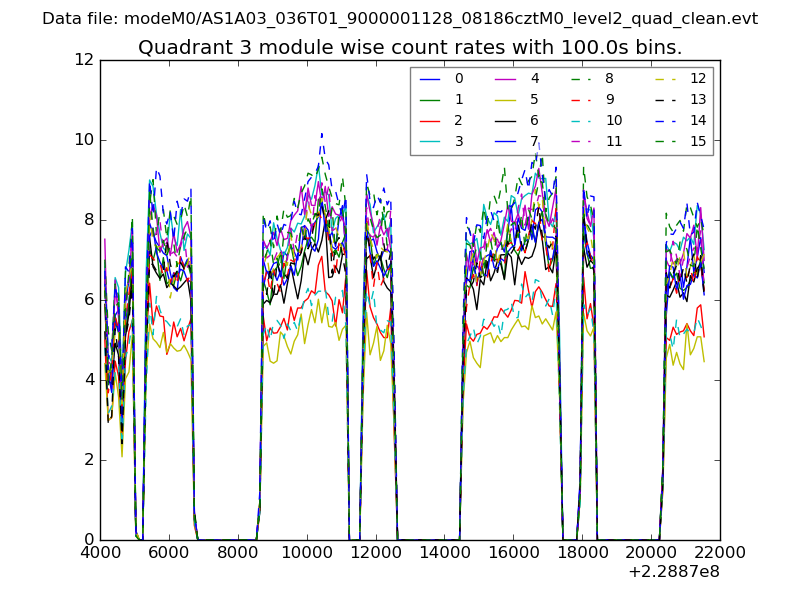 |
 |
| Parameter | Plot |
|---|---|
| CZT HV Monitor | 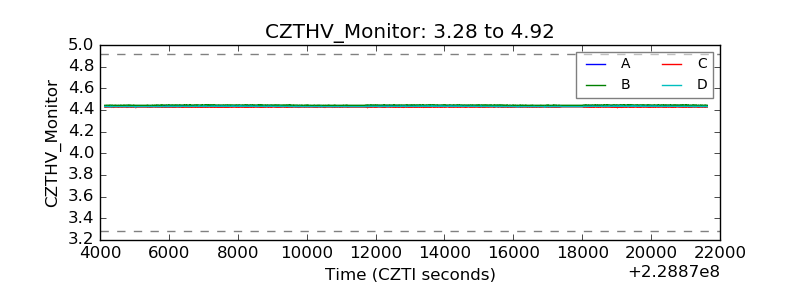 |
| D_VDD | 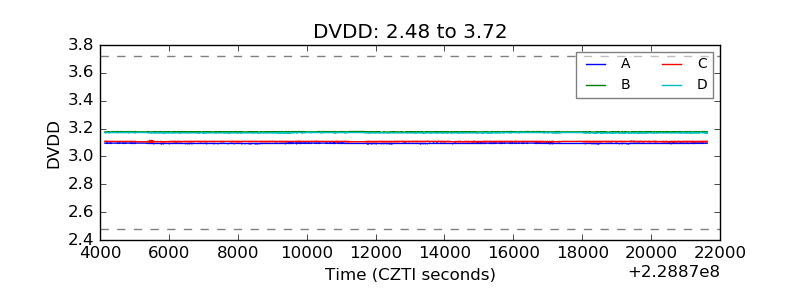 |
| Temperature 1 | 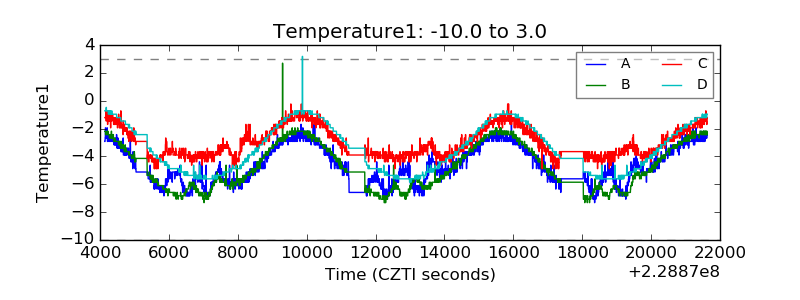 |
| Veto HV Monitor | 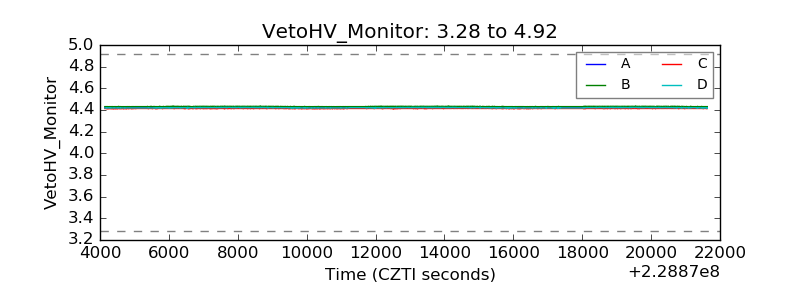 |
| Veto LLD |  |
| Alpha Counter | 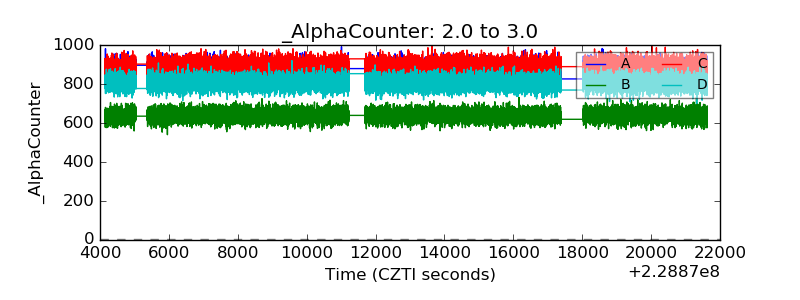 |
| _CPM_Rate | 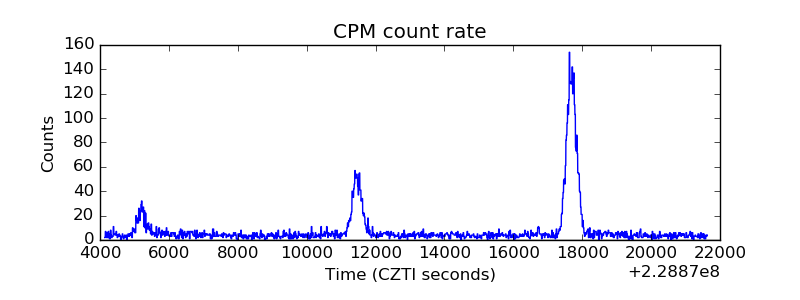 |
| CZT Counter | 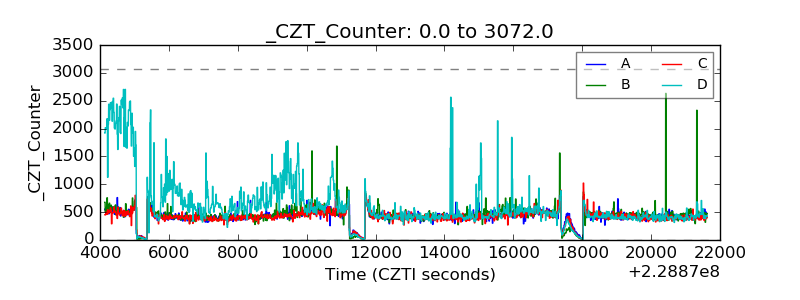 |
| +2.5 Volts monitor |  |
| +5 Volts monitor |  |
| _ROLL_ROT | 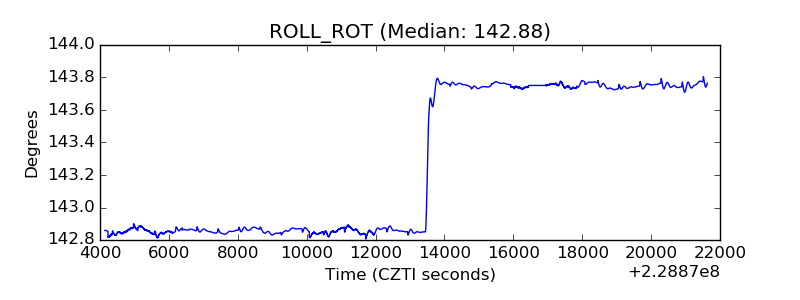 |
| _Roll_DEC | 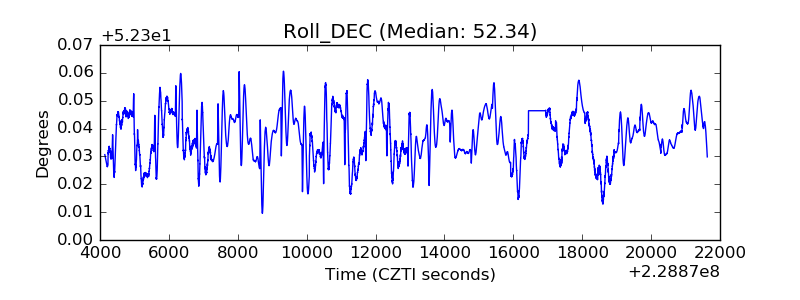 |
| _Roll_RA | 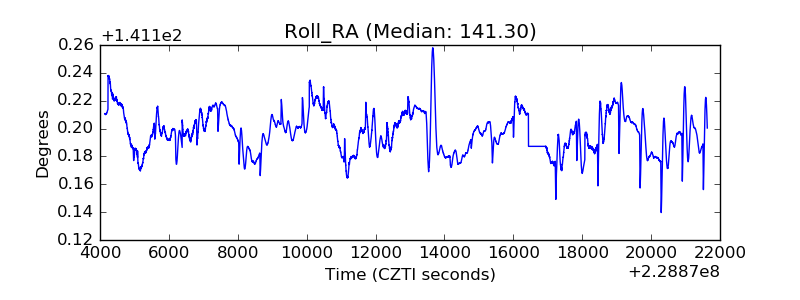 |
| Veto Counter | 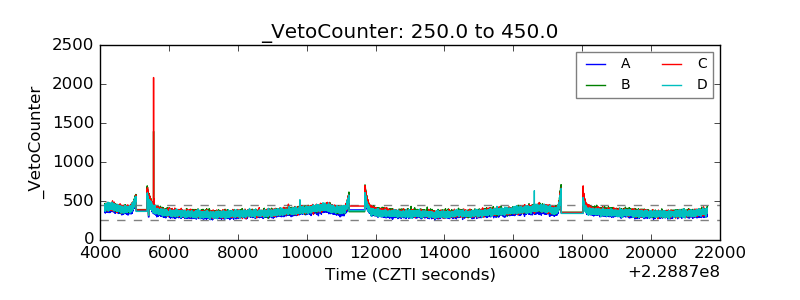 |