| Param | Original file | Final file |
|---|---|---|
| Filename | modeM0/AS1A03_036T01_9000001128_08187cztM0_level2.evt | modeM0/AS1A03_036T01_9000001128_08187cztM0_level2_quad_clean.evt |
| Size (bytes) | 601,153,920 | 112,314,240 |
| Size | 573.3 MB | 107.1 MB |
| Events in quadrant A | 4,211,739 | 699,969 |
| Events in quadrant B | 4,546,670 | 706,723 |
| Events in quadrant C | 4,095,047 | 693,092 |
| Events in quadrant D | 4,734,848 | 670,230 |
| Mode M9 | |||
|---|---|---|---|
| Quadrant | BADHDUFLAG | Total packets | Discarded packets |
| A | 0 | 18 | 0 |
| B | 0 | 18 | 0 |
| C | 0 | 18 | 0 |
| D | 0 | 18 | 0 |
| Mode SS | |||
|---|---|---|---|
| Quadrant | BADHDUFLAG | Total packets | Discarded packets |
| A | 0 | 184 | 0 |
| B | 0 | 184 | 0 |
| C | 0 | 184 | 0 |
| D | 0 | 184 | 0 |
| Mode M0 | |||
|---|---|---|---|
| Quadrant | BADHDUFLAG | Total packets | Discarded packets |
| A | 0 | 18557 | 3 |
| B | 0 | 19271 | 2 |
| C | 0 | 18467 | 2 |
| D | 0 | 20306 | 2 |
| Quadrant | Total seconds | Saturated seconds | Saturation percentage |
|---|---|---|---|
| A | 9106 | 115 | 1.262904% |
| B | 9106 | 166 | 1.822974% |
| C | 9106 | 95 | 1.043268% |
| D | 9106 | 149 | 1.636284% |
Noise dominated data is calculated using 1-second bins in cleaned event files. If a bin has >2000 counts, and if more than 50% of those come from <1% of pixels, then it is considered to be noise-dominated and hence unusable.
| Quadrant | # 1 sec bins | Bins with >0 counts | Bins with >2000 counts | High rate bins dominated by noise | Noise dominated (total time) | Noise dominated (detector-on time) | Marked lightcurve |
|---|---|---|---|---|---|---|---|
| A | 10836 | 9106 | 0 | 0 | 0.00% | 0.00% | 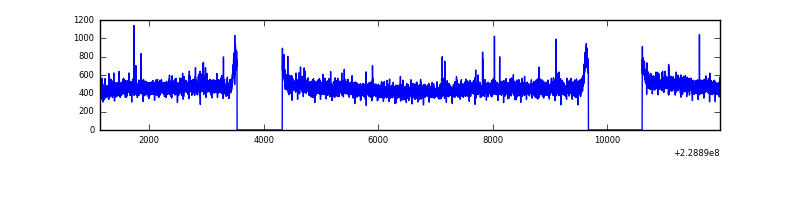 |
| B | 10836 | 9106 | 31 | 31 | 0.29% | 0.34% | 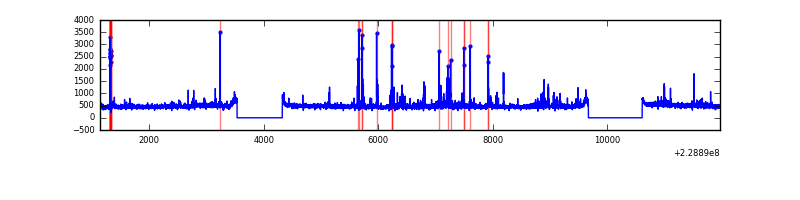 |
| C | 10836 | 9106 | 0 | 0 | 0.00% | 0.00% | 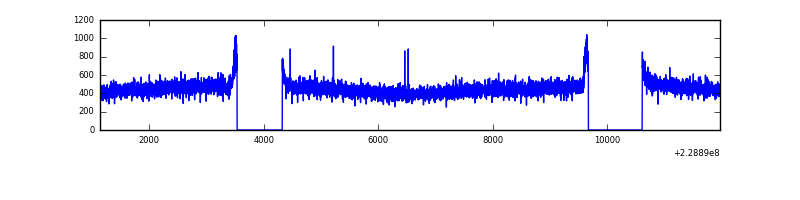 |
| D | 10836 | 9106 | 48 | 48 | 0.44% | 0.53% | 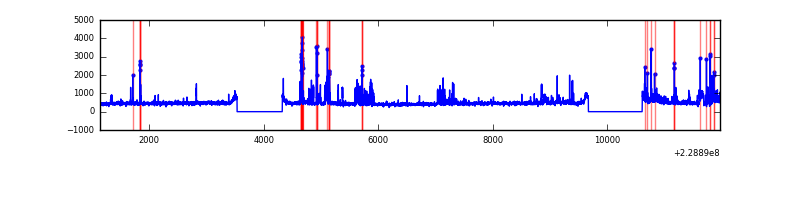 |
Top three noisy pixels from each quadrant. If the there are fewer than three noisy pixels in the level2.evt file, extra rows are filled as -1
| Pixel properties | Quadrant properties | ||||||
|---|---|---|---|---|---|---|---|
| Quadrant | DetID | PixID | Counts | Sigma | Mean | Median | Sigma |
| A | 8 | 15 | 27432 | 118.77 | 1079 | 1052 | 222.1 |
| A | 13 | 14 | 20239 | 86.38 | 1079 | 1052 | 222.1 |
| A | 0 | 226 | 10245 | 41.39 | 1079 | 1052 | 222.1 |
| B | 10 | 16 | 121512 | 586.32 | 1081 | 1052 | 205.4 |
| B | 0 | 214 | 107943 | 520.28 | 1081 | 1052 | 205.4 |
| B | 4 | 81 | 43165 | 204.98 | 1081 | 1052 | 205.4 |
| C | 13 | 61 | 8041 | 28.81 | 1048 | 1049 | 242.7 |
| C | 14 | 67 | 3455 | 9.91 | 1048 | 1049 | 242.7 |
| C | 3 | 202 | 2668 | 6.67 | 1048 | 1049 | 242.7 |
| D | 1 | 52 | 467404 | 1687.04 | 1038 | 1013 | 276.5 |
| D | 14 | 34 | 117876 | 422.72 | 1038 | 1013 | 276.5 |
| D | 6 | 225 | 75004 | 267.64 | 1038 | 1013 | 276.5 |
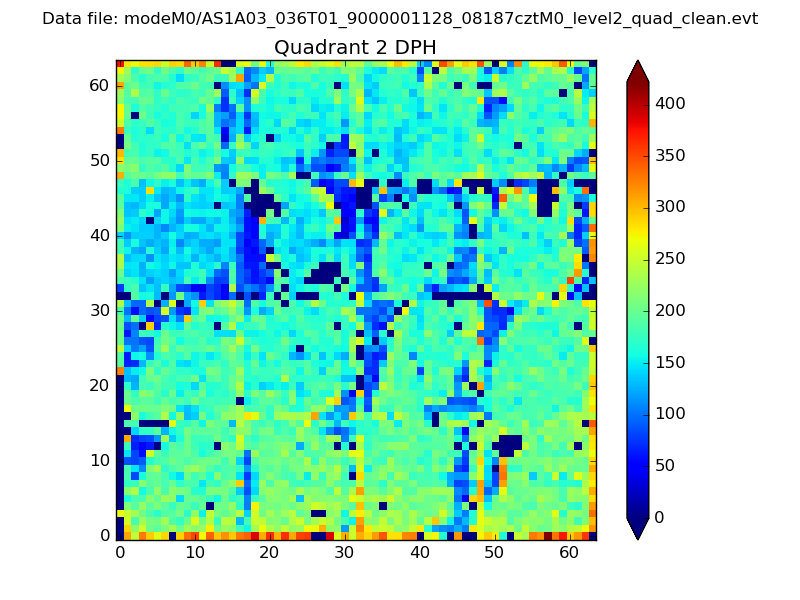
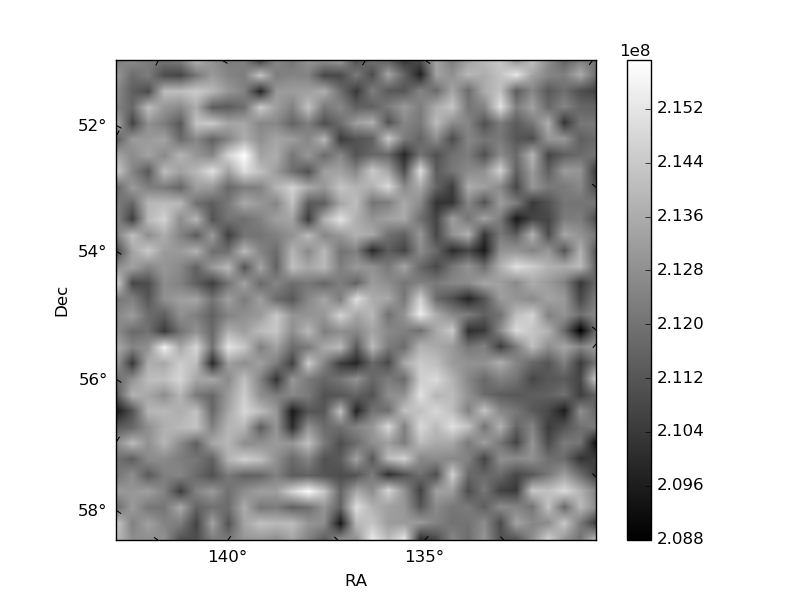
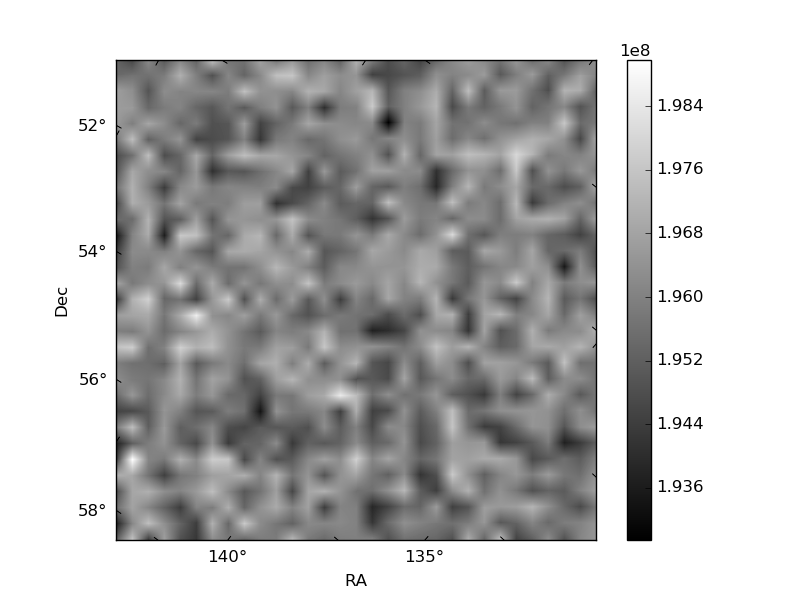
Histogram calculated using DETX and DETY for each event in the final _common_clean file
| Quadrant A | 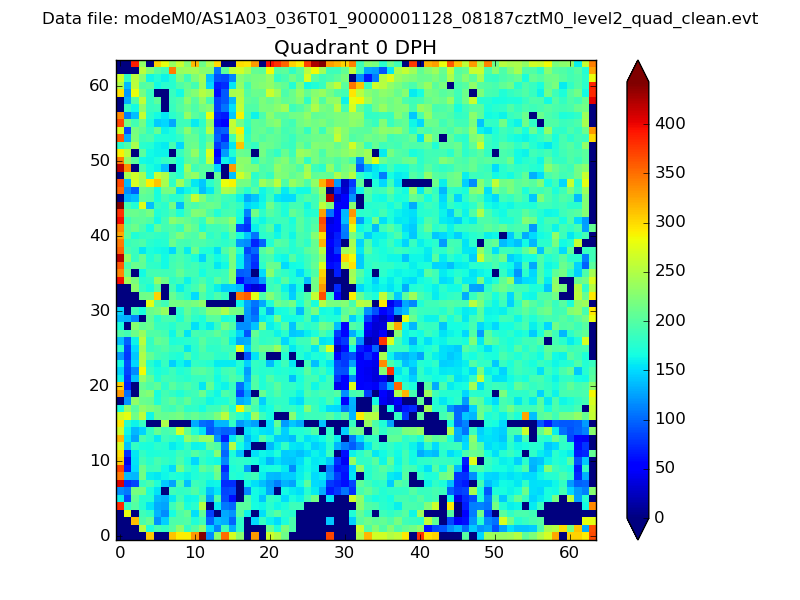 |
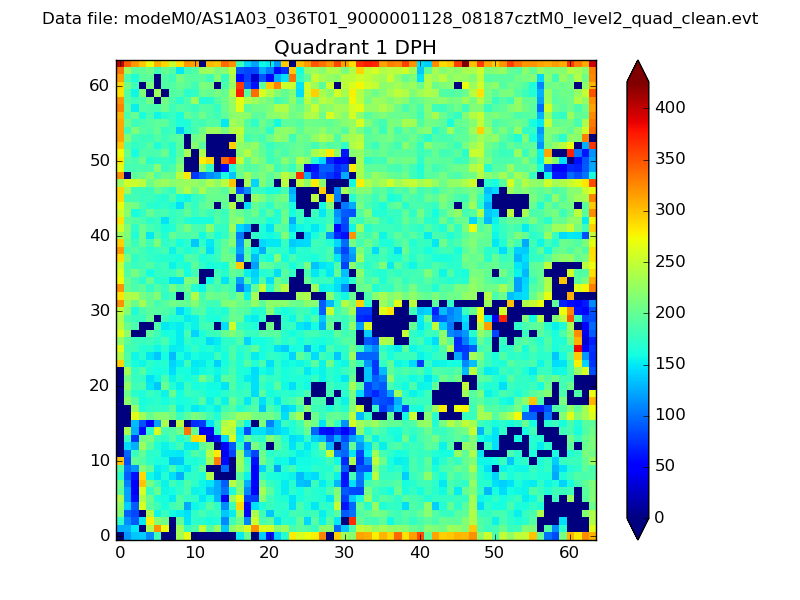 |
Quadrant B |
|---|---|---|---|
| Quadrant D | 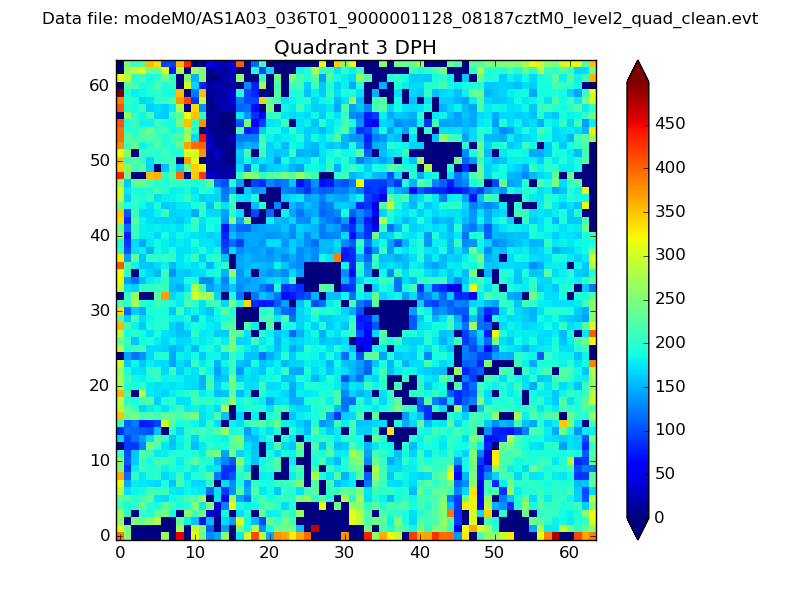 |
 |
Quadrant C |
| Plot type | Count rate plots | Images |
|---|---|---|
| Comparison with Poisson distribution Blue bars denote a histogram of data divided into 1 sec bins. Red curve is a Poisson curve with rate = median count rate of data. |
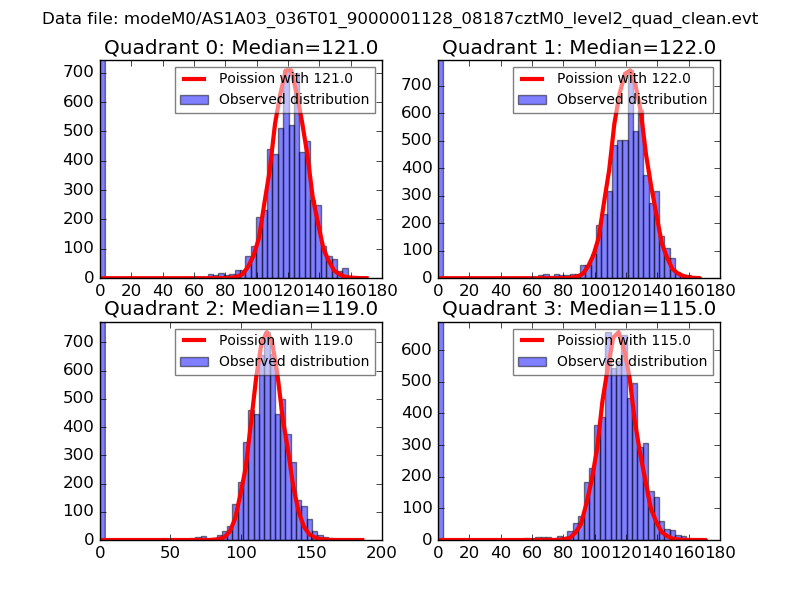 |
 |
| Quadrant-wise count rates Data is divided into 100 sec bins |
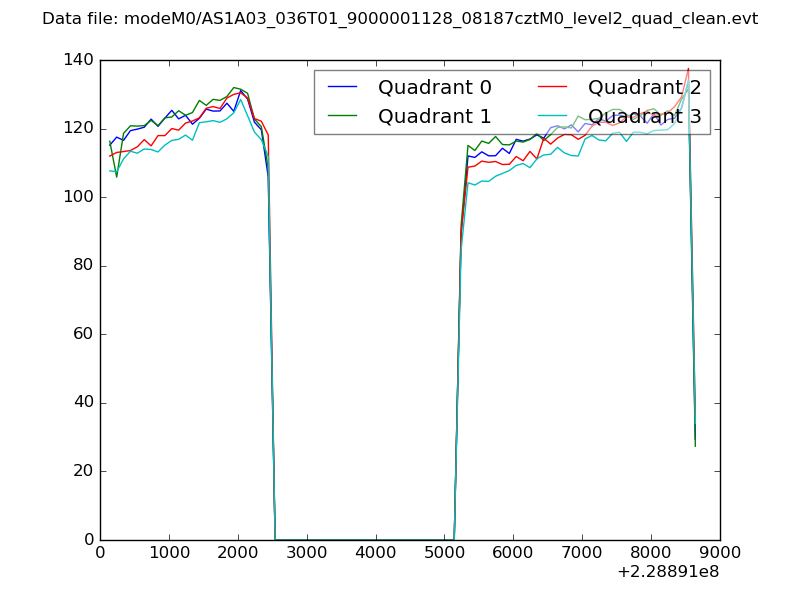 |
|
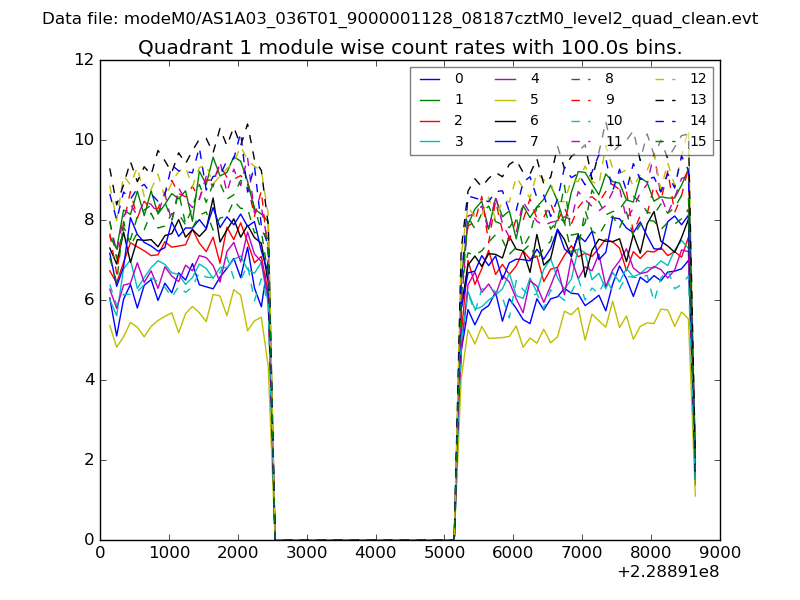
| Module-wise count rates for Quadrant A Data is divided into 100 sec bins |
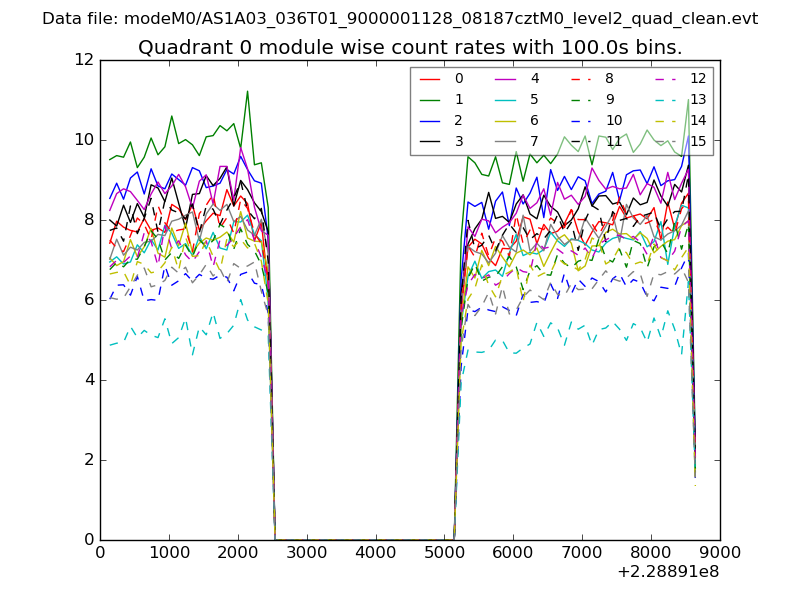 |
 |
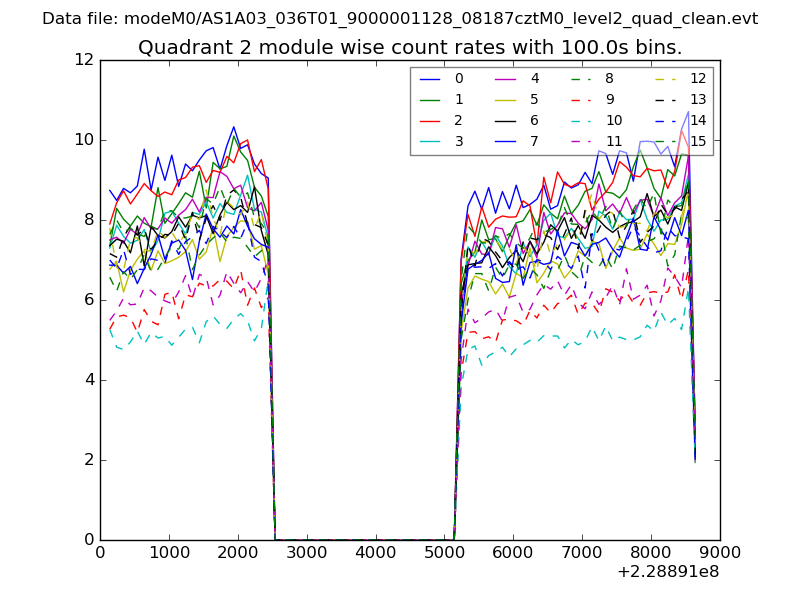
| Module-wise count rates for Quadrant B Data is divided into 100 sec bins |
 |
 |
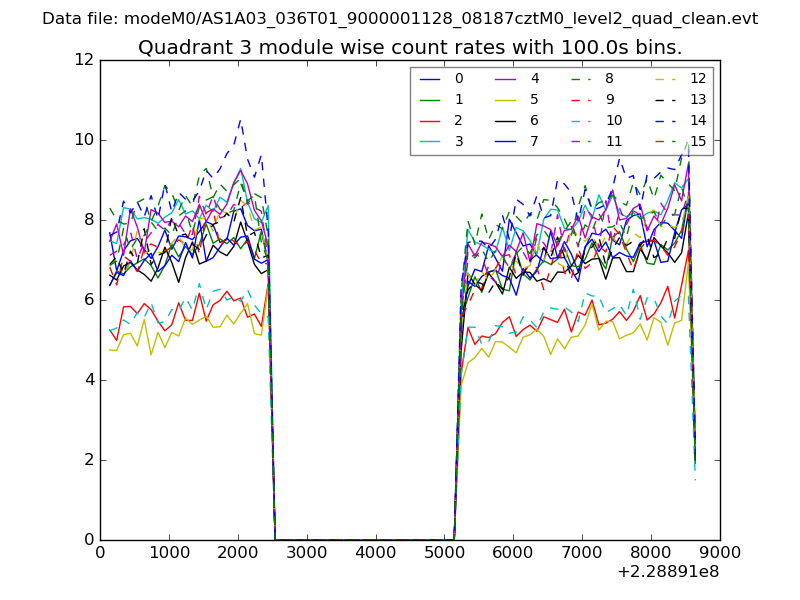
| Module-wise count rates for Quadrant C Data is divided into 100 sec bins |
 |
 |
| Module-wise count rates for Quadrant D Data is divided into 100 sec bins |
 |
 |
| Parameter | Plot |
|---|---|
| CZT HV Monitor | 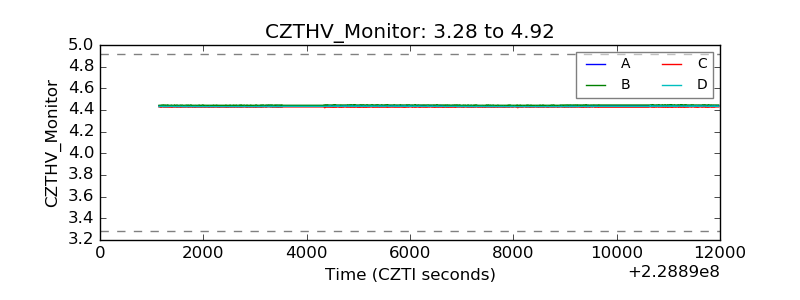 |
| D_VDD | 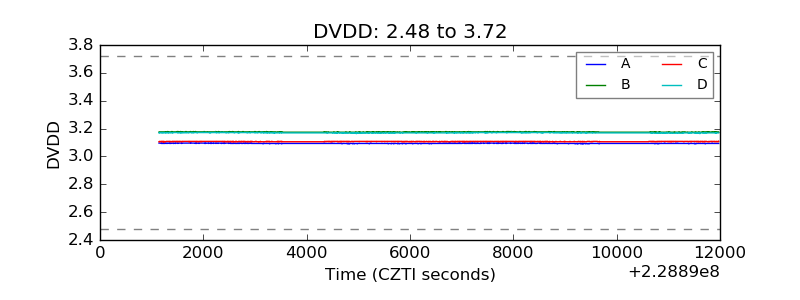 |
| Temperature 1 | 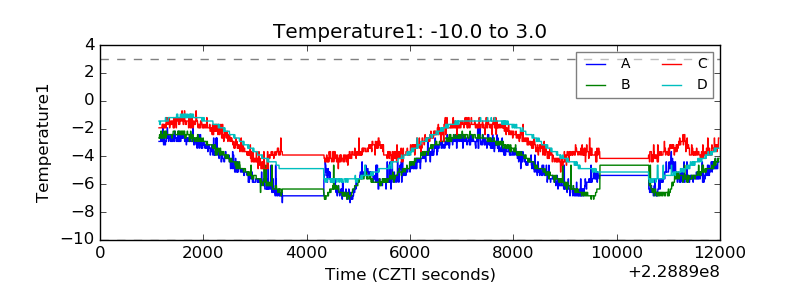 |
| Veto HV Monitor | 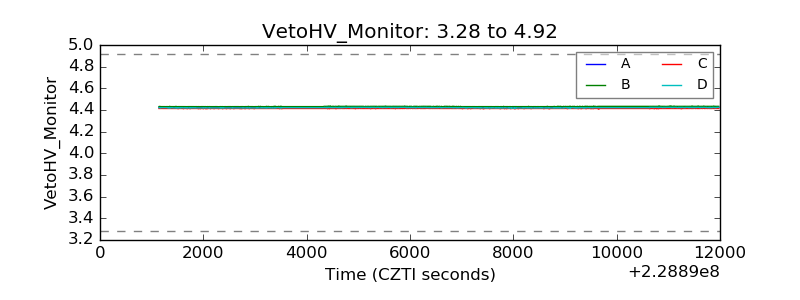 |
| Veto LLD | 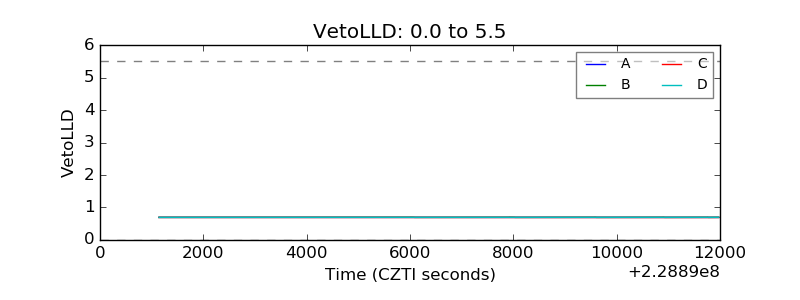 |
| Alpha Counter | 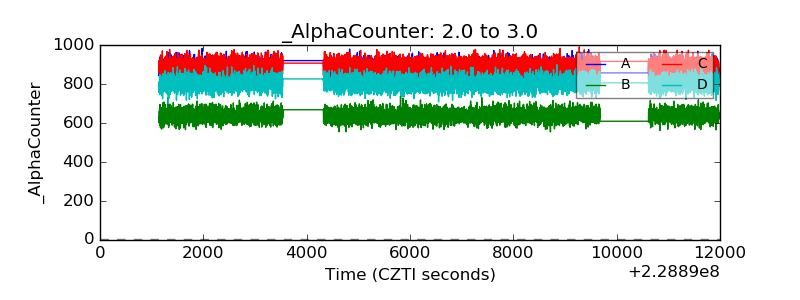 |
| _CPM_Rate | 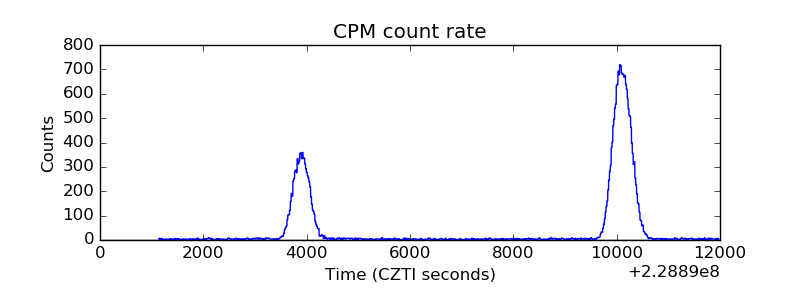 |
| CZT Counter | 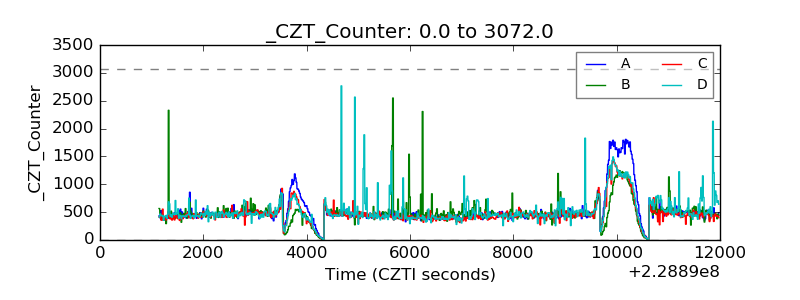 |
| +2.5 Volts monitor |  |
| +5 Volts monitor |  |
| _ROLL_ROT | 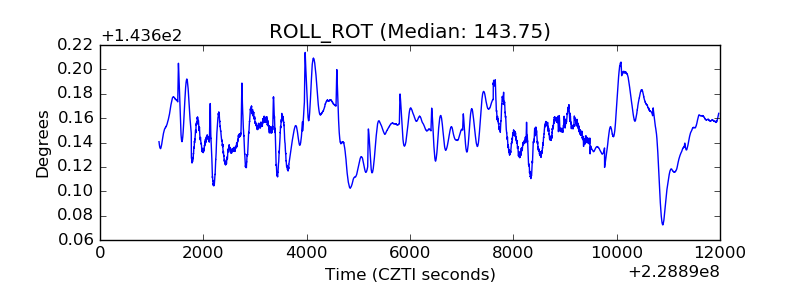 |
| _Roll_DEC | 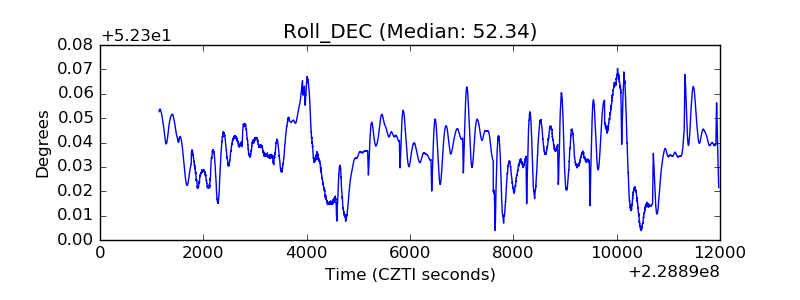 |
| _Roll_RA |  |
| Veto Counter | 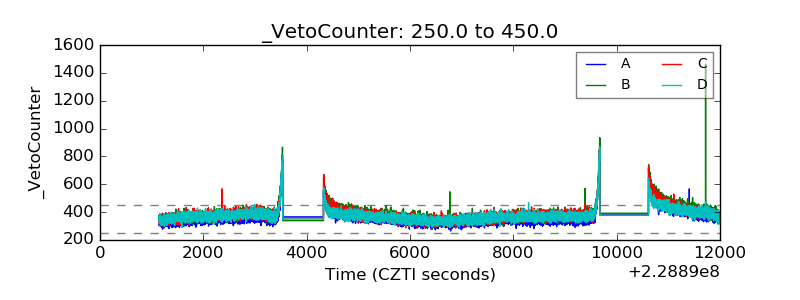 |