| Param | Original file | Final file |
|---|---|---|
| Filename | modeM0/AS1A03_036T01_9000001128_08190cztM0_level2.evt | modeM0/AS1A03_036T01_9000001128_08190cztM0_level2_quad_clean.evt |
| Size (bytes) | 314,614,080 | 62,997,120 |
| Size | 300.0 MB | 60.1 MB |
| Events in quadrant A | 2,072,961 | 412,431 |
| Events in quadrant B | 2,328,577 | 411,414 |
| Events in quadrant C | 1,994,008 | 400,487 |
| Events in quadrant D | 2,834,742 | 375,980 |
| Mode M9 | |||
|---|---|---|---|
| Quadrant | BADHDUFLAG | Total packets | Discarded packets |
| A | 0 | 10 | 0 |
| B | 0 | 10 | 0 |
| C | 0 | 10 | 0 |
| D | 0 | 10 | 0 |
| Mode SS | |||
|---|---|---|---|
| Quadrant | BADHDUFLAG | Total packets | Discarded packets |
| A | 0 | 92 | 0 |
| B | 0 | 92 | 0 |
| C | 0 | 92 | 0 |
| D | 0 | 92 | 0 |
| Mode M0 | |||
|---|---|---|---|
| Quadrant | BADHDUFLAG | Total packets | Discarded packets |
| A | 0 | 8985 | 1 |
| B | 0 | 9708 | 1 |
| C | 0 | 8913 | 1 |
| D | 0 | 11356 | 1 |
| Quadrant | Total seconds | Saturated seconds | Saturation percentage |
|---|---|---|---|
| A | 4353 | 67 | 1.539168% |
| B | 4353 | 134 | 3.078337% |
| C | 4353 | 41 | 0.941879% |
| D | 4353 | 310 | 7.121525% |
Noise dominated data is calculated using 1-second bins in cleaned event files. If a bin has >2000 counts, and if more than 50% of those come from <1% of pixels, then it is considered to be noise-dominated and hence unusable.
| Quadrant | # 1 sec bins | Bins with >0 counts | Bins with >2000 counts | High rate bins dominated by noise | Noise dominated (total time) | Noise dominated (detector-on time) | Marked lightcurve |
|---|---|---|---|---|---|---|---|
| A | 5413 | 4353 | 0 | 0 | 0.00% | 0.00% | 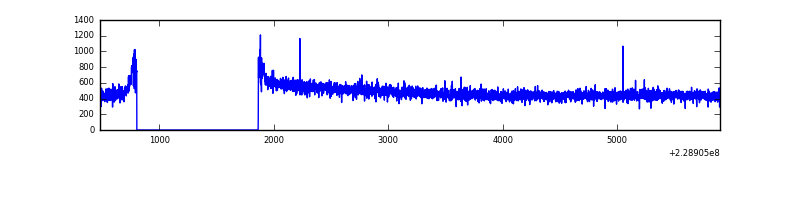 |
| B | 5413 | 4353 | 60 | 60 | 1.11% | 1.38% | 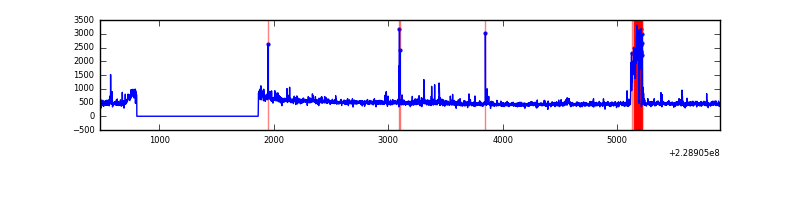 |
| C | 5413 | 4354 | 0 | 0 | 0.00% | 0.00% | 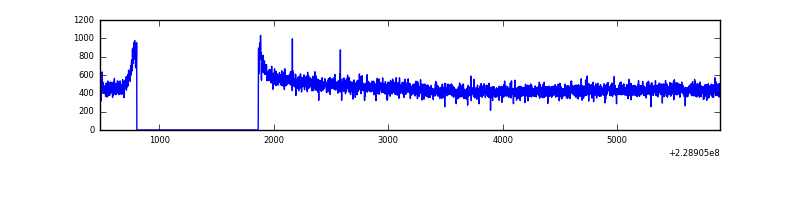 |
| D | 5413 | 4353 | 241 | 241 | 4.45% | 5.54% | 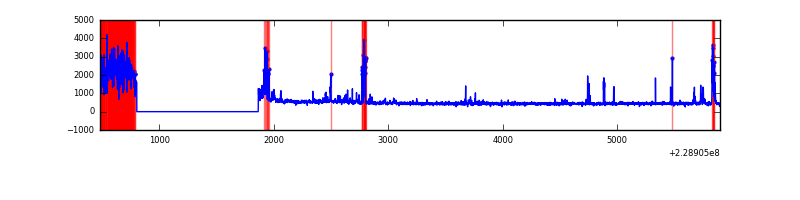 |
Top three noisy pixels from each quadrant. If the there are fewer than three noisy pixels in the level2.evt file, extra rows are filled as -1
| Pixel properties | Quadrant properties | ||||||
|---|---|---|---|---|---|---|---|
| Quadrant | DetID | PixID | Counts | Sigma | Mean | Median | Sigma |
| A | 13 | 14 | 8795 | 75.89 | 535 | 523 | 109.0 |
| A | 8 | 15 | 5804 | 48.45 | 535 | 523 | 109.0 |
| A | 0 | 226 | 5083 | 41.84 | 535 | 523 | 109.0 |
| B | 10 | 16 | 179682 | 1775.51 | 528 | 516 | 100.9 |
| B | 0 | 214 | 35697 | 348.64 | 528 | 516 | 100.9 |
| B | 4 | 81 | 29362 | 285.86 | 528 | 516 | 100.9 |
| C | 13 | 61 | 3815 | 27.99 | 511 | 513 | 118.0 |
| C | 3 | 202 | 1175 | 5.61 | 511 | 513 | 118.0 |
| C | -1 | -1 | -1 | -1.0 | 511 | 513 | 118.0 |
| D | 12 | 233 | 597683 | 4505.15 | 501 | 488 | 132.6 |
| D | 13 | 105 | 123698 | 929.48 | 501 | 488 | 132.6 |
| D | 1 | 52 | 81045 | 607.71 | 501 | 488 | 132.6 |
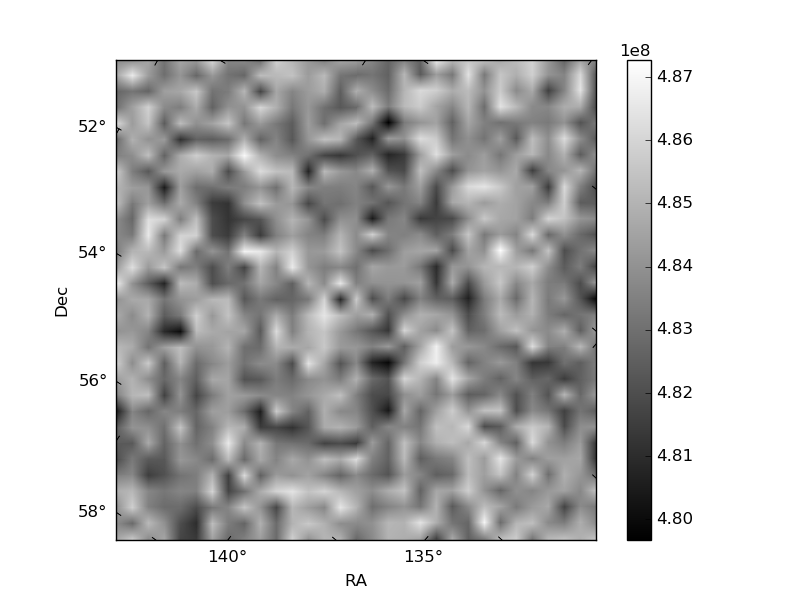
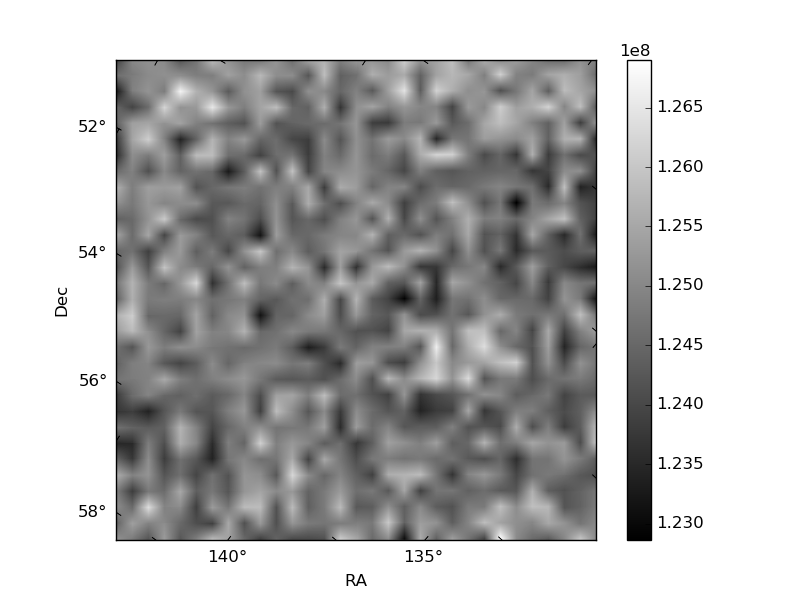
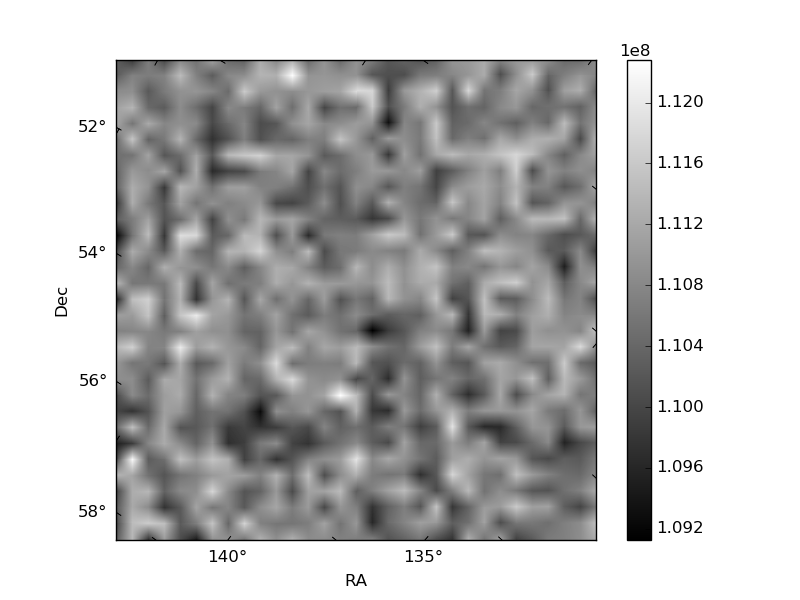
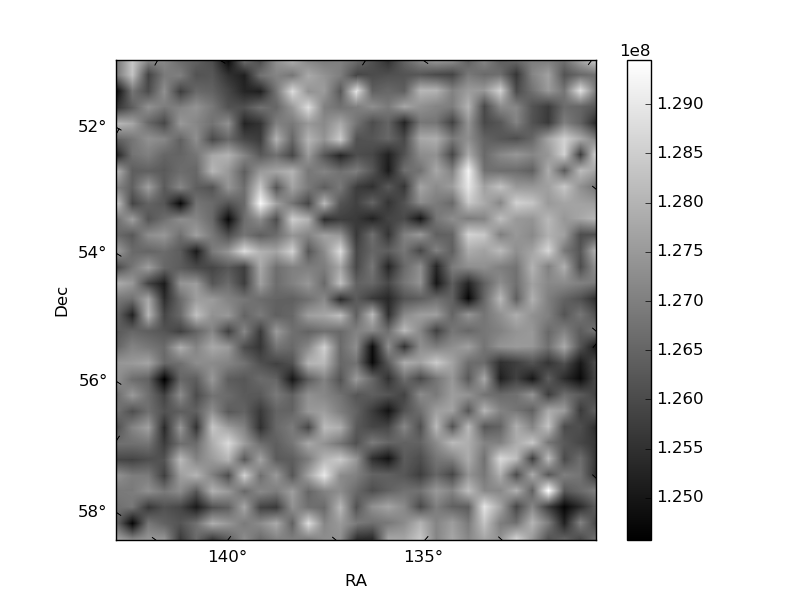
Histogram calculated using DETX and DETY for each event in the final _common_clean file
| Quadrant A | 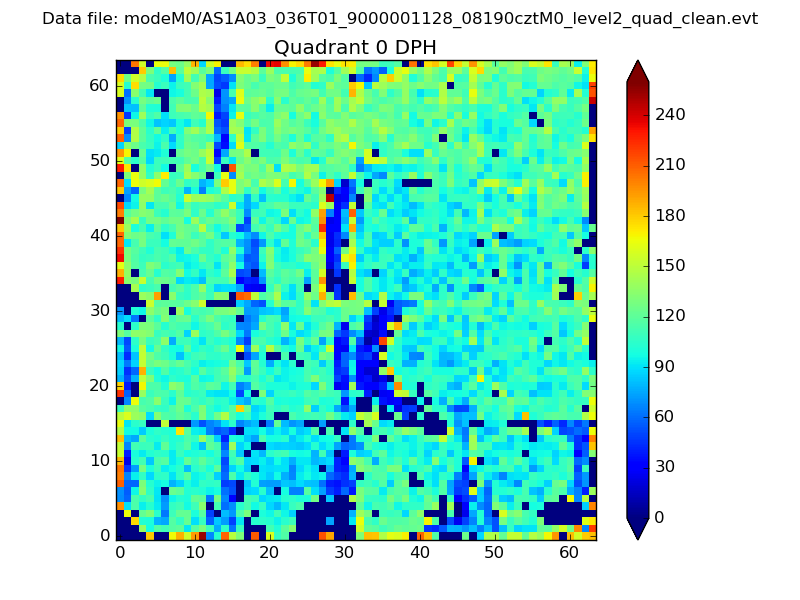 |
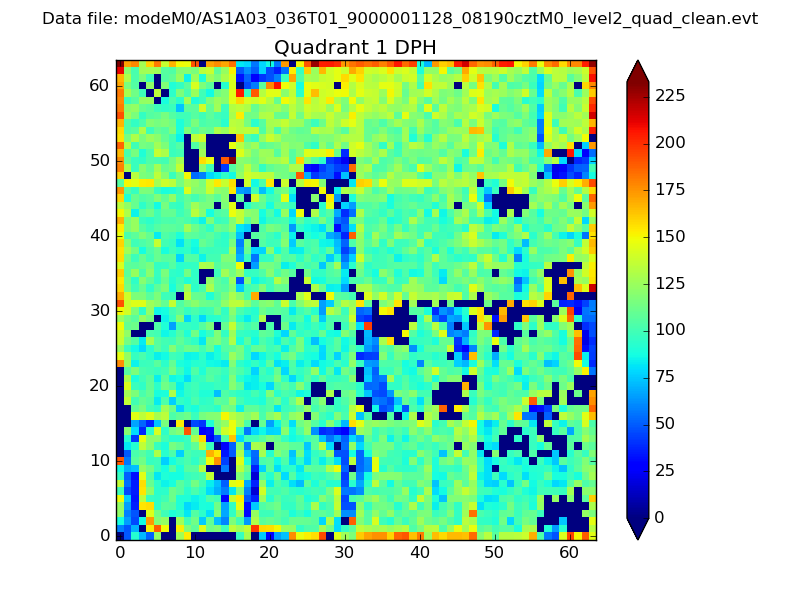 |
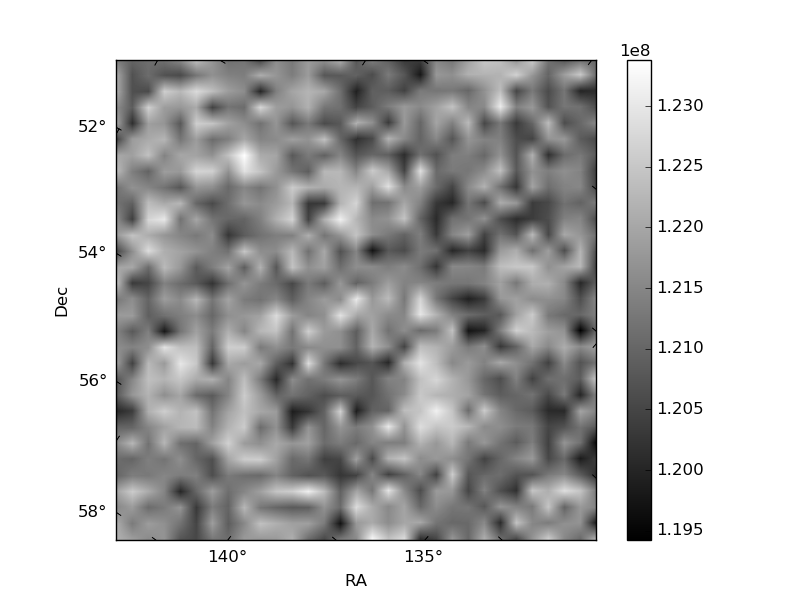
Quadrant B |
|---|---|---|---|
| Quadrant D | 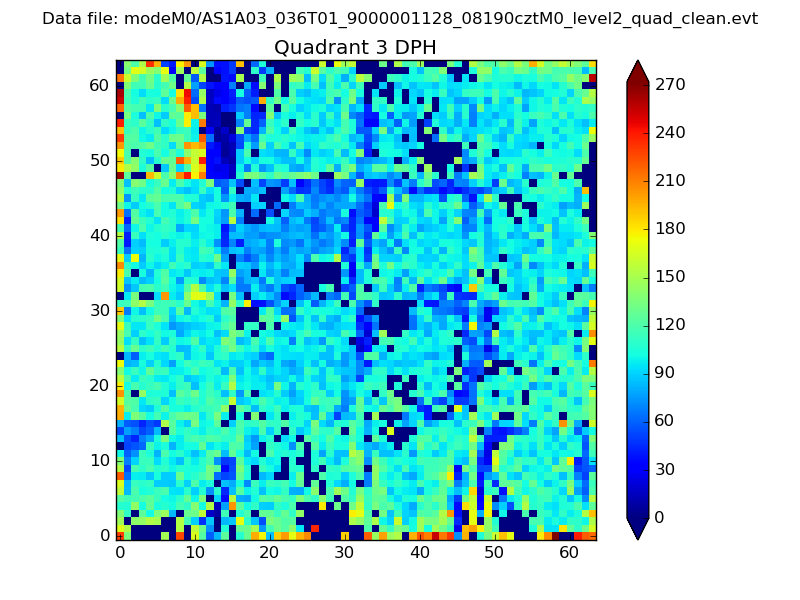 |
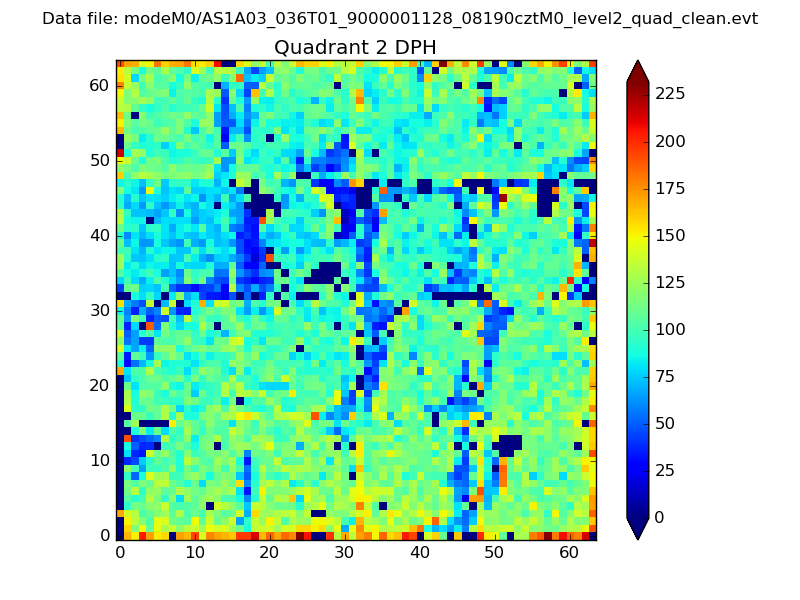 |
Quadrant C |
| Plot type | Count rate plots | Images |
|---|---|---|
| Comparison with Poisson distribution Blue bars denote a histogram of data divided into 1 sec bins. Red curve is a Poisson curve with rate = median count rate of data. |
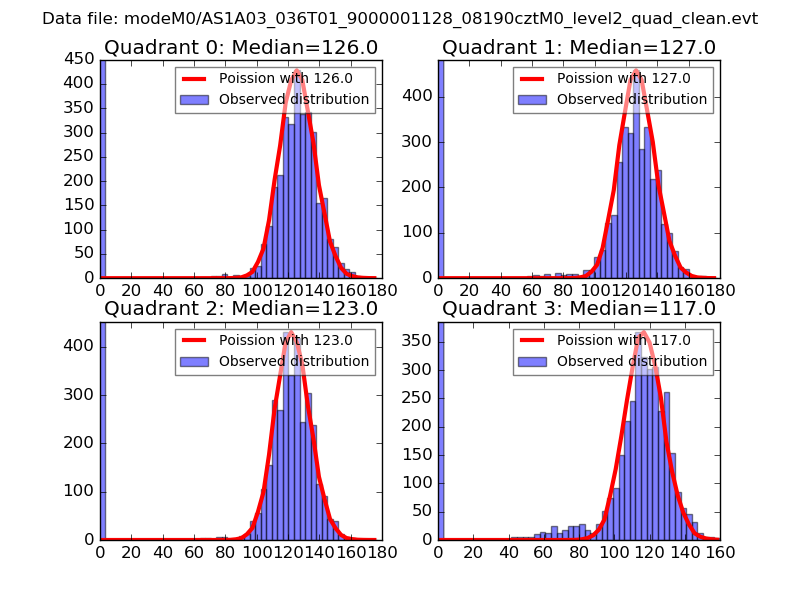 |
 |
| Quadrant-wise count rates Data is divided into 100 sec bins |
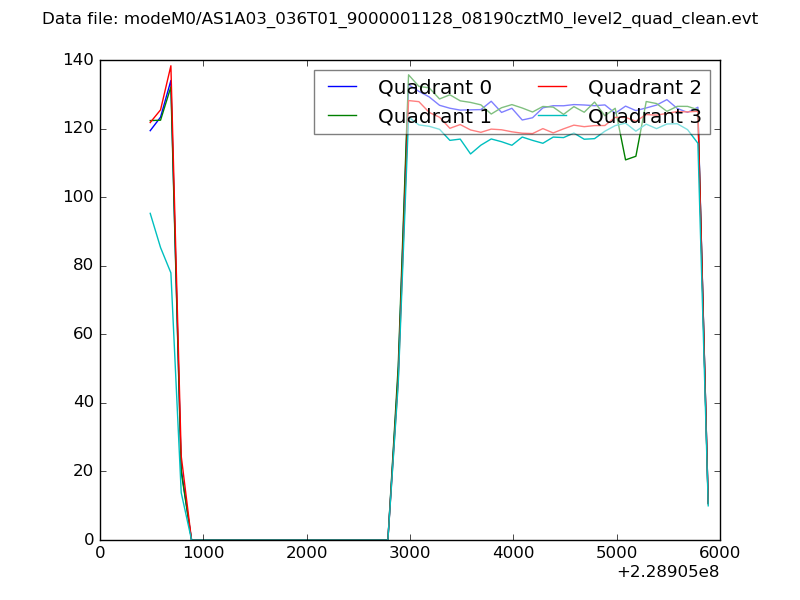 |
|
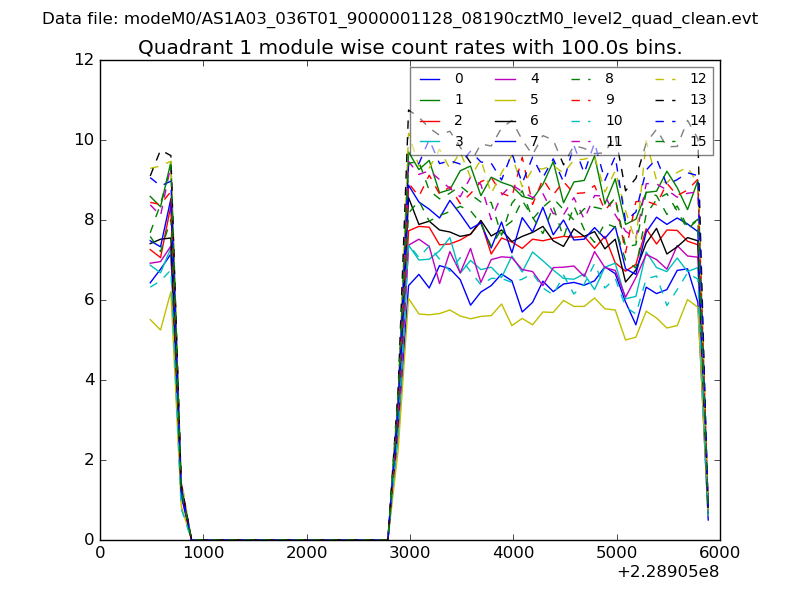
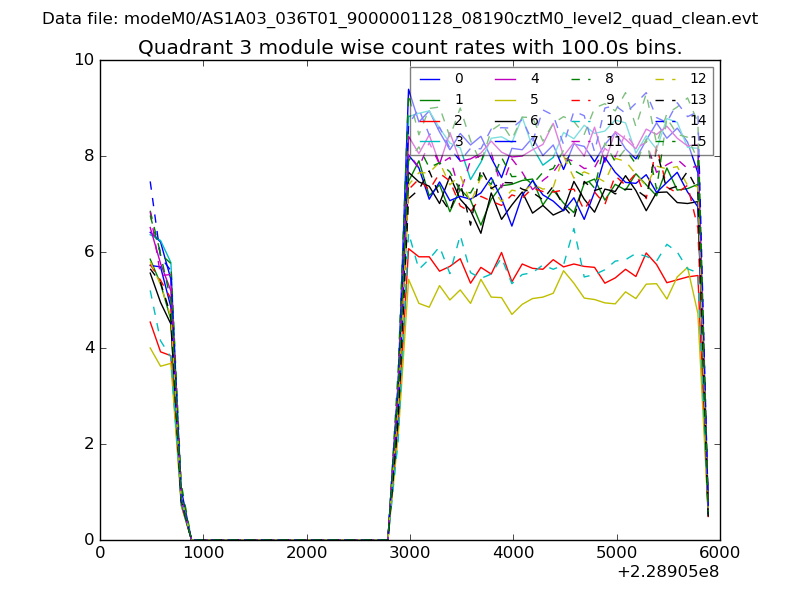
| Module-wise count rates for Quadrant A Data is divided into 100 sec bins |
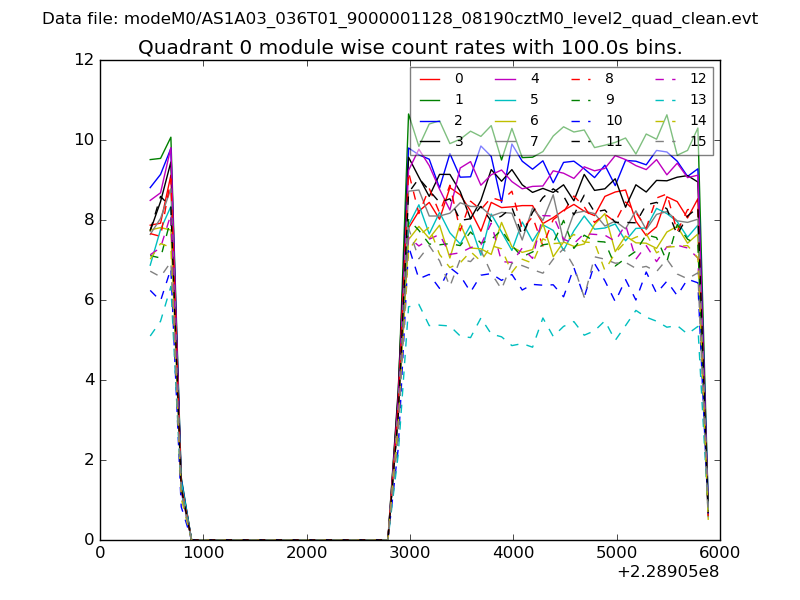 |
 |
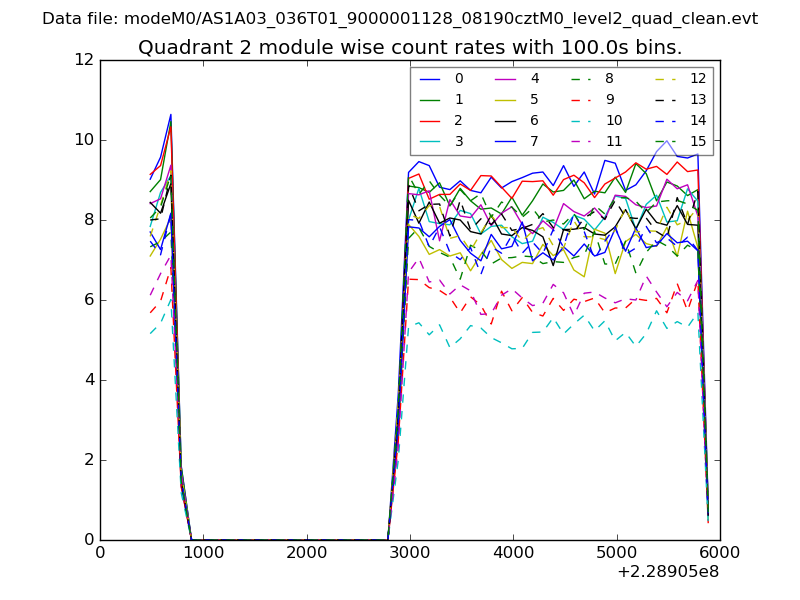
| Module-wise count rates for Quadrant B Data is divided into 100 sec bins |
 |
 |
| Module-wise count rates for Quadrant C Data is divided into 100 sec bins |
 |
 |
| Module-wise count rates for Quadrant D Data is divided into 100 sec bins |
 |
 |
| Parameter | Plot |
|---|---|
| CZT HV Monitor | 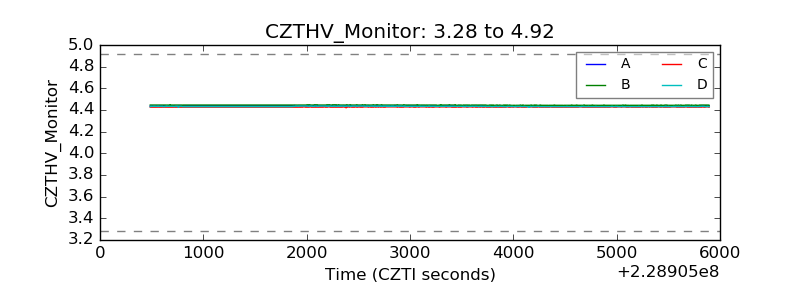 |
| D_VDD | 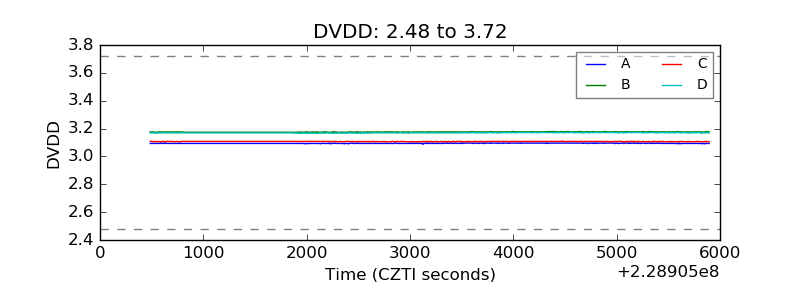 |
| Temperature 1 | 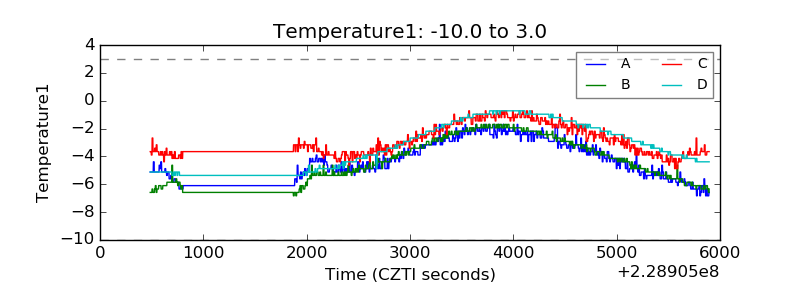 |
| Veto HV Monitor | 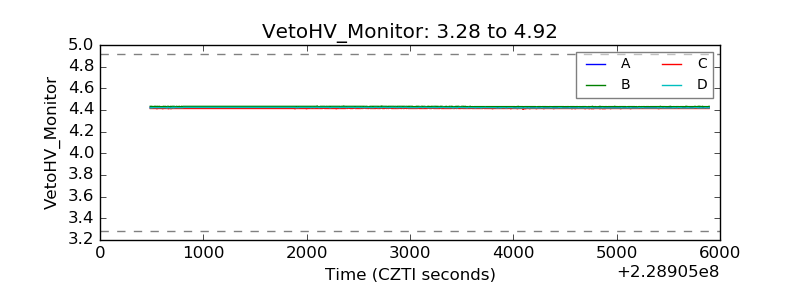 |
| Veto LLD | 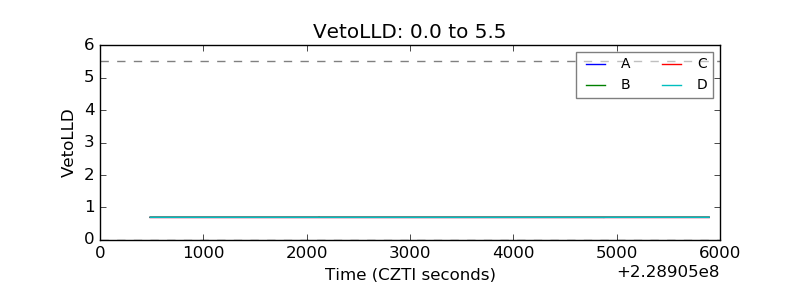 |
| Alpha Counter | 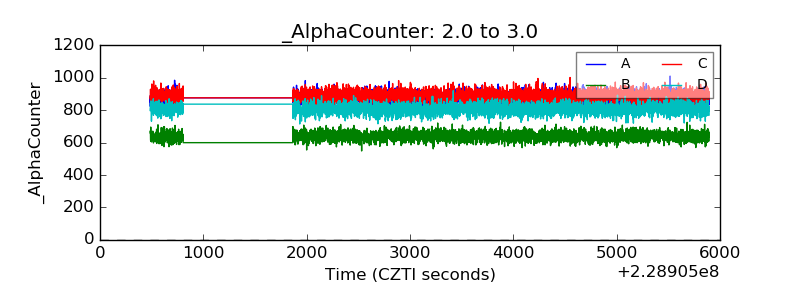 |
| _CPM_Rate | 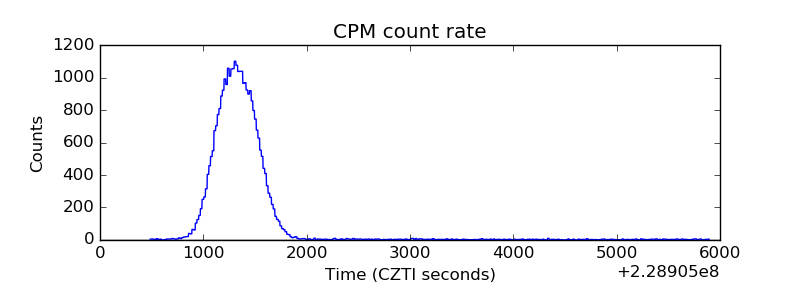 |
| CZT Counter | 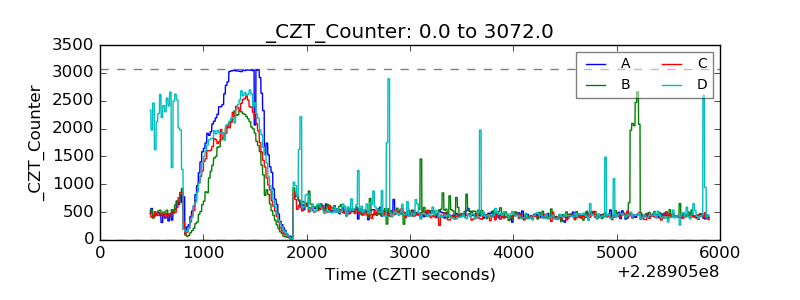 |
| +2.5 Volts monitor |  |
| +5 Volts monitor |  |
| _ROLL_ROT | 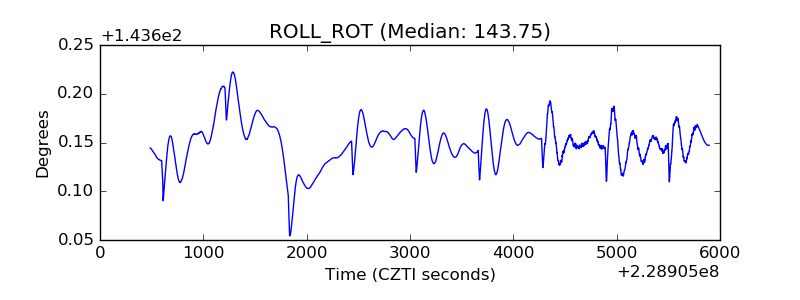 |
| _Roll_DEC | 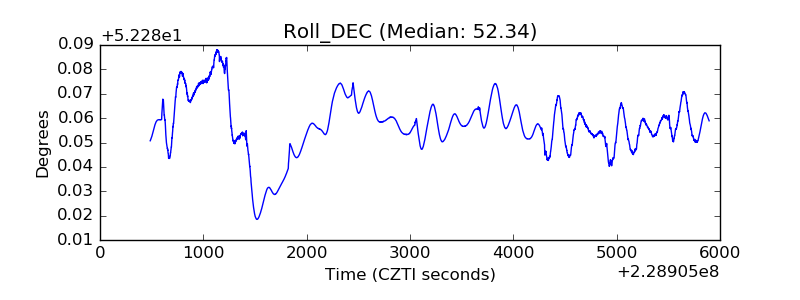 |
| _Roll_RA | 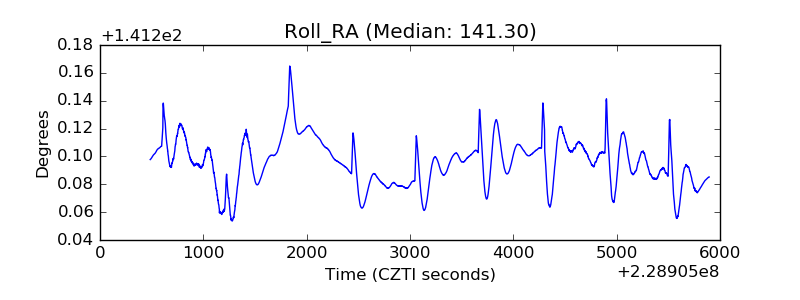 |
| Veto Counter | 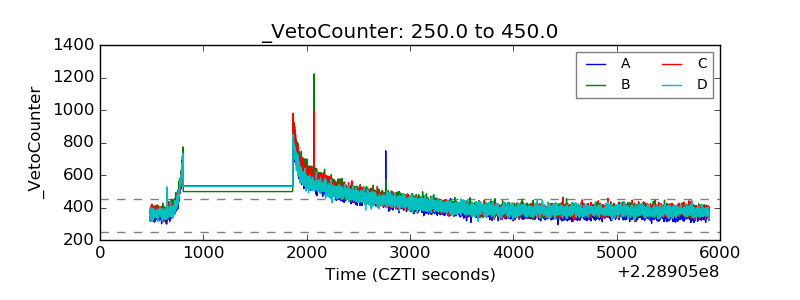 |