| Param | Original file | Final file |
|---|---|---|
| Filename | modeM0/AS1A03_106T01_9000001130cztM0_level2.fits | modeM0/AS1A03_106T01_9000001130cztM0_level2_quad_clean.evt |
| Size (bytes) | 452,404,800 | 534,130,560 |
| Size | 431.4 MB | 509.4 MB |
| Events in quadrant A | 2,735,492 | 3,359,819 |
| Events in quadrant B | 2,628,200 | 3,348,200 |
| Events in quadrant C | 2,662,424 | 3,170,780 |
| Events in quadrant D | 2,300,792 | 2,924,590 |
| Mode M0 | |||
|---|---|---|---|
| Quadrant | BADHDUFLAG | Total packets | Discarded packets |
| A | 0 | 101072 | 0 |
| B | 0 | 103832 | 0 |
| C | 0 | 100201 | 0 |
| D | 0 | 111072 | 0 |
| Mode M9 | |||
|---|---|---|---|
| Quadrant | BADHDUFLAG | Total packets | Discarded packets |
| A | 0 | 73 | 0 |
| B | 0 | 73 | 0 |
| C | 0 | 73 | 0 |
| D | 0 | 73 | 0 |
| Mode SS | |||
|---|---|---|---|
| Quadrant | BADHDUFLAG | Total packets | Discarded packets |
| A | 0 | 1004 | 0 |
| B | 0 | 1004 | 0 |
| C | 0 | 1002 | 0 |
| D | 0 | 1004 | 0 |
| Quadrant | Total seconds | Saturated seconds | Saturation percentage |
|---|---|---|---|
| A | 49158 | 474 | 0.964238% |
| B | 49161 | 576 | 1.171660% |
| C | 49158 | 233 | 0.473982% |
| D | 49158 | 1066 | 2.168518% |
Noise dominated data is calculated using 1-second bins in cleaned event files. If a bin has >2000 counts, and if more than 50% of those come from <1% of pixels, then it is considered to be noise-dominated and hence unusable.
| Quadrant | # 1 sec bins | Bins with >0 counts | Bins with >2000 counts | High rate bins dominated by noise | Noise dominated (total time) | Noise dominated (detector-on time) | Marked lightcurve |
|---|---|---|---|---|---|---|---|
| A | 55583 | 49170 | 0 | 0 | 0.00% | 0.00% | 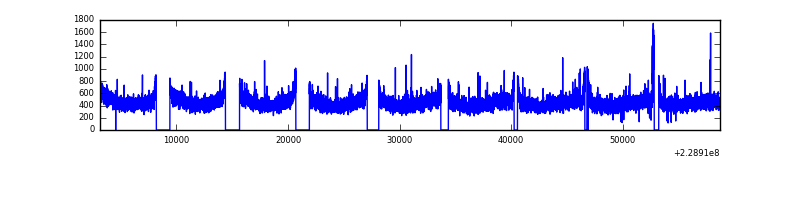 |
| B | 55583 | 49170 | 0 | 0 | 0.00% | 0.00% |  |
| C | 55583 | 49170 | 0 | 0 | 0.00% | 0.00% |  |
| D | 55583 | 49165 | 0 | 0 | 0.00% | 0.00% |  |
Top three noisy pixels from each quadrant. If the there are fewer than three noisy pixels in the level2.evt file, extra rows are filled as -1
| Pixel properties | Quadrant properties | ||||||
|---|---|---|---|---|---|---|---|
| Quadrant | DetID | PixID | Counts | Sigma | Mean | Median | Sigma |
| A | 0 | 29 | 2655 | 11.07 | 710 | 666 | 179.8 |
| A | 7 | 110 | 2242 | 8.77 | 710 | 666 | 179.8 |
| A | 0 | 30 | 2018 | 7.52 | 710 | 666 | 179.8 |
| B | 2 | 9 | 2301 | 12.07 | 692 | 662 | 135.8 |
| B | 12 | 226 | 1835 | 8.64 | 692 | 662 | 135.8 |
| B | 14 | 254 | 1771 | 8.17 | 692 | 662 | 135.8 |
| C | 1 | 81 | 1980 | 7.18 | 702 | 650 | 185.4 |
| C | 12 | 241 | 1885 | 6.66 | 702 | 650 | 185.4 |
| C | 1 | 80 | 1864 | 6.55 | 702 | 650 | 185.4 |
| D | 3 | 14 | 1686 | 6.23 | 655 | 596 | 175.1 |
| D | 6 | 231 | 1673 | 6.15 | 655 | 596 | 175.1 |
| D | 3 | 31 | 1655 | 6.05 | 655 | 596 | 175.1 |
Histogram calculated using DETX and DETY for each event in the final _common_clean file
| Quadrant A |  |
 |
Quadrant B |
|---|---|---|---|
| Quadrant D |  |
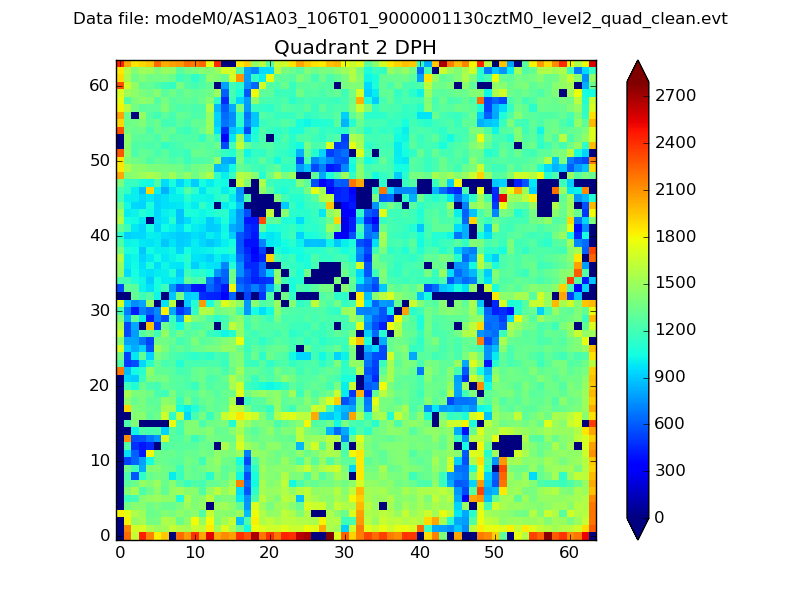 |
Quadrant C |
| Plot type | Count rate plots | Images |
|---|---|---|
| Comparison with Poisson distribution Blue bars denote a histogram of data divided into 1 sec bins. Red curve is a Poisson curve with rate = median count rate of data. |
 |
 |
| Quadrant-wise count rates Data is divided into 100 sec bins |
 |
|
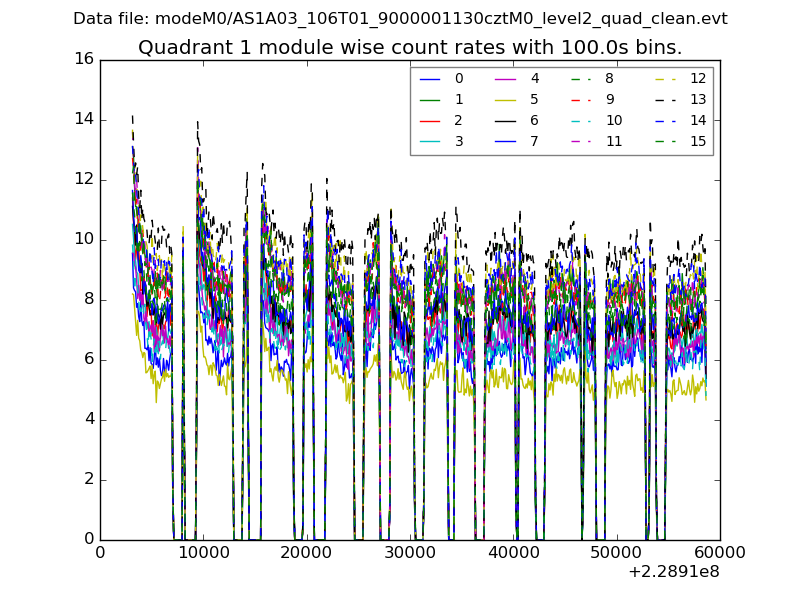
| Module-wise count rates for Quadrant A Data is divided into 100 sec bins |
 |
 |
| Module-wise count rates for Quadrant B Data is divided into 100 sec bins |
 |
 |
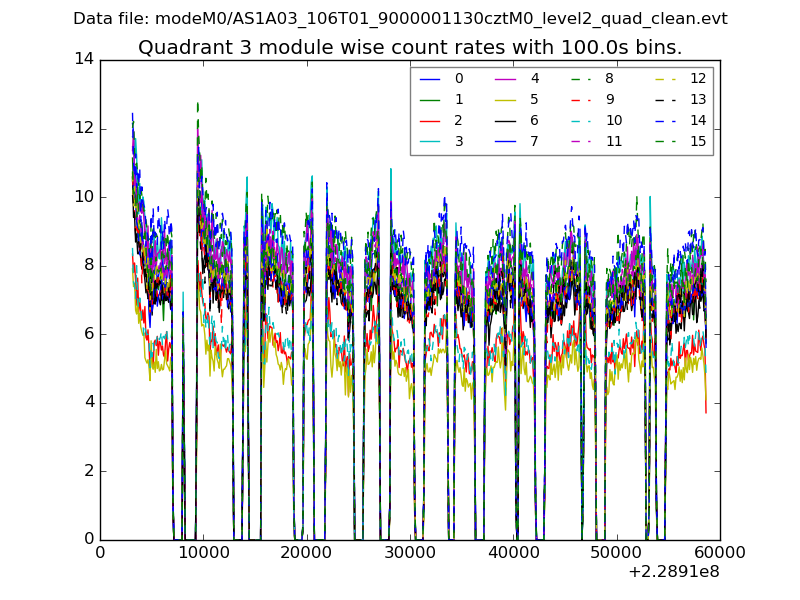
| Module-wise count rates for Quadrant C Data is divided into 100 sec bins |
 |
 |
| Module-wise count rates for Quadrant D Data is divided into 100 sec bins |
 |
 |
| Parameter | Plot |
|---|---|
| CZT HV Monitor |  |
| D_VDD | 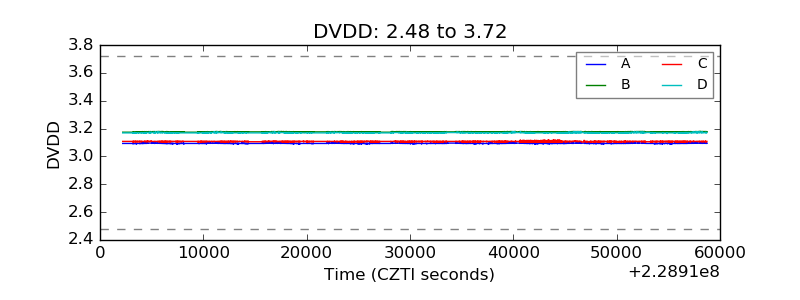 |
| Temperature 1 | 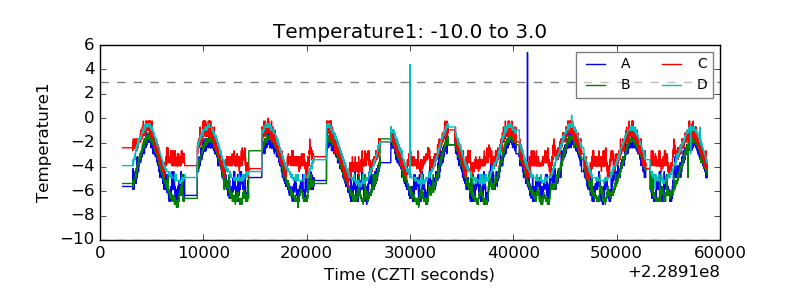 |
| Veto HV Monitor |  |
| Veto LLD |  |
| Alpha Counter | 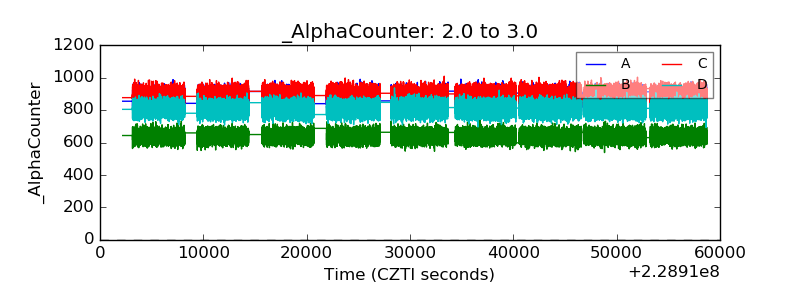 |
| _CPM_Rate | 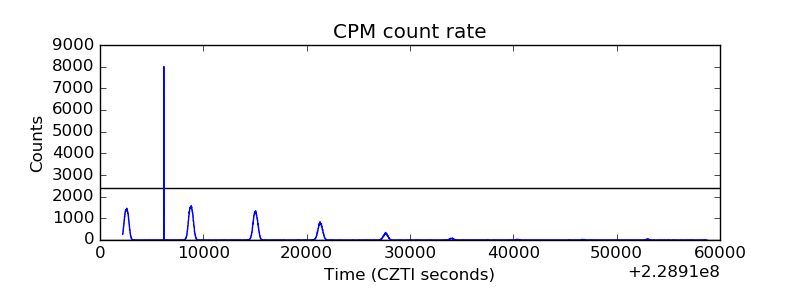 |
| CZT Counter |  |
| +2.5 Volts monitor | 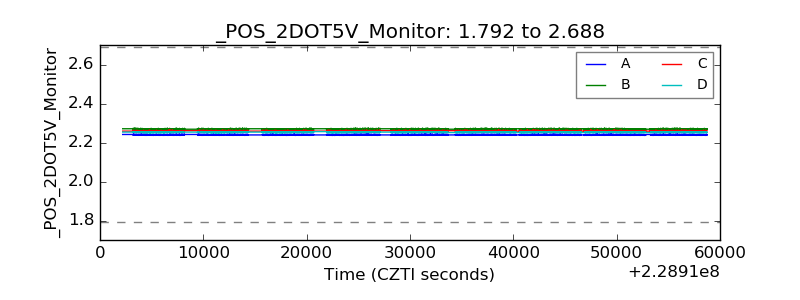 |
| +5 Volts monitor |  |
| _ROLL_ROT | 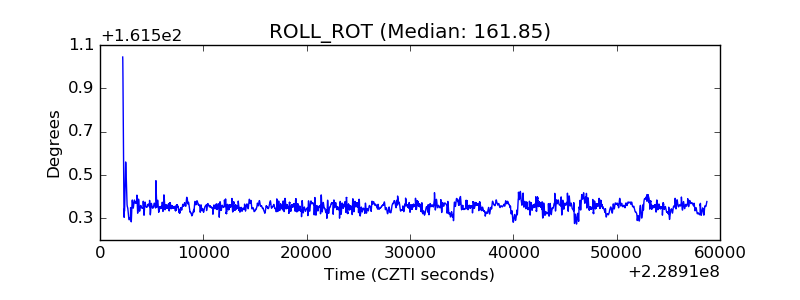 |
| _Roll_DEC |  |
| _Roll_RA | 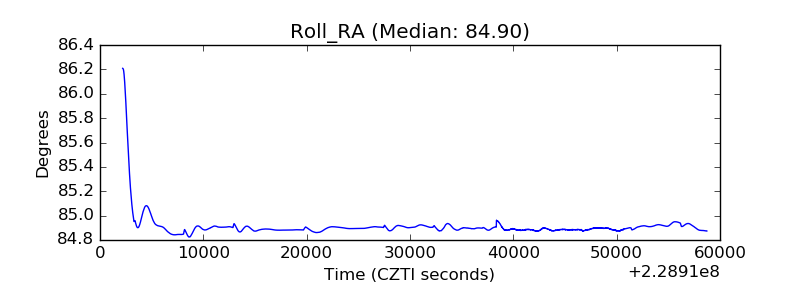 |
| Veto Counter |  |