| Param | Original file | Final file |
|---|---|---|
| Filename | modeM0/AS1A03_106T01_9000001130_08190cztM0_level2.evt | modeM0/AS1A03_106T01_9000001130_08190cztM0_level2_quad_clean.evt |
| Size (bytes) | 105,655,680 | 31,351,680 |
| Size | 100.8 MB | 29.9 MB |
| Events in quadrant A | 767,371 | 214,349 |
| Events in quadrant B | 772,487 | 217,491 |
| Events in quadrant C | 738,455 | 208,825 |
| Events in quadrant D | 823,039 | 203,536 |
| Mode M0 | |||
|---|---|---|---|
| Quadrant | BADHDUFLAG | Total packets | Discarded packets |
| A | 0 | 3115 | 2 |
| B | 0 | 3125 | 1 |
| C | 0 | 3046 | 1 |
| D | 0 | 3308 | 1 |
| Mode M9 | |||
|---|---|---|---|
| Quadrant | BADHDUFLAG | Total packets | Discarded packets |
| A | 0 | 10 | 0 |
| B | 0 | 10 | 0 |
| C | 0 | 10 | 0 |
| D | 0 | 10 | 0 |
| Mode SS | |||
|---|---|---|---|
| Quadrant | BADHDUFLAG | Total packets | Discarded packets |
| A | 0 | 28 | 0 |
| B | 0 | 28 | 0 |
| C | 0 | 28 | 0 |
| D | 0 | 28 | 0 |
| Quadrant | Total seconds | Saturated seconds | Saturation percentage |
|---|---|---|---|
| A | 1406 | 8 | 0.568990% |
| B | 1406 | 10 | 0.711238% |
| C | 1406 | 2 | 0.142248% |
| D | 1406 | 18 | 1.280228% |
Noise dominated data is calculated using 1-second bins in cleaned event files. If a bin has >2000 counts, and if more than 50% of those come from <1% of pixels, then it is considered to be noise-dominated and hence unusable.
| Quadrant | # 1 sec bins | Bins with >0 counts | Bins with >2000 counts | High rate bins dominated by noise | Noise dominated (total time) | Noise dominated (detector-on time) | Marked lightcurve |
|---|---|---|---|---|---|---|---|
| A | 1406 | 1406 | 0 | 0 | 0.00% | 0.00% | 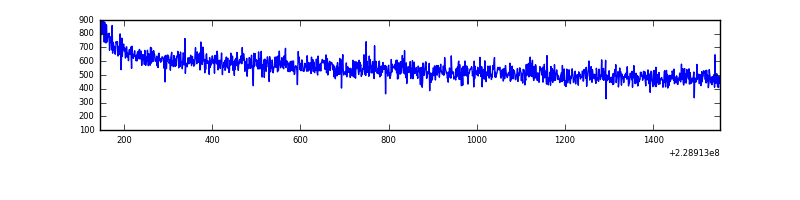 |
| B | 1406 | 1406 | 0 | 0 | 0.00% | 0.00% | 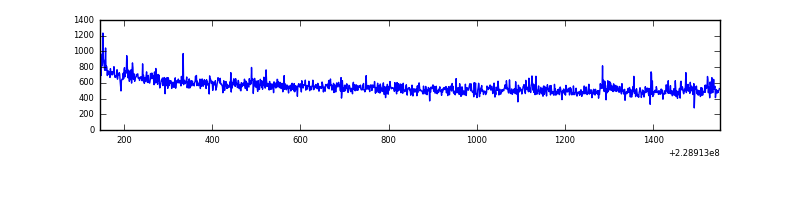 |
| C | 1406 | 1406 | 0 | 0 | 0.00% | 0.00% | 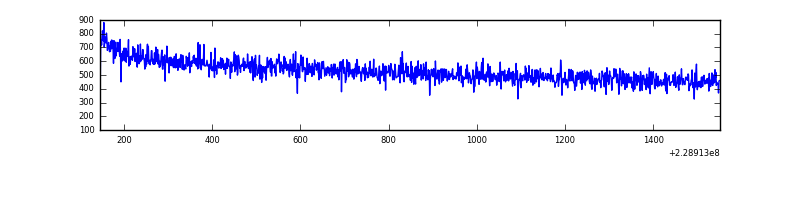 |
| D | 1406 | 1406 | 4 | 4 | 0.28% | 0.28% | 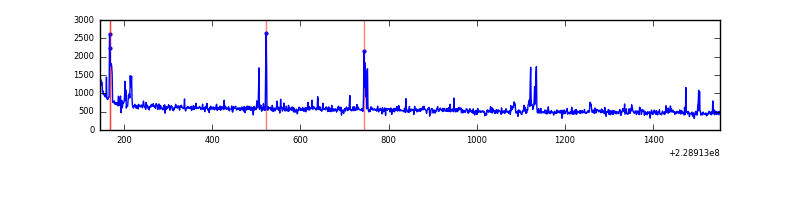 |
Top three noisy pixels from each quadrant. If the there are fewer than three noisy pixels in the level2.evt file, extra rows are filled as -1
| Pixel properties | Quadrant properties | ||||||
|---|---|---|---|---|---|---|---|
| Quadrant | DetID | PixID | Counts | Sigma | Mean | Median | Sigma |
| A | 13 | 14 | 4142 | 94.88 | 198 | 194 | 41.6 |
| A | 0 | 226 | 1887 | 40.69 | 198 | 194 | 41.6 |
| A | 12 | 194 | 1764 | 37.73 | 198 | 194 | 41.6 |
| B | 0 | 214 | 7619 | 195.08 | 194 | 189 | 38.1 |
| B | 4 | 81 | 7117 | 181.9 | 194 | 189 | 38.1 |
| B | 0 | 219 | 4713 | 118.78 | 194 | 189 | 38.1 |
| C | 13 | 61 | 1417 | 27.16 | 189 | 189 | 45.2 |
| C | 7 | 159 | 494 | 6.75 | 189 | 189 | 45.2 |
| C | 3 | 202 | 484 | 6.53 | 189 | 189 | 45.2 |
| D | 12 | 233 | 22494 | 432.14 | 192 | 187 | 51.6 |
| D | 6 | 225 | 21515 | 413.17 | 192 | 187 | 51.6 |
| D | 1 | 7 | 20727 | 397.91 | 192 | 187 | 51.6 |
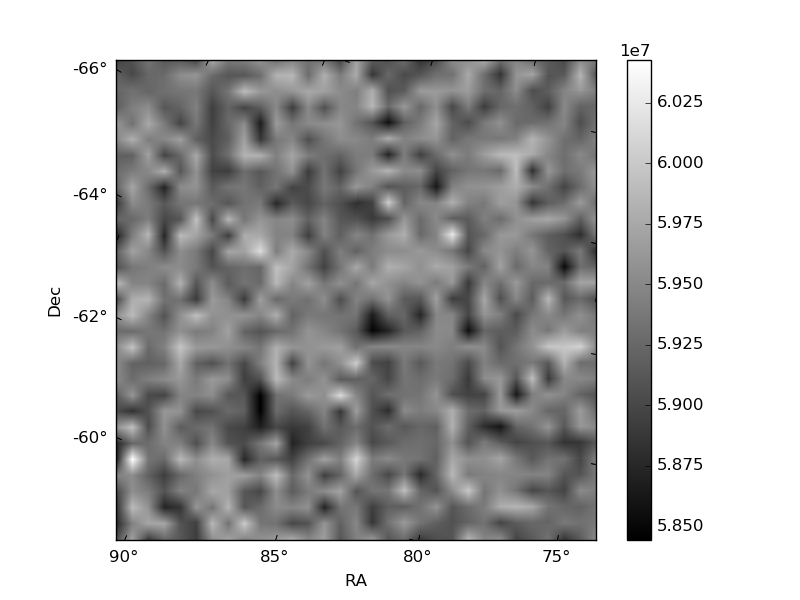
Histogram calculated using DETX and DETY for each event in the final _common_clean file
| Quadrant A | 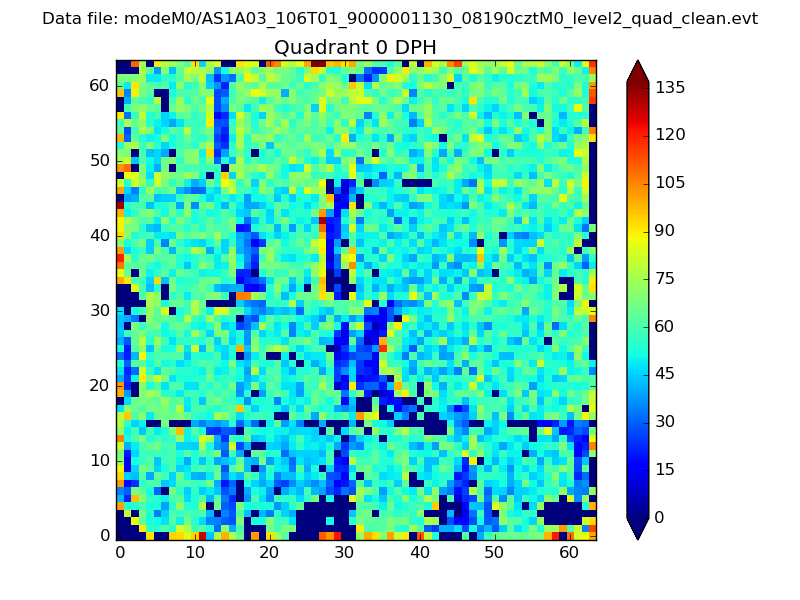 |
 |
Quadrant B |
|---|---|---|---|
| Quadrant D | 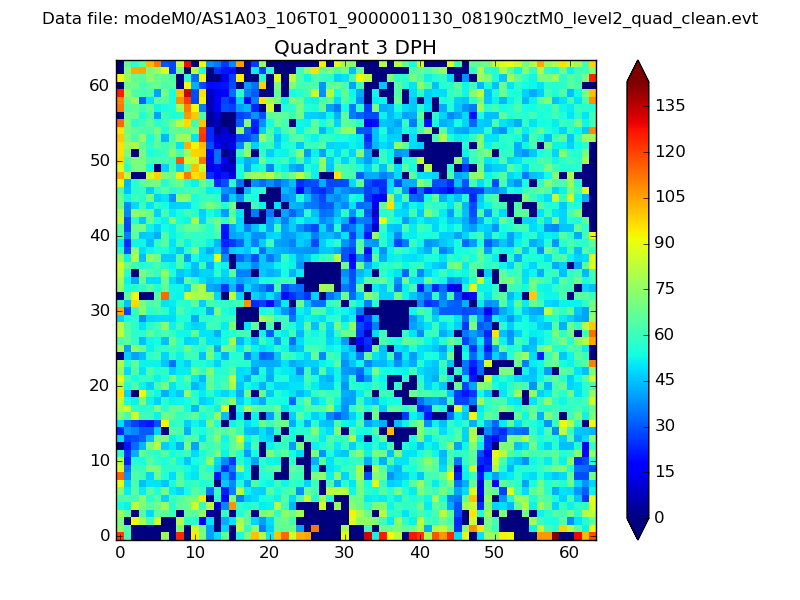 |
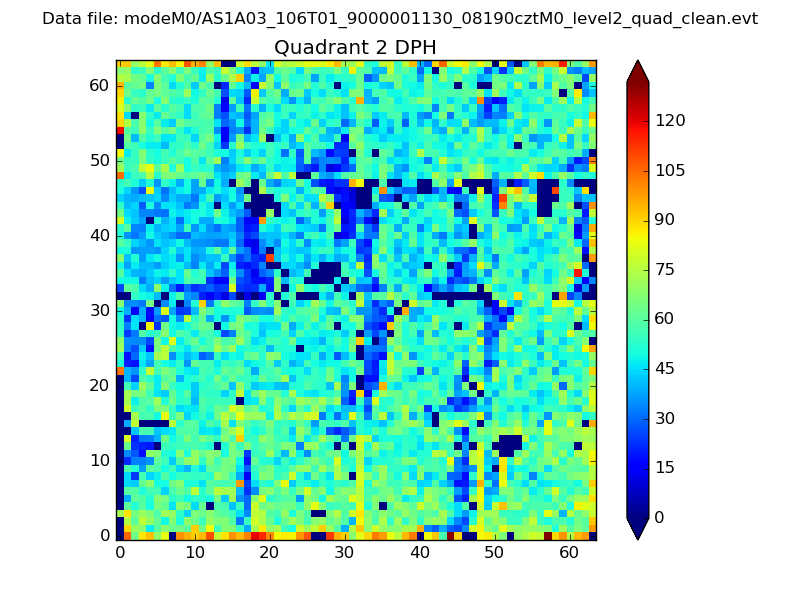 |
Quadrant C |
| Plot type | Count rate plots | Images |
|---|---|---|
| Comparison with Poisson distribution Blue bars denote a histogram of data divided into 1 sec bins. Red curve is a Poisson curve with rate = median count rate of data. |
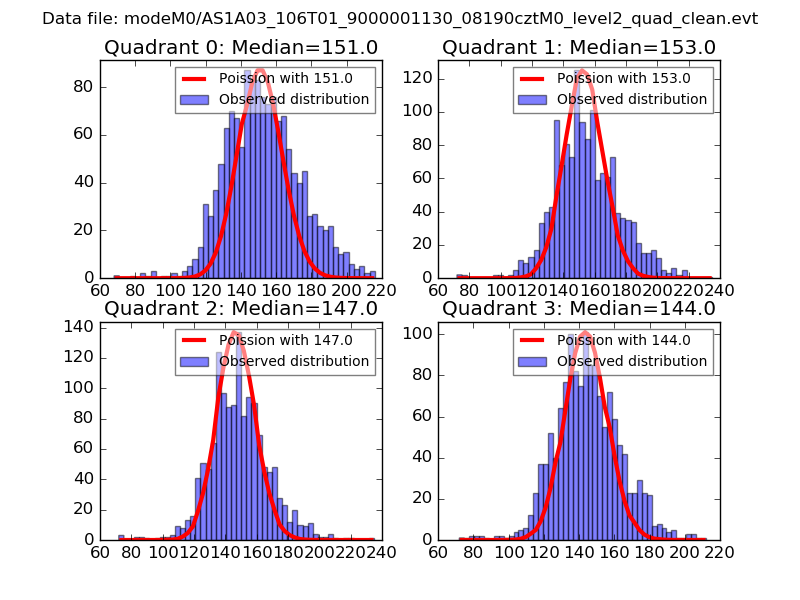 |
 |
| Quadrant-wise count rates Data is divided into 100 sec bins |
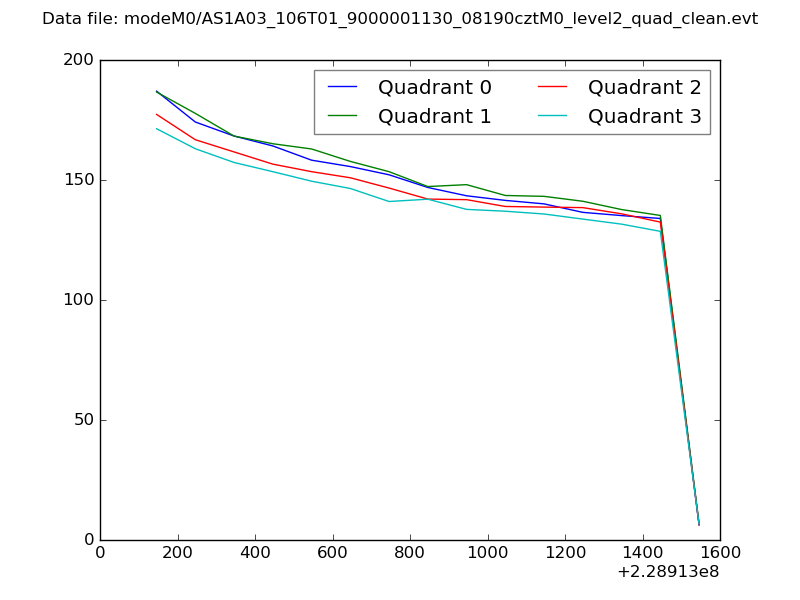 |
|
| Module-wise count rates for Quadrant A Data is divided into 100 sec bins |
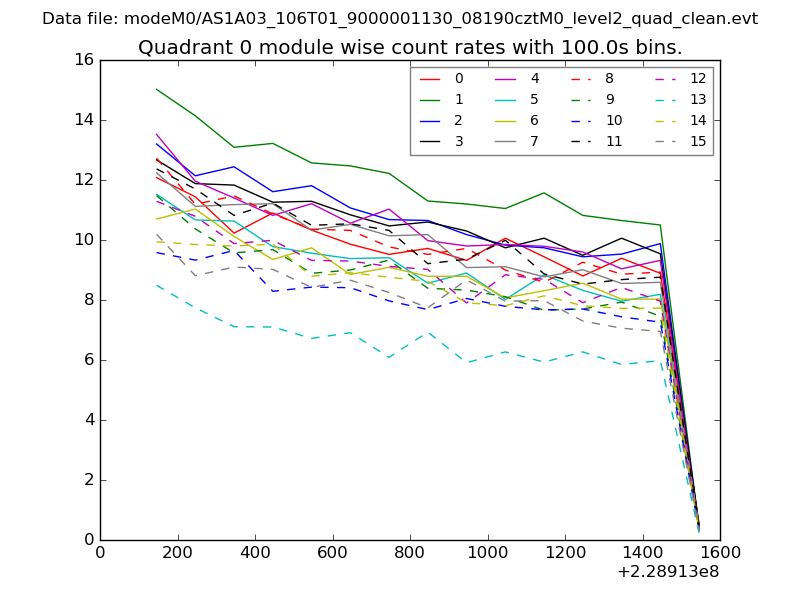 |
 |
| Module-wise count rates for Quadrant B Data is divided into 100 sec bins |
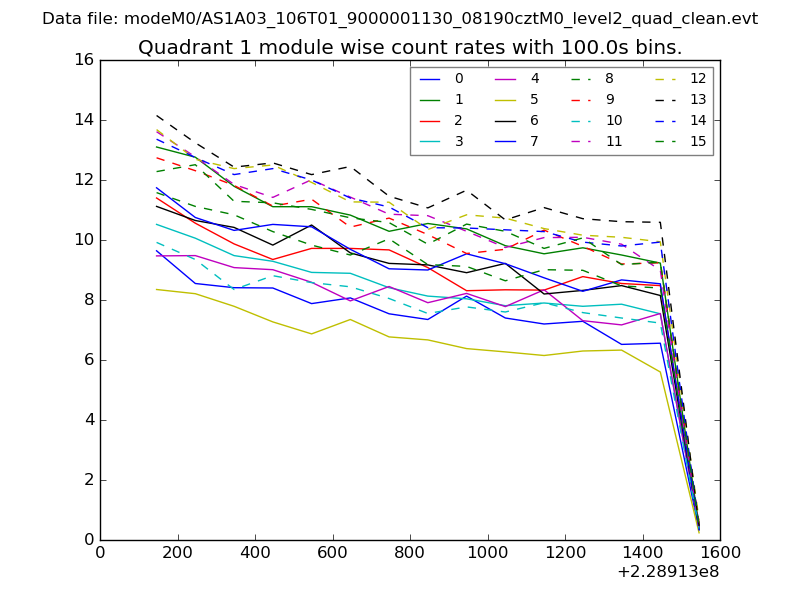 |
 |
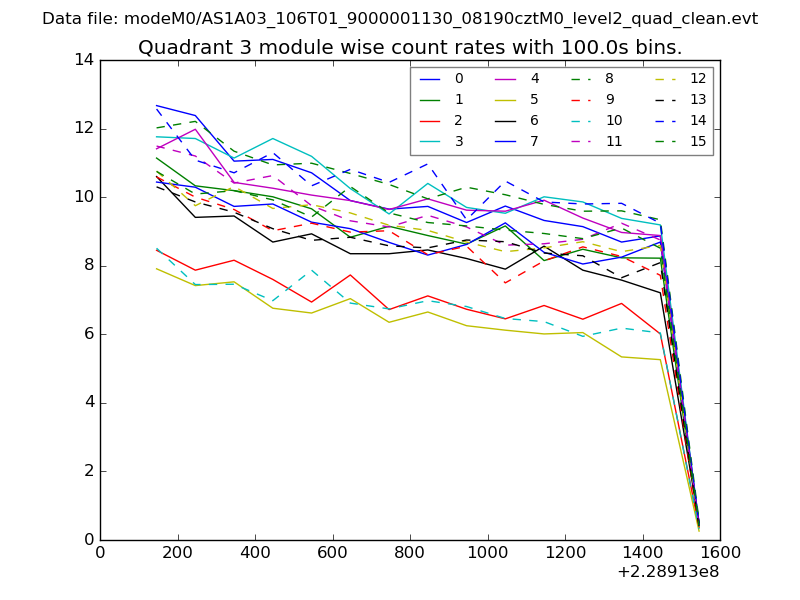
| Module-wise count rates for Quadrant C Data is divided into 100 sec bins |
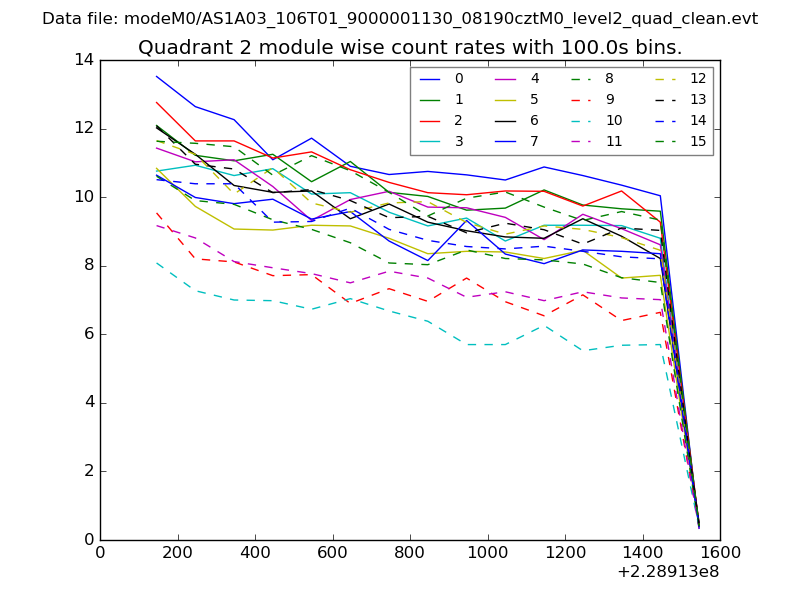 |
 |
| Module-wise count rates for Quadrant D Data is divided into 100 sec bins |
 |
 |
| Parameter | Plot |
|---|---|
| CZT HV Monitor | 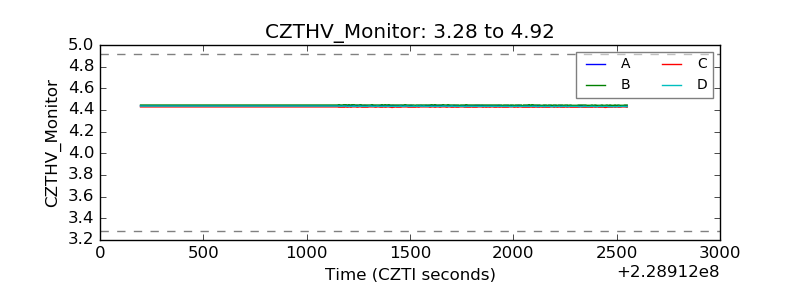 |
| D_VDD | 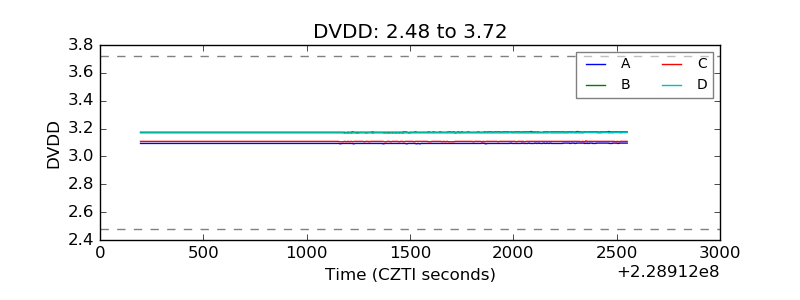 |
| Temperature 1 | 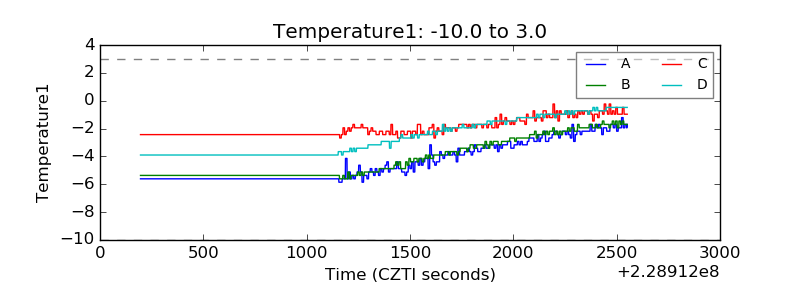 |
| Veto HV Monitor | 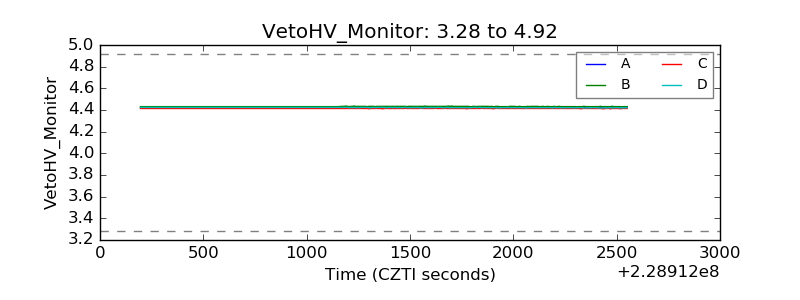 |
| Veto LLD | 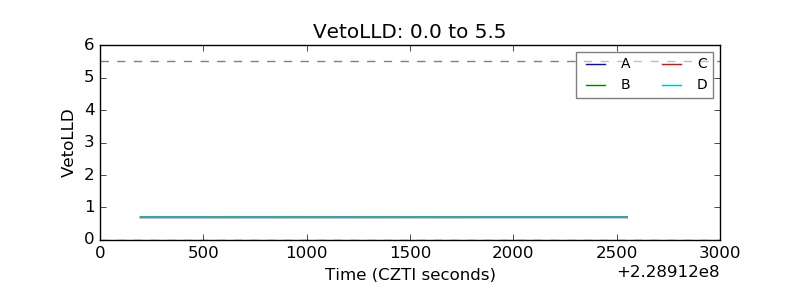 |
| Alpha Counter | 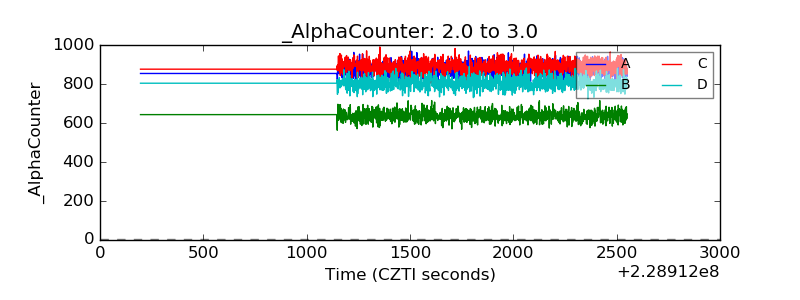 |
| _CPM_Rate | 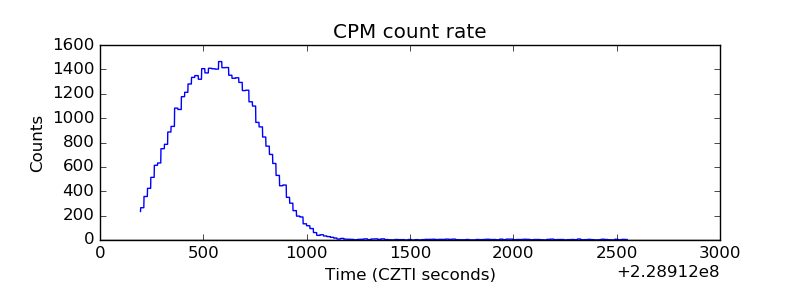 |
| CZT Counter | 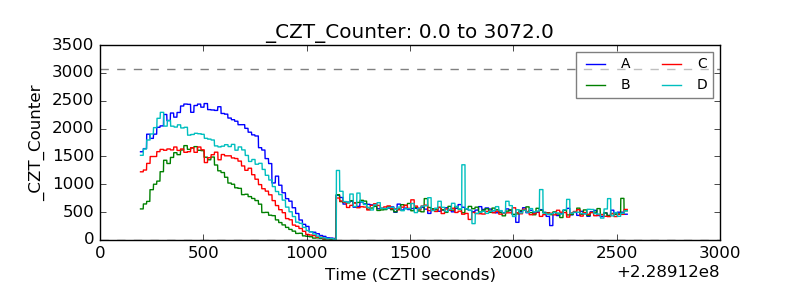 |
| +2.5 Volts monitor | 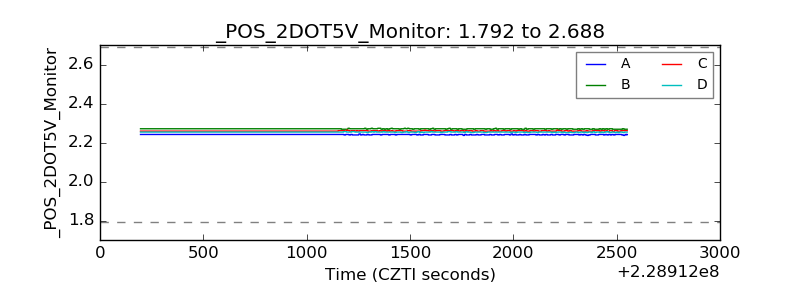 |
| +5 Volts monitor |  |
| _ROLL_ROT | 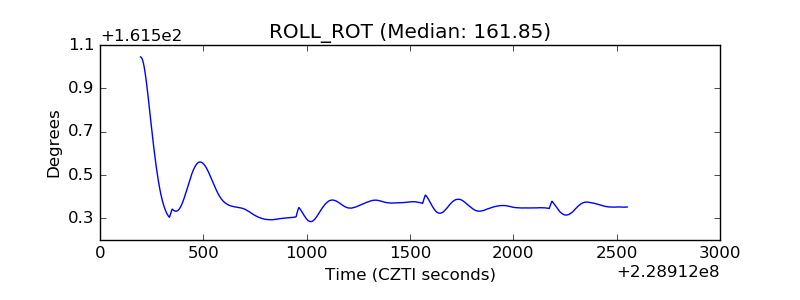 |
| _Roll_DEC | 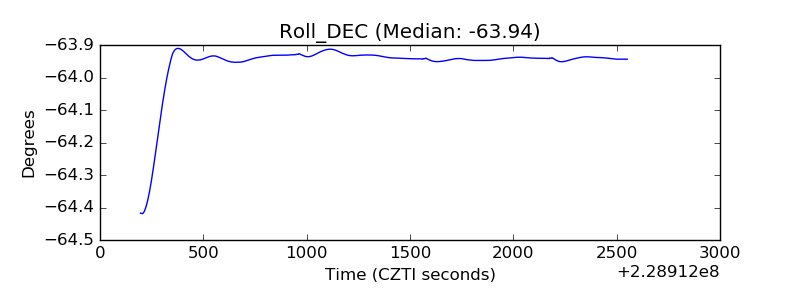 |
| _Roll_RA |  |
| Veto Counter | 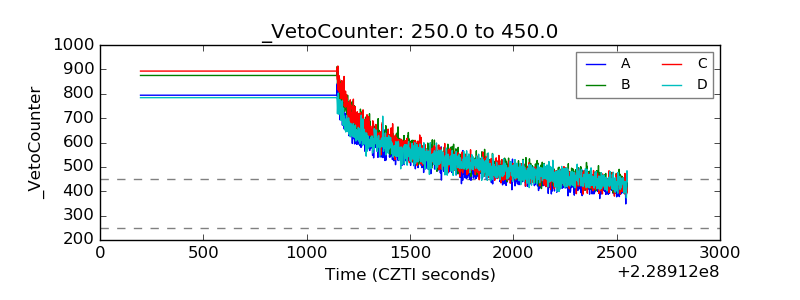 |