| Param | Original file | Final file |
|---|---|---|
| Filename | modeM0/AS1A03_106T01_9000001130_08191cztM0_level2.evt | modeM0/AS1A03_106T01_9000001130_08191cztM0_level2_quad_clean.evt |
| Size (bytes) | 404,933,760 | 99,002,880 |
| Size | 386.2 MB | 94.4 MB |
| Events in quadrant A | 2,782,049 | 661,000 |
| Events in quadrant B | 2,949,580 | 661,697 |
| Events in quadrant C | 2,639,286 | 646,597 |
| Events in quadrant D | 3,491,916 | 617,659 |
| Mode M0 | |||
|---|---|---|---|
| Quadrant | BADHDUFLAG | Total packets | Discarded packets |
| A | 0 | 12158 | 3 |
| B | 0 | 12576 | 1 |
| C | 0 | 12022 | 1 |
| D | 0 | 14303 | 1 |
| Mode M9 | |||
|---|---|---|---|
| Quadrant | BADHDUFLAG | Total packets | Discarded packets |
| A | 0 | 12 | 0 |
| B | 0 | 12 | 0 |
| C | 0 | 12 | 0 |
| D | 0 | 12 | 0 |
| Mode SS | |||
|---|---|---|---|
| Quadrant | BADHDUFLAG | Total packets | Discarded packets |
| A | 0 | 120 | 0 |
| B | 0 | 120 | 0 |
| C | 0 | 120 | 0 |
| D | 0 | 120 | 0 |
| Quadrant | Total seconds | Saturated seconds | Saturation percentage |
|---|---|---|---|
| A | 5887 | 84 | 1.426873% |
| B | 5887 | 88 | 1.494819% |
| C | 5887 | 66 | 1.121114% |
| D | 5887 | 248 | 4.212672% |
Noise dominated data is calculated using 1-second bins in cleaned event files. If a bin has >2000 counts, and if more than 50% of those come from <1% of pixels, then it is considered to be noise-dominated and hence unusable.
| Quadrant | # 1 sec bins | Bins with >0 counts | Bins with >2000 counts | High rate bins dominated by noise | Noise dominated (total time) | Noise dominated (detector-on time) | Marked lightcurve |
|---|---|---|---|---|---|---|---|
| A | 7104 | 5888 | 0 | 0 | 0.00% | 0.00% | 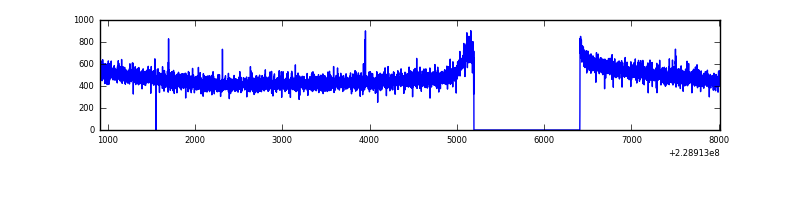 |
| B | 7104 | 5888 | 11 | 11 | 0.15% | 0.19% | 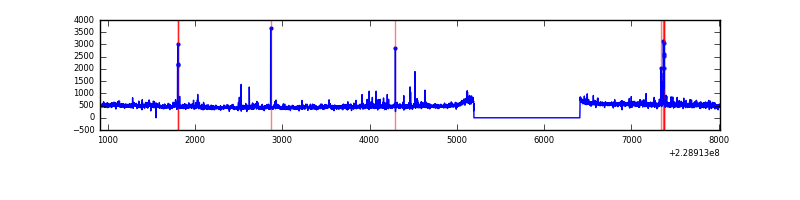 |
| C | 7104 | 5888 | 0 | 0 | 0.00% | 0.00% | 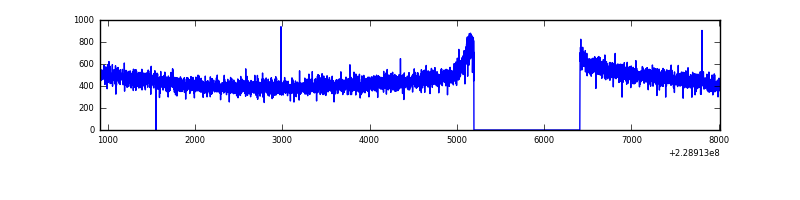 |
| D | 7104 | 5888 | 139 | 139 | 1.96% | 2.36% | 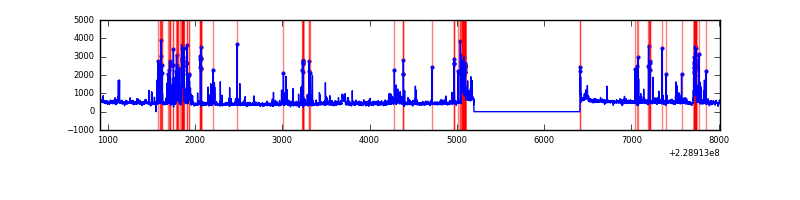 |
Top three noisy pixels from each quadrant. If the there are fewer than three noisy pixels in the level2.evt file, extra rows are filled as -1
| Pixel properties | Quadrant properties | ||||||
|---|---|---|---|---|---|---|---|
| Quadrant | DetID | PixID | Counts | Sigma | Mean | Median | Sigma |
| A | 13 | 14 | 18071 | 120.92 | 715 | 699 | 143.7 |
| A | 8 | 15 | 8781 | 56.25 | 715 | 699 | 143.7 |
| A | 0 | 226 | 6855 | 42.85 | 715 | 699 | 143.7 |
| B | 0 | 214 | 90114 | 669.45 | 707 | 690 | 133.6 |
| B | 10 | 16 | 48933 | 361.16 | 707 | 690 | 133.6 |
| B | 4 | 81 | 35662 | 261.81 | 707 | 690 | 133.6 |
| C | 13 | 61 | 5236 | 29.28 | 676 | 678 | 155.6 |
| C | 3 | 202 | 1774 | 7.04 | 676 | 678 | 155.6 |
| C | 7 | 247 | 1517 | 5.39 | 676 | 678 | 155.6 |
| D | 12 | 233 | 417863 | 2528.09 | 678 | 658 | 165.0 |
| D | 13 | 105 | 221427 | 1337.77 | 678 | 658 | 165.0 |
| D | 2 | 14 | 98654 | 593.82 | 678 | 658 | 165.0 |
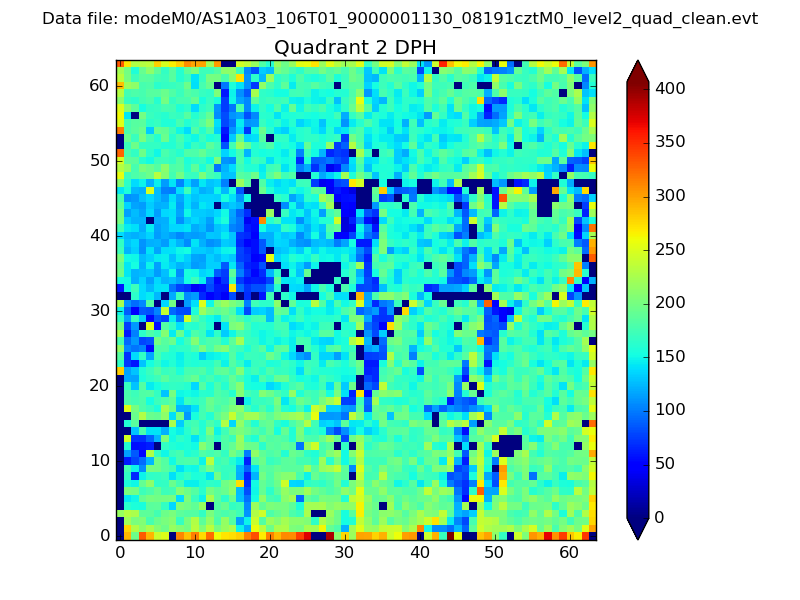
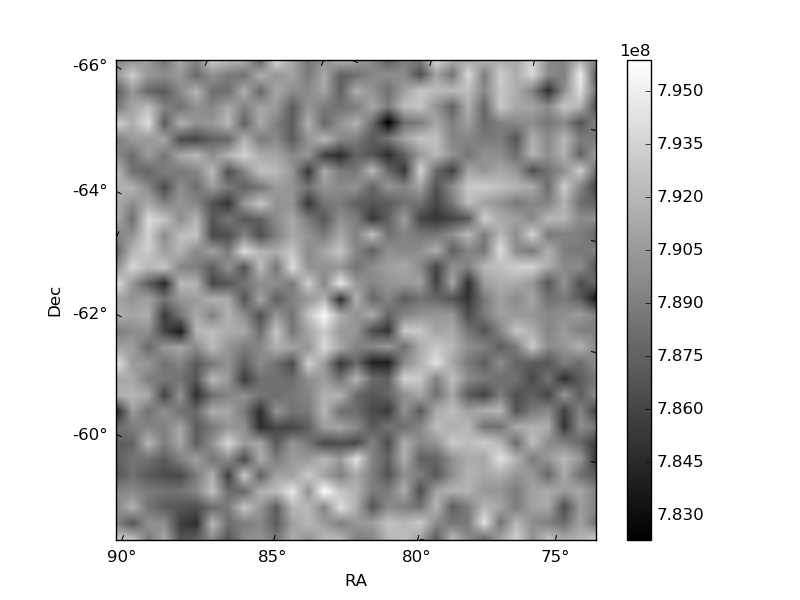
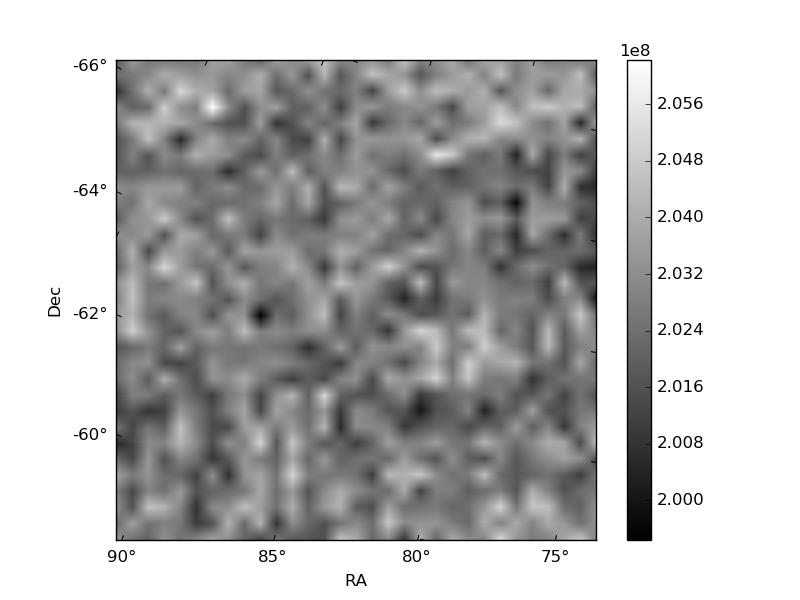
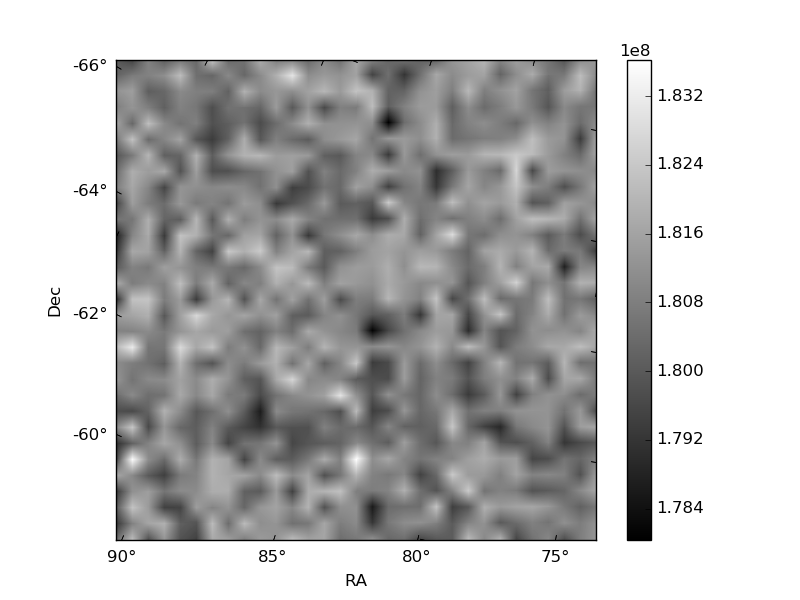
Histogram calculated using DETX and DETY for each event in the final _common_clean file
| Quadrant A | 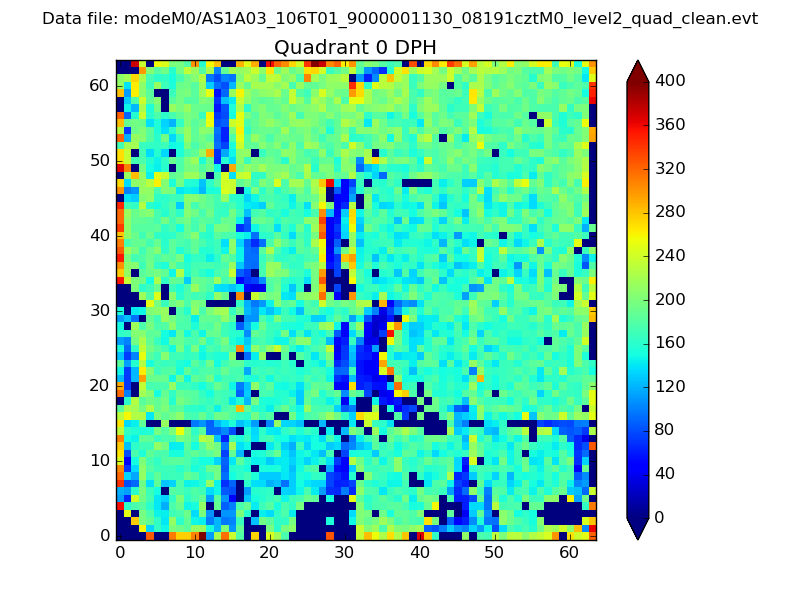 |
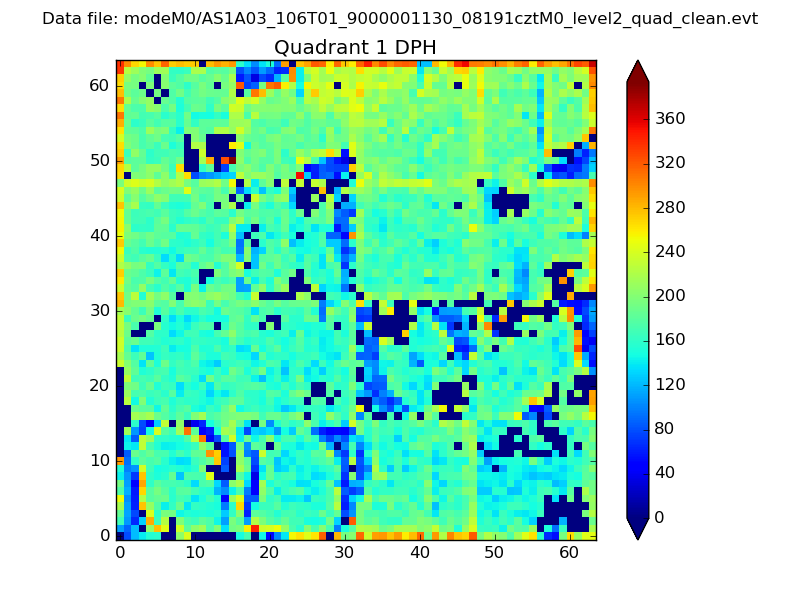 |
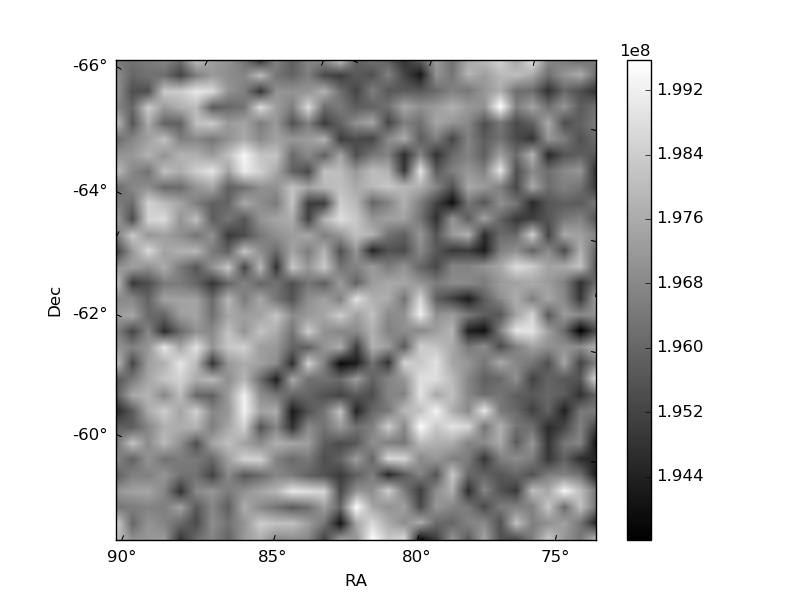
Quadrant B |
|---|---|---|---|
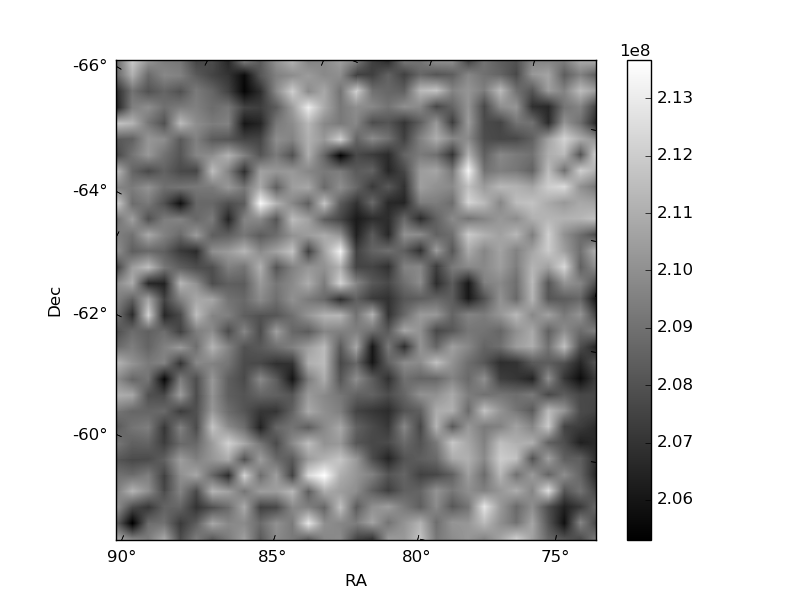
| Quadrant D | 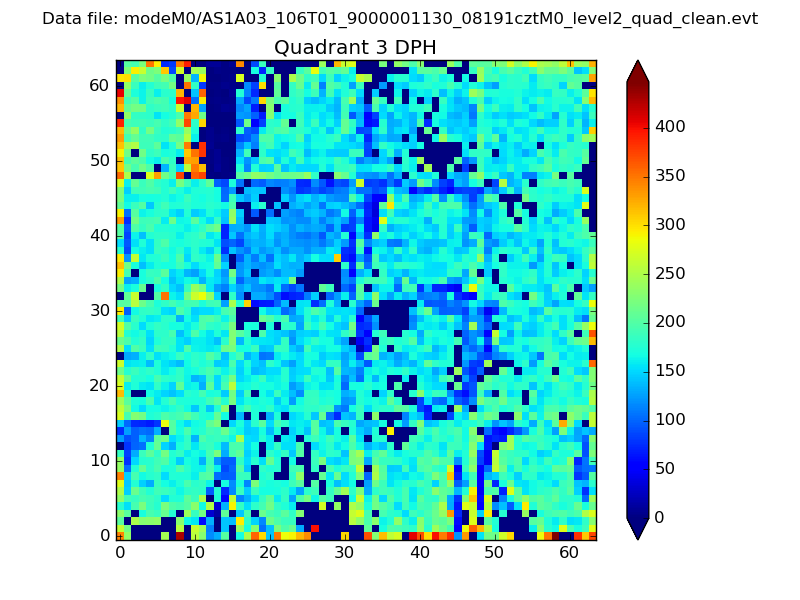 |
 |
Quadrant C |
| Plot type | Count rate plots | Images |
|---|---|---|
| Comparison with Poisson distribution Blue bars denote a histogram of data divided into 1 sec bins. Red curve is a Poisson curve with rate = median count rate of data. |
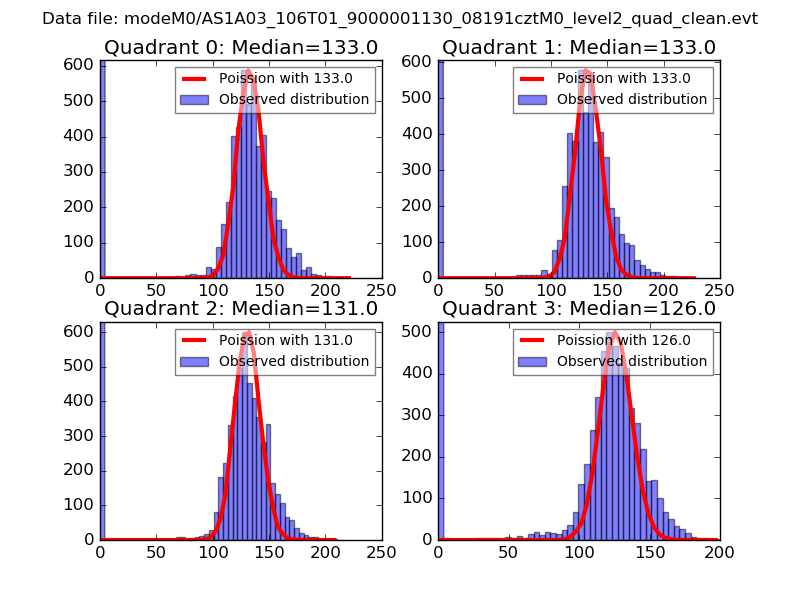 |
 |
| Quadrant-wise count rates Data is divided into 100 sec bins |
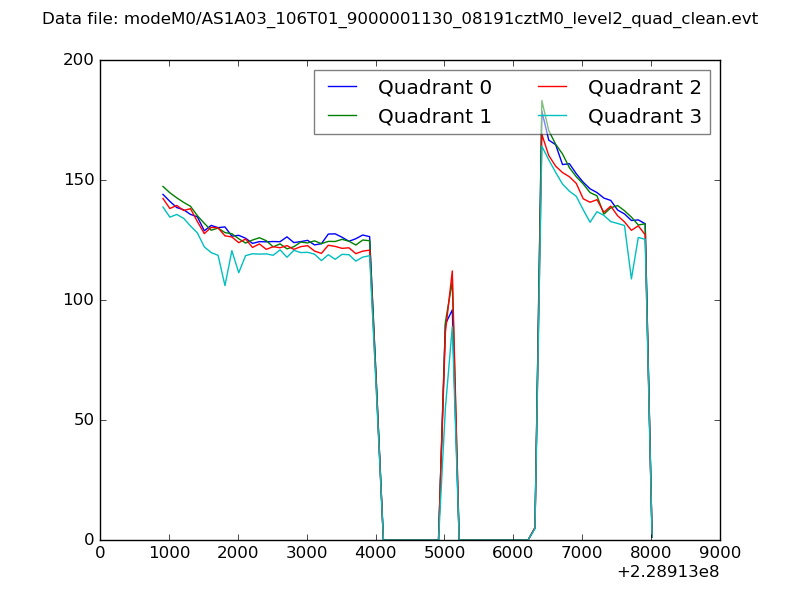 |
|
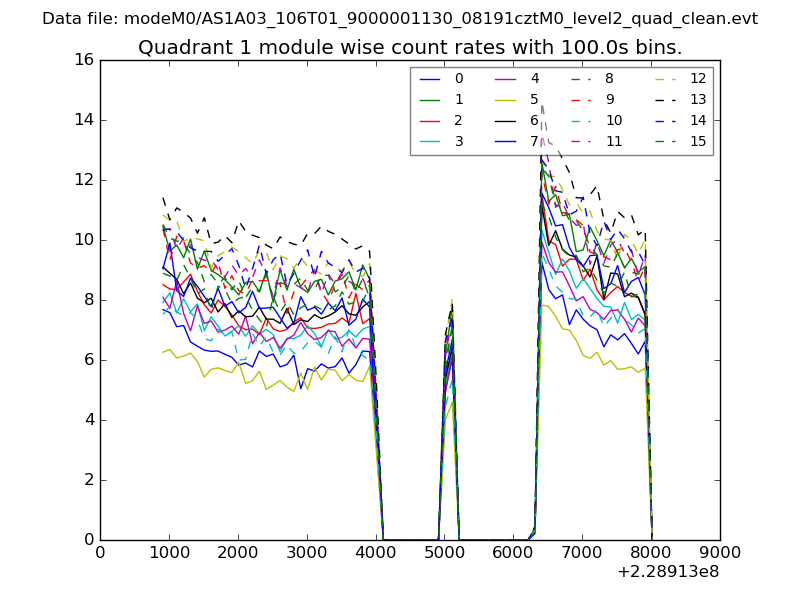
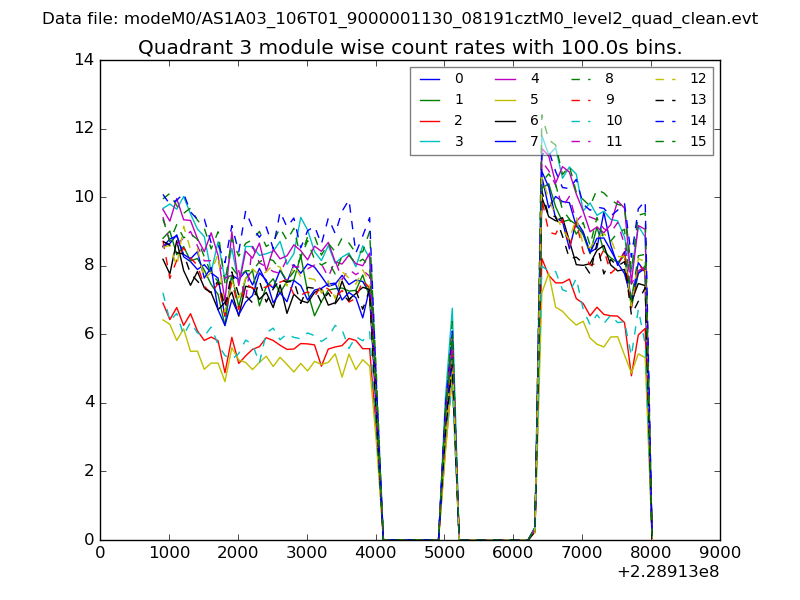
| Module-wise count rates for Quadrant A Data is divided into 100 sec bins |
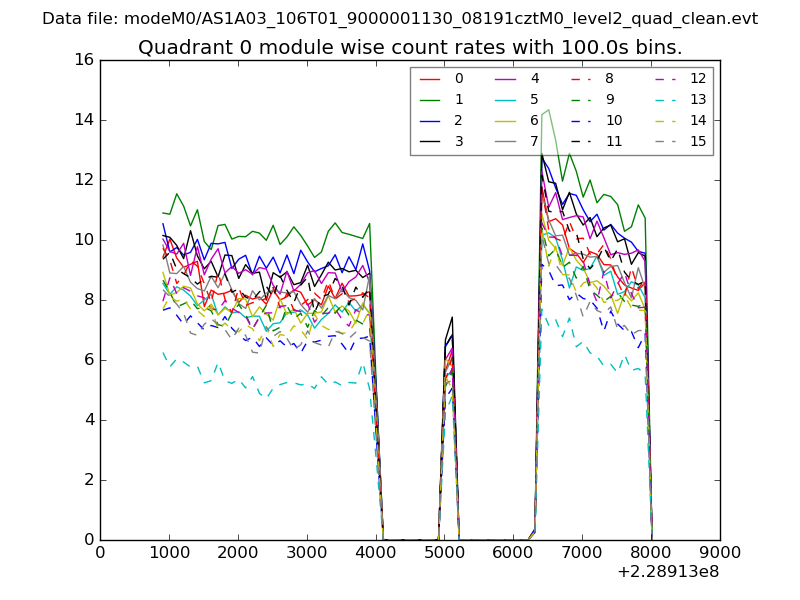 |
 |
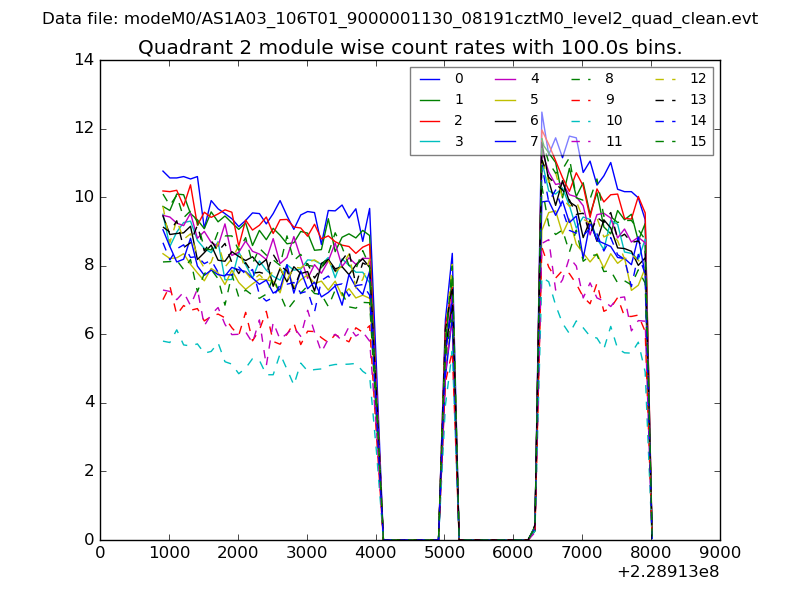
| Module-wise count rates for Quadrant B Data is divided into 100 sec bins |
 |
 |
| Module-wise count rates for Quadrant C Data is divided into 100 sec bins |
 |
 |
| Module-wise count rates for Quadrant D Data is divided into 100 sec bins |
 |
 |
| Parameter | Plot |
|---|---|
| CZT HV Monitor | 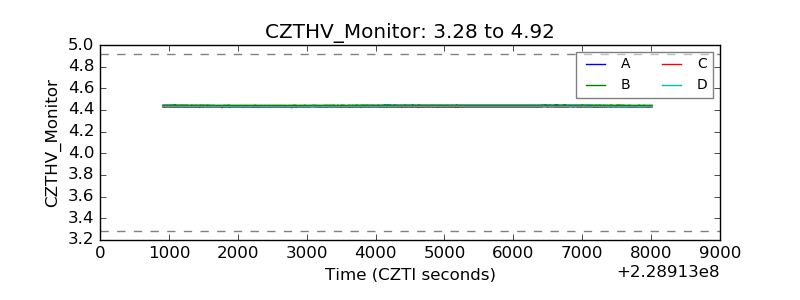 |
| D_VDD | 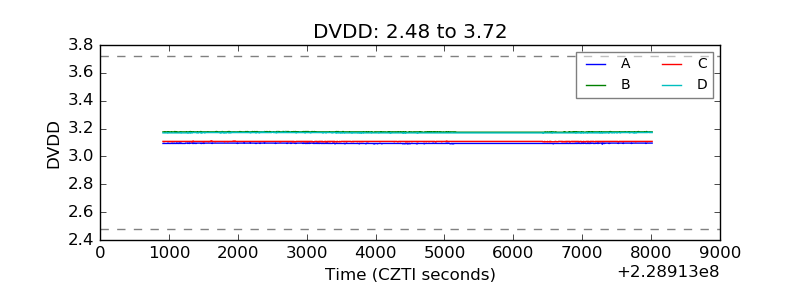 |
| Temperature 1 | 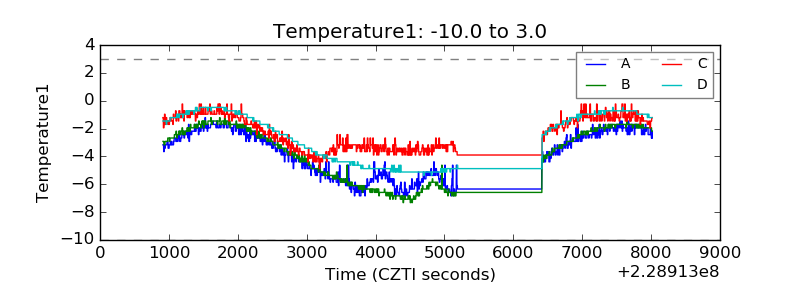 |
| Veto HV Monitor | 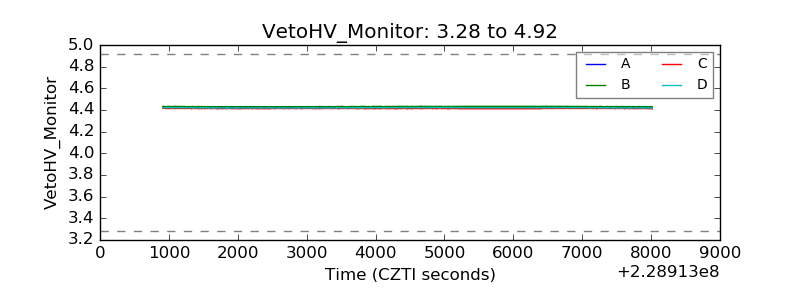 |
| Veto LLD | 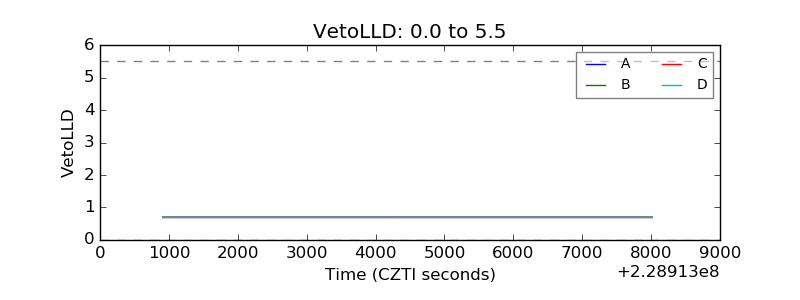 |
| Alpha Counter | 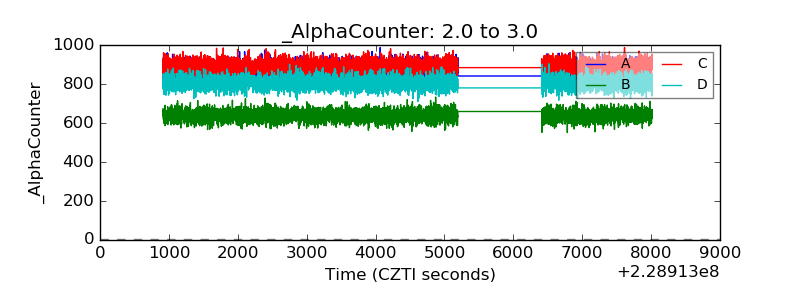 |
| _CPM_Rate | 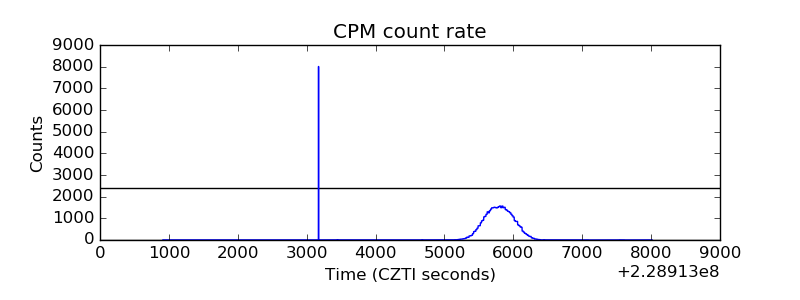 |
| CZT Counter | 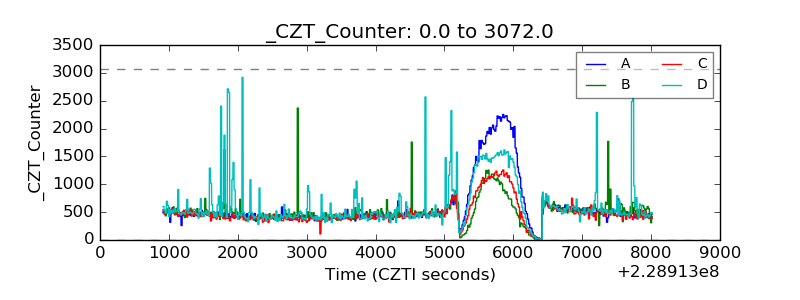 |
| +2.5 Volts monitor | 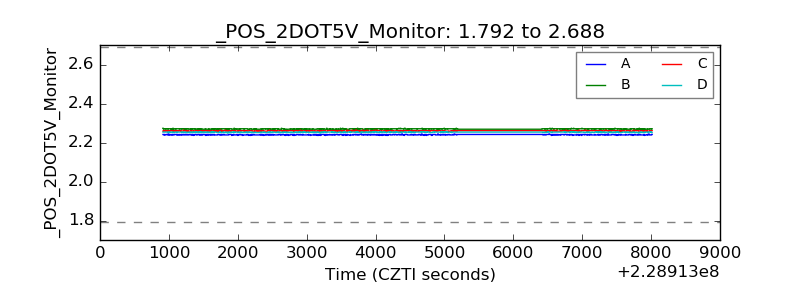 |
| +5 Volts monitor |  |
| _ROLL_ROT | 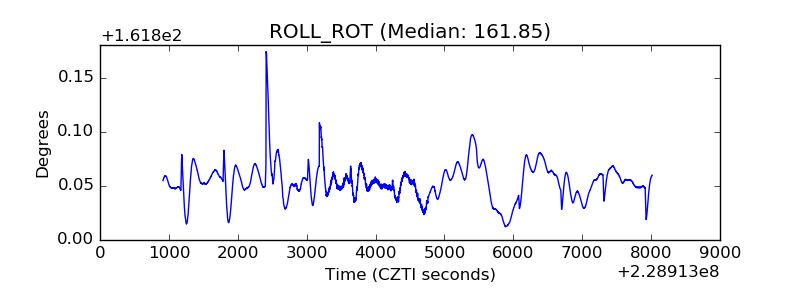 |
| _Roll_DEC | 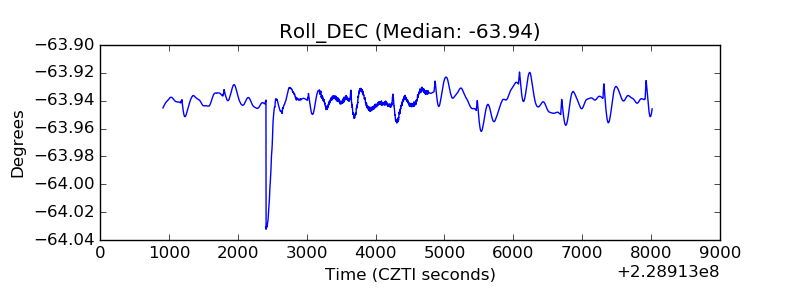 |
| _Roll_RA | 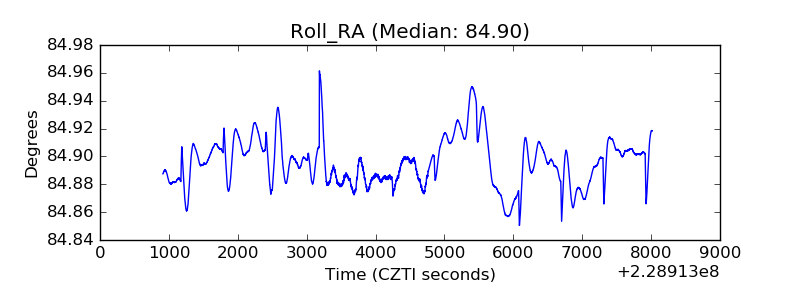 |
| Veto Counter | 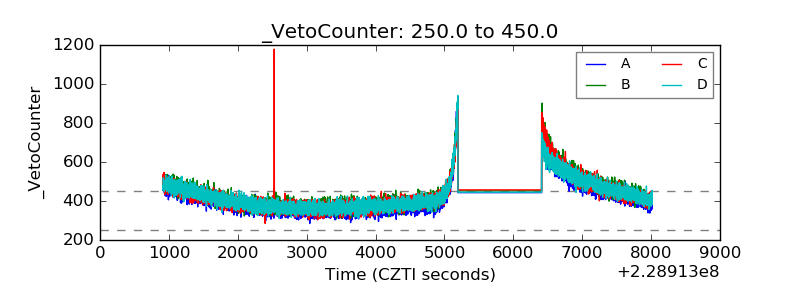 |