| Param | Original file | Final file |
|---|---|---|
| Filename | modeM0/AS1A03_106T01_9000001130_08194cztM0_level2.evt | modeM0/AS1A03_106T01_9000001130_08194cztM0_level2_quad_clean.evt |
| Size (bytes) | 381,012,480 | 99,040,320 |
| Size | 363.4 MB | 94.5 MB |
| Events in quadrant A | 2,761,211 | 651,843 |
| Events in quadrant B | 2,838,790 | 659,593 |
| Events in quadrant C | 2,641,195 | 638,214 |
| Events in quadrant D | 2,877,646 | 619,139 |
| Mode M0 | |||
|---|---|---|---|
| Quadrant | BADHDUFLAG | Total packets | Discarded packets |
| A | 0 | 12589 | 2 |
| B | 0 | 12712 | 1 |
| C | 0 | 12523 | 1 |
| D | 0 | 13190 | 1 |
| Mode M9 | |||
|---|---|---|---|
| Quadrant | BADHDUFLAG | Total packets | Discarded packets |
| A | 0 | 10 | 0 |
| B | 0 | 10 | 0 |
| C | 0 | 10 | 0 |
| D | 0 | 10 | 0 |
| Mode SS | |||
|---|---|---|---|
| Quadrant | BADHDUFLAG | Total packets | Discarded packets |
| A | 0 | 126 | 0 |
| B | 0 | 126 | 0 |
| C | 0 | 126 | 0 |
| D | 0 | 126 | 0 |
| Quadrant | Total seconds | Saturated seconds | Saturation percentage |
|---|---|---|---|
| A | 6167 | 22 | 0.356737% |
| B | 6167 | 27 | 0.437814% |
| C | 6167 | 9 | 0.145938% |
| D | 6167 | 57 | 0.924274% |
Noise dominated data is calculated using 1-second bins in cleaned event files. If a bin has >2000 counts, and if more than 50% of those come from <1% of pixels, then it is considered to be noise-dominated and hence unusable.
| Quadrant | # 1 sec bins | Bins with >0 counts | Bins with >2000 counts | High rate bins dominated by noise | Noise dominated (total time) | Noise dominated (detector-on time) | Marked lightcurve |
|---|---|---|---|---|---|---|---|
| A | 7202 | 6168 | 0 | 0 | 0.00% | 0.00% | 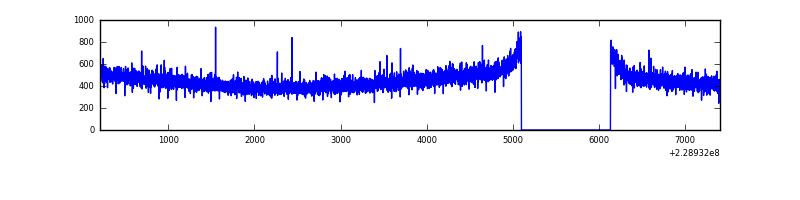 |
| B | 7202 | 6168 | 1 | 1 | 0.01% | 0.02% | 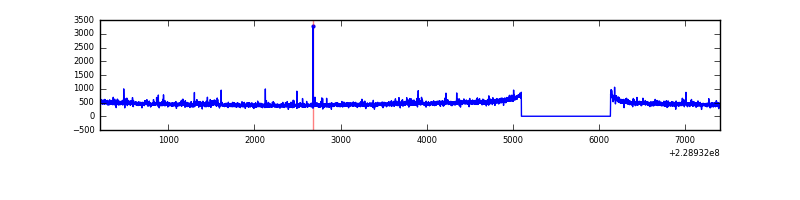 |
| C | 7202 | 6168 | 0 | 0 | 0.00% | 0.00% | 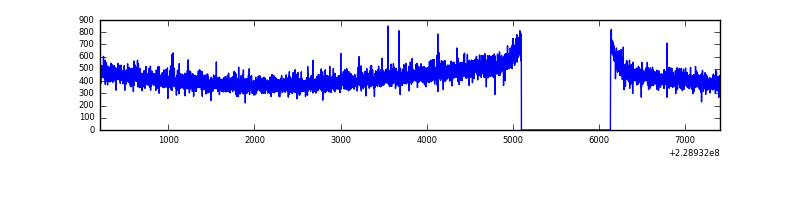 |
| D | 7202 | 6168 | 51 | 51 | 0.71% | 0.83% | 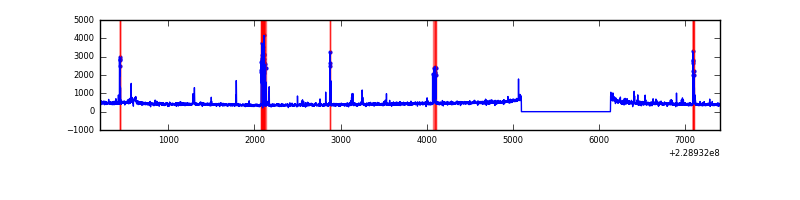 |
Top three noisy pixels from each quadrant. If the there are fewer than three noisy pixels in the level2.evt file, extra rows are filled as -1
| Pixel properties | Quadrant properties | ||||||
|---|---|---|---|---|---|---|---|
| Quadrant | DetID | PixID | Counts | Sigma | Mean | Median | Sigma |
| A | 13 | 14 | 16253 | 107.41 | 712 | 696 | 144.8 |
| A | 0 | 226 | 6869 | 42.62 | 712 | 696 | 144.8 |
| A | 12 | 194 | 6428 | 39.58 | 712 | 696 | 144.8 |
| B | 4 | 81 | 19676 | 140.42 | 713 | 697 | 135.2 |
| B | 0 | 214 | 14888 | 104.99 | 713 | 697 | 135.2 |
| B | 15 | 204 | 13459 | 94.42 | 713 | 697 | 135.2 |
| C | 13 | 61 | 5230 | 29.19 | 677 | 677 | 156.0 |
| C | 3 | 202 | 1712 | 6.64 | 677 | 677 | 156.0 |
| C | 7 | 247 | 1484 | 5.17 | 677 | 677 | 156.0 |
| D | 1 | 52 | 114774 | 685.25 | 678 | 655 | 166.5 |
| D | 2 | 14 | 56483 | 335.23 | 678 | 655 | 166.5 |
| D | 1 | 7 | 27907 | 163.64 | 678 | 655 | 166.5 |
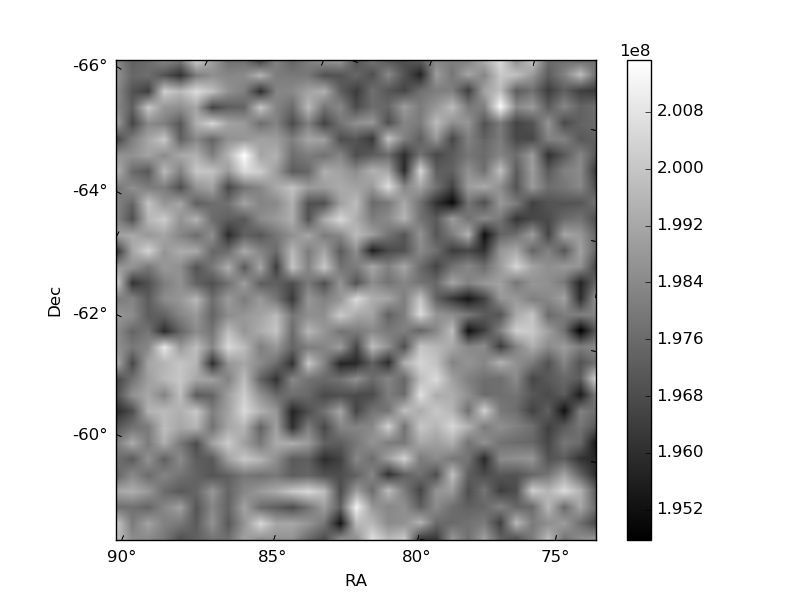
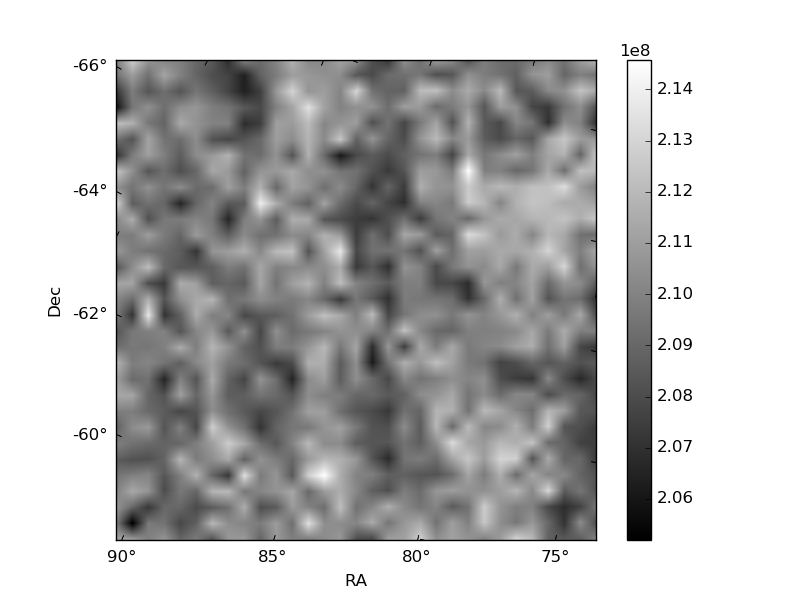
Histogram calculated using DETX and DETY for each event in the final _common_clean file
| Quadrant A | 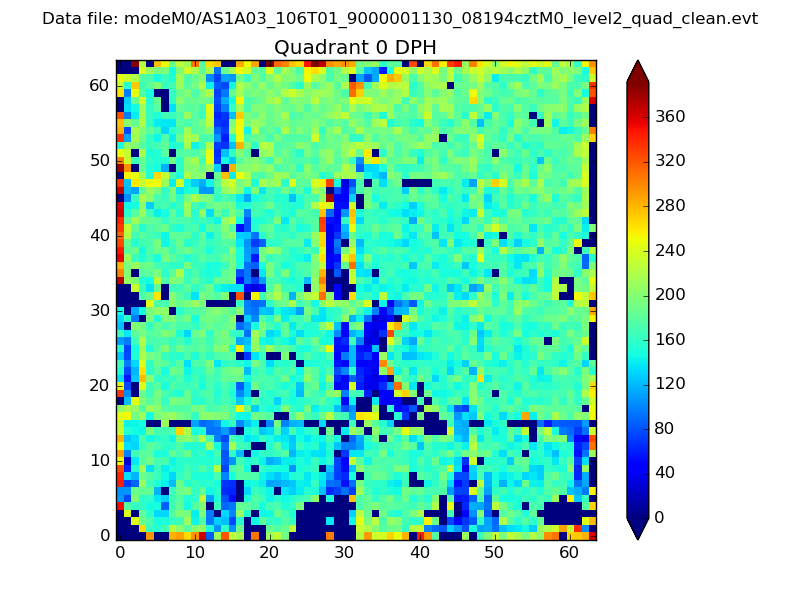 |
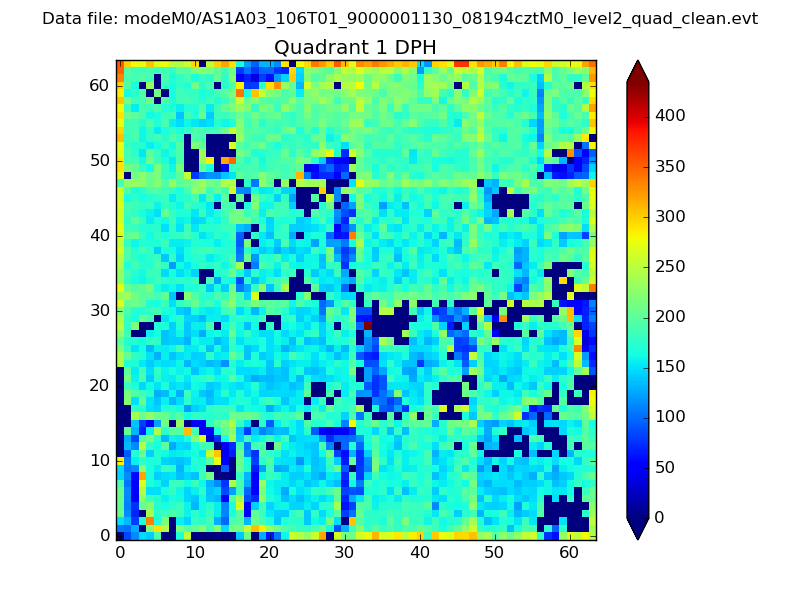 |
Quadrant B |
|---|---|---|---|
| Quadrant D | 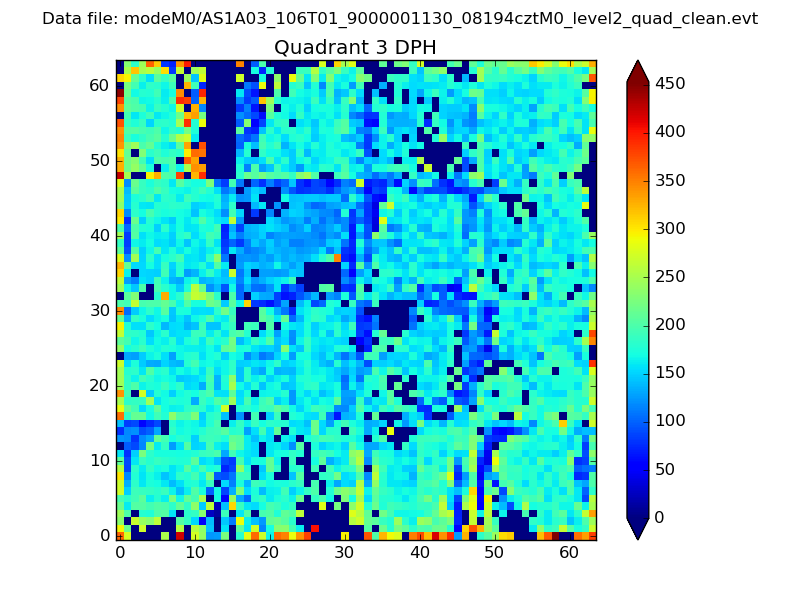 |
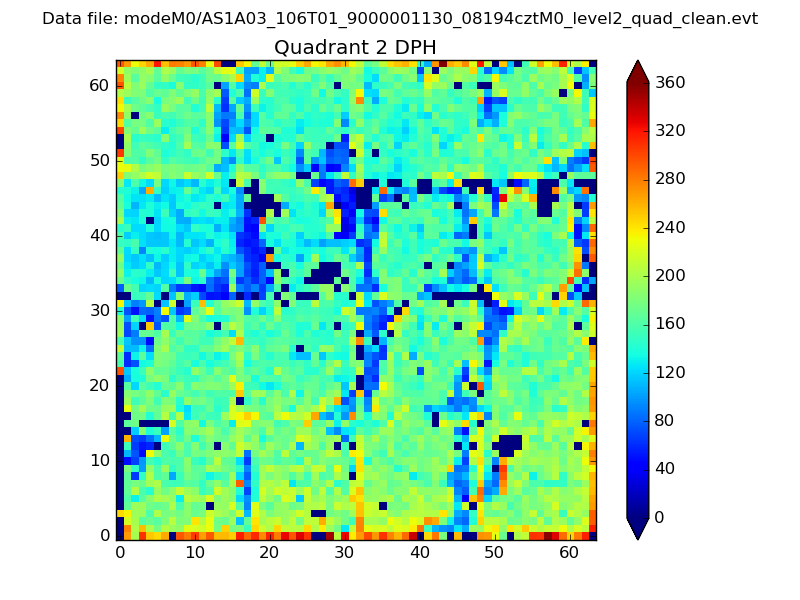 |
Quadrant C |
| Plot type | Count rate plots | Images |
|---|---|---|
| Comparison with Poisson distribution Blue bars denote a histogram of data divided into 1 sec bins. Red curve is a Poisson curve with rate = median count rate of data. |
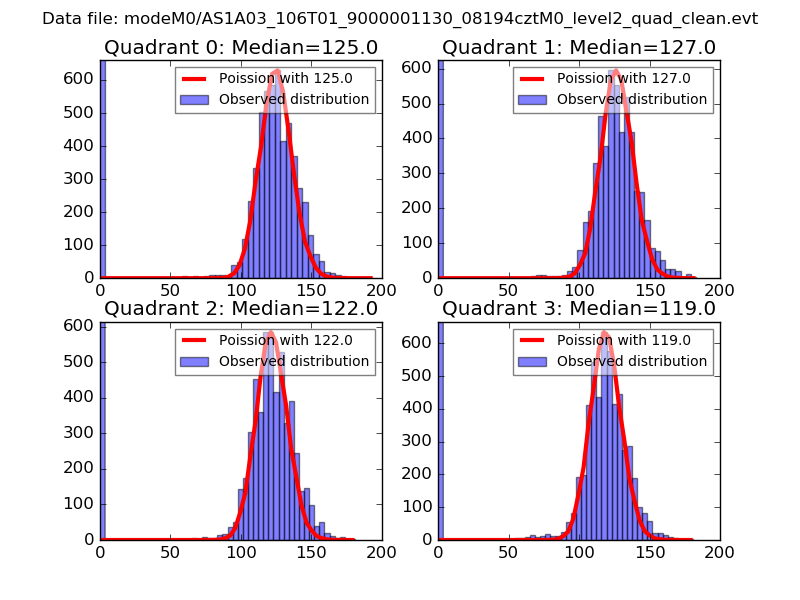 |
 |
| Quadrant-wise count rates Data is divided into 100 sec bins |
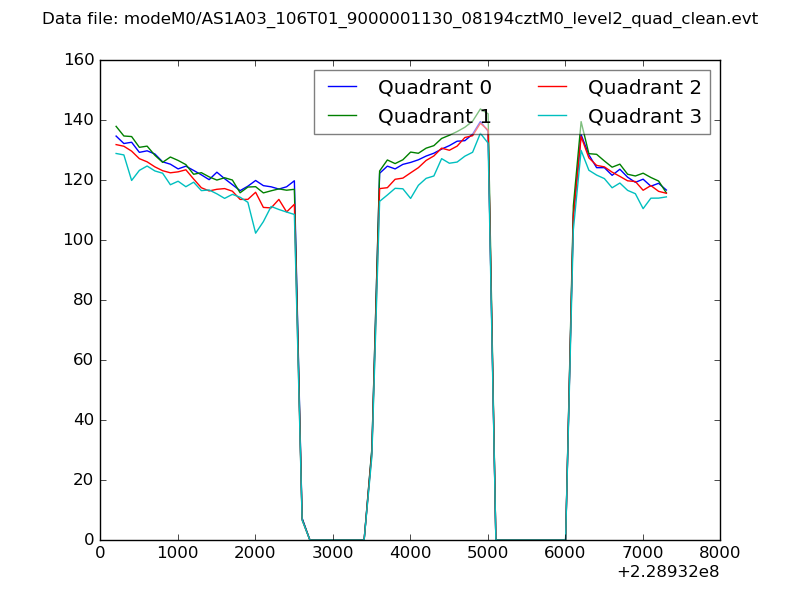 |
|
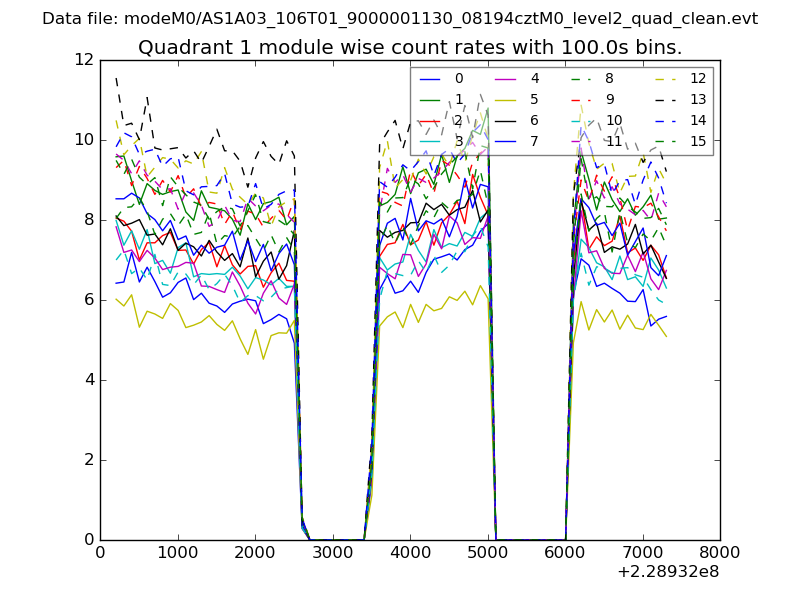
| Module-wise count rates for Quadrant A Data is divided into 100 sec bins |
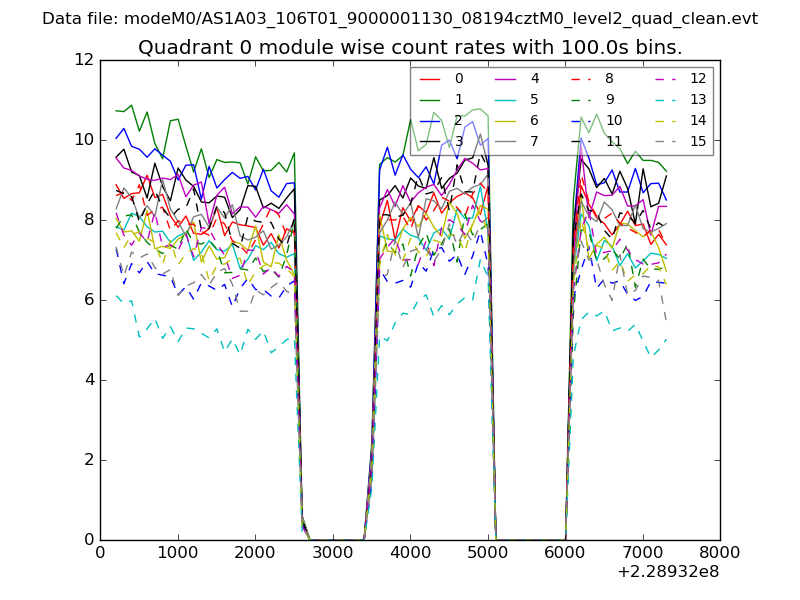 |
 |
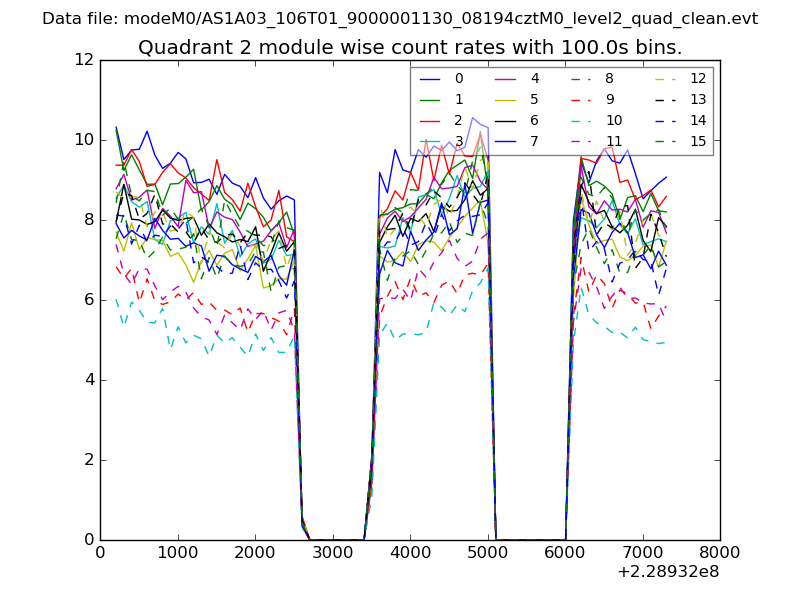
| Module-wise count rates for Quadrant B Data is divided into 100 sec bins |
 |
 |
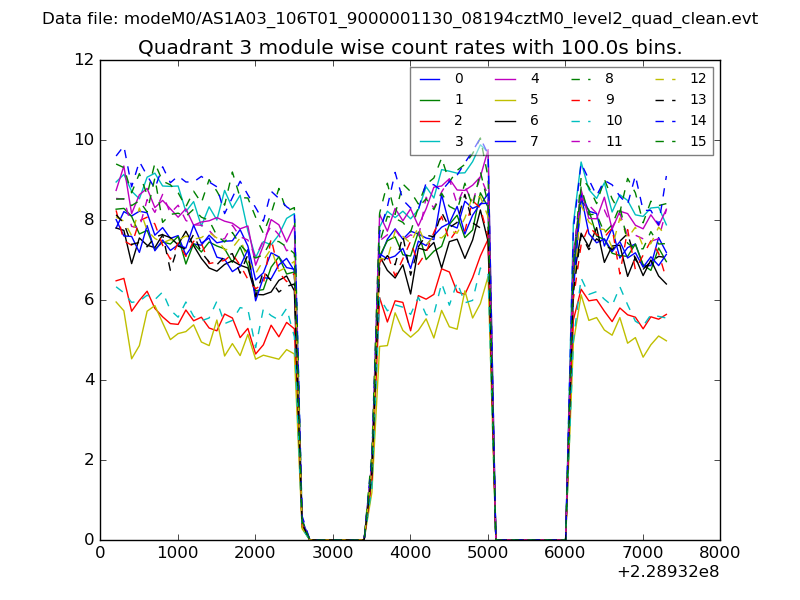
| Module-wise count rates for Quadrant C Data is divided into 100 sec bins |
 |
 |
| Module-wise count rates for Quadrant D Data is divided into 100 sec bins |
 |
 |
| Parameter | Plot |
|---|---|
| CZT HV Monitor | 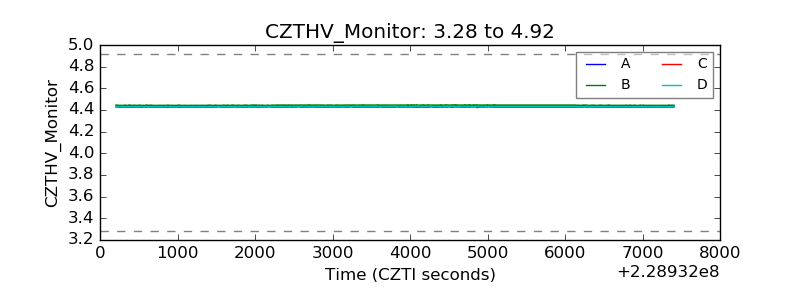 |
| D_VDD | 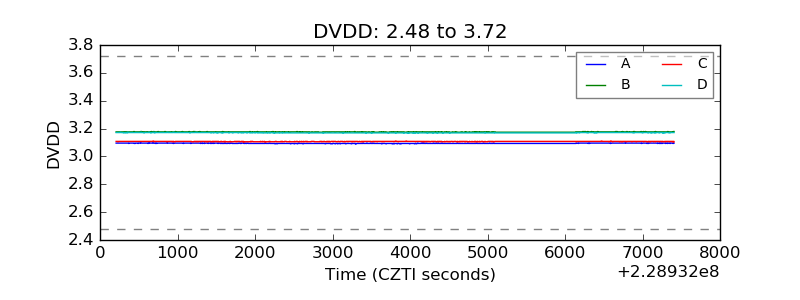 |
| Temperature 1 | 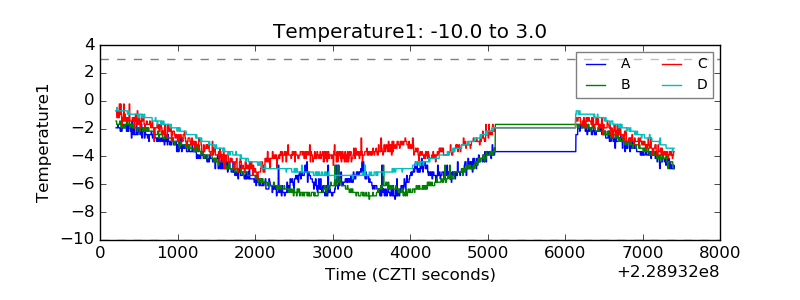 |
| Veto HV Monitor |  |
| Veto LLD | 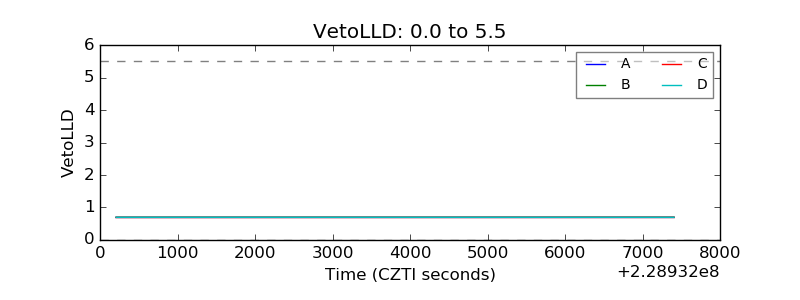 |
| Alpha Counter | 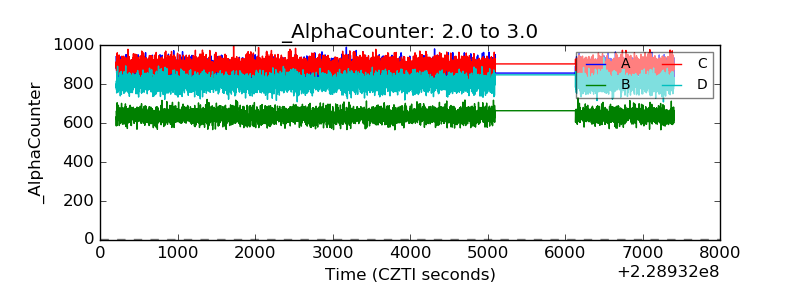 |
| _CPM_Rate | 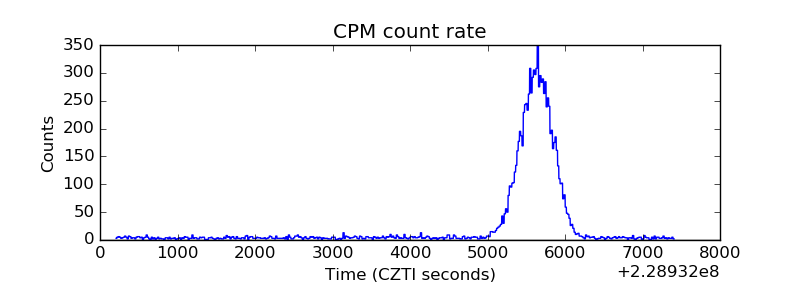 |
| CZT Counter | 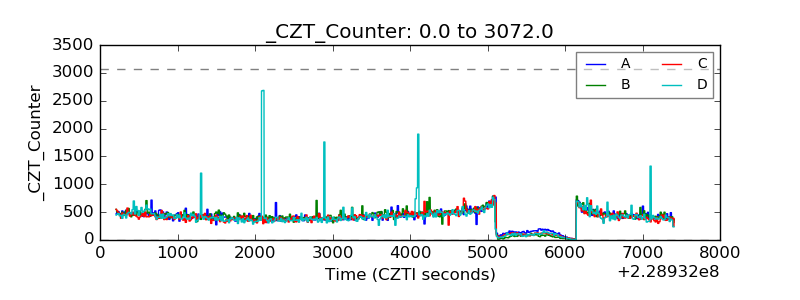 |
| +2.5 Volts monitor |  |
| +5 Volts monitor |  |
| _ROLL_ROT | 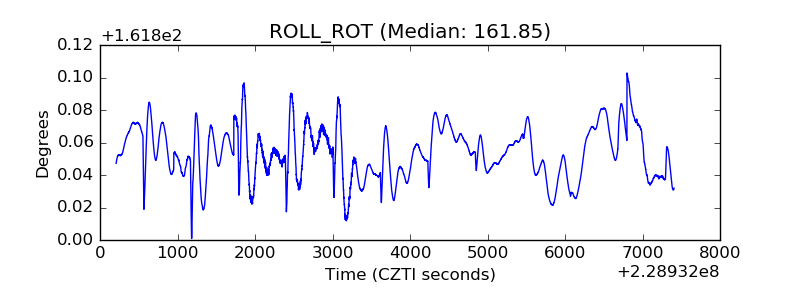 |
| _Roll_DEC | 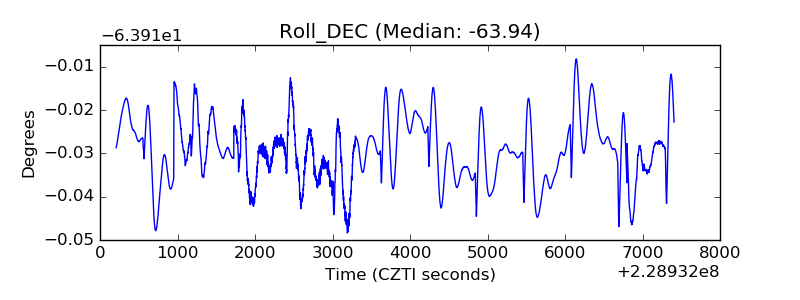 |
| _Roll_RA | 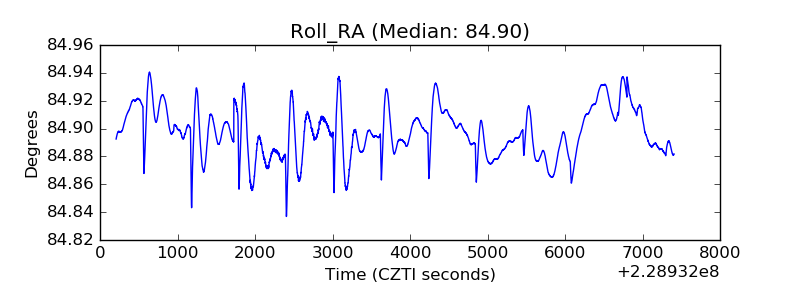 |
| Veto Counter | 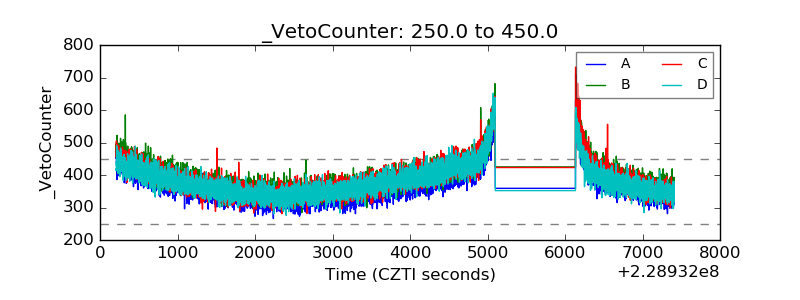 |