| Param | Original file | Final file |
|---|---|---|
| Filename | modeM0/AS1A03_106T01_9000001130_08195cztM0_level2.evt | modeM0/AS1A03_106T01_9000001130_08195cztM0_level2_quad_clean.evt |
| Size (bytes) | 438,137,280 | 112,944,960 |
| Size | 417.8 MB | 107.7 MB |
| Events in quadrant A | 3,110,004 | 742,123 |
| Events in quadrant B | 3,254,114 | 751,255 |
| Events in quadrant C | 2,990,680 | 730,989 |
| Events in quadrant D | 3,435,984 | 706,731 |
| Mode M0 | |||
|---|---|---|---|
| Quadrant | BADHDUFLAG | Total packets | Discarded packets |
| A | 0 | 14318 | 3 |
| B | 0 | 14490 | 2 |
| C | 0 | 14224 | 2 |
| D | 0 | 15461 | 2 |
| Mode M9 | |||
|---|---|---|---|
| Quadrant | BADHDUFLAG | Total packets | Discarded packets |
| A | 0 | 12 | 0 |
| B | 0 | 12 | 0 |
| C | 0 | 12 | 0 |
| D | 0 | 13 | 0 |
| Mode SS | |||
|---|---|---|---|
| Quadrant | BADHDUFLAG | Total packets | Discarded packets |
| A | 0 | 144 | 0 |
| B | 0 | 144 | 0 |
| C | 0 | 144 | 0 |
| D | 0 | 144 | 0 |
| Quadrant | Total seconds | Saturated seconds | Saturation percentage |
|---|---|---|---|
| A | 7026 | 32 | 0.455451% |
| B | 7026 | 38 | 0.540848% |
| C | 7026 | 11 | 0.156561% |
| D | 7026 | 65 | 0.925135% |
Noise dominated data is calculated using 1-second bins in cleaned event files. If a bin has >2000 counts, and if more than 50% of those come from <1% of pixels, then it is considered to be noise-dominated and hence unusable.
| Quadrant | # 1 sec bins | Bins with >0 counts | Bins with >2000 counts | High rate bins dominated by noise | Noise dominated (total time) | Noise dominated (detector-on time) | Marked lightcurve |
|---|---|---|---|---|---|---|---|
| A | 7706 | 7027 | 0 | 0 | 0.00% | 0.00% | 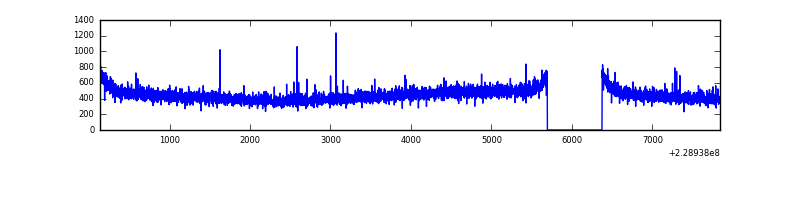 |
| B | 7706 | 7027 | 1 | 1 | 0.01% | 0.01% | 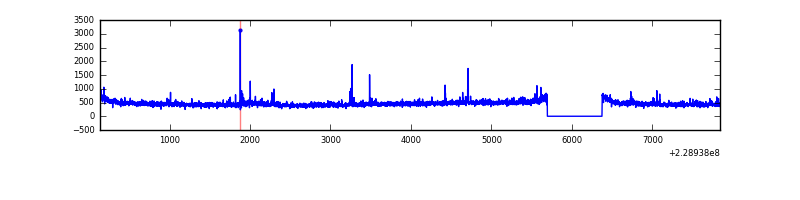 |
| C | 7706 | 7027 | 0 | 0 | 0.00% | 0.00% | 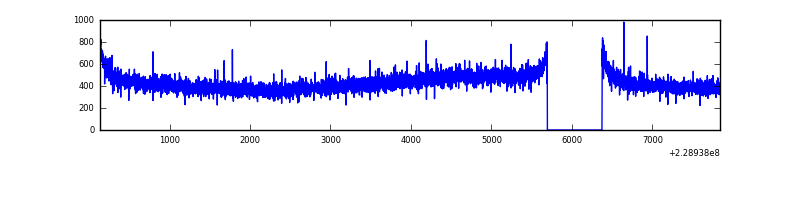 |
| D | 7706 | 7027 | 31 | 31 | 0.40% | 0.44% | 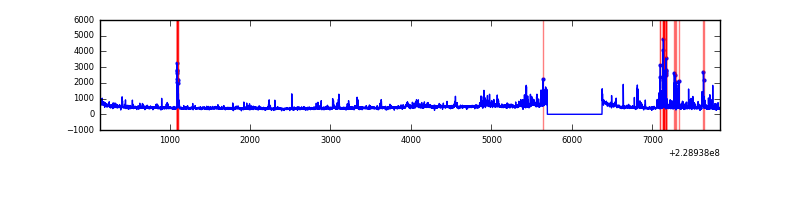 |
Top three noisy pixels from each quadrant. If the there are fewer than three noisy pixels in the level2.evt file, extra rows are filled as -1
| Pixel properties | Quadrant properties | ||||||
|---|---|---|---|---|---|---|---|
| Quadrant | DetID | PixID | Counts | Sigma | Mean | Median | Sigma |
| A | 13 | 14 | 13941 | 80.95 | 800 | 781 | 162.6 |
| A | 5 | 16 | 9770 | 55.29 | 800 | 781 | 162.6 |
| A | 0 | 226 | 7638 | 42.18 | 800 | 781 | 162.6 |
| B | 0 | 219 | 44629 | 286.04 | 803 | 784 | 153.3 |
| B | 0 | 214 | 39520 | 252.71 | 803 | 784 | 153.3 |
| B | 4 | 81 | 32012 | 203.73 | 803 | 784 | 153.3 |
| C | 13 | 61 | 5911 | 29.11 | 766 | 767 | 176.7 |
| C | 3 | 202 | 2053 | 7.28 | 766 | 767 | 176.7 |
| C | 12 | 4 | 2026 | 7.13 | 766 | 767 | 176.7 |
| D | 12 | 233 | 162563 | 862.47 | 766 | 740 | 187.6 |
| D | 1 | 52 | 151036 | 801.04 | 766 | 740 | 187.6 |
| D | 13 | 105 | 81872 | 432.41 | 766 | 740 | 187.6 |
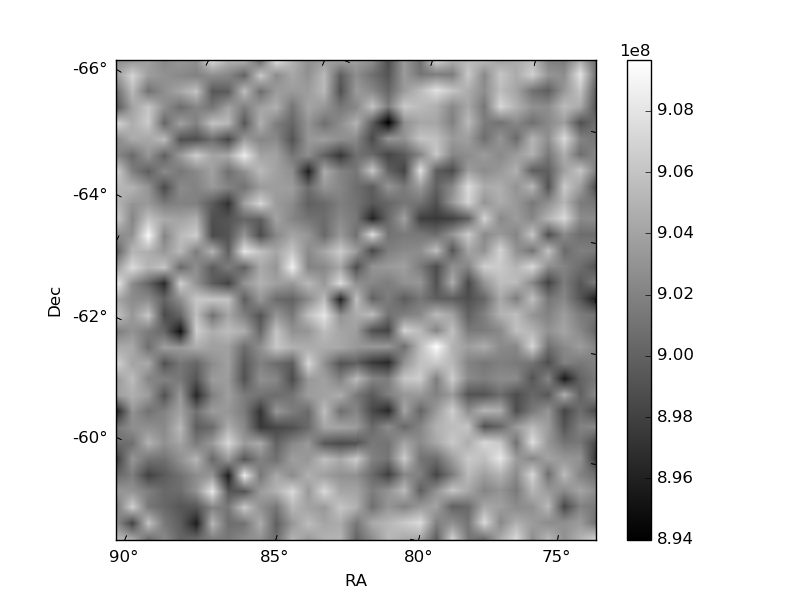
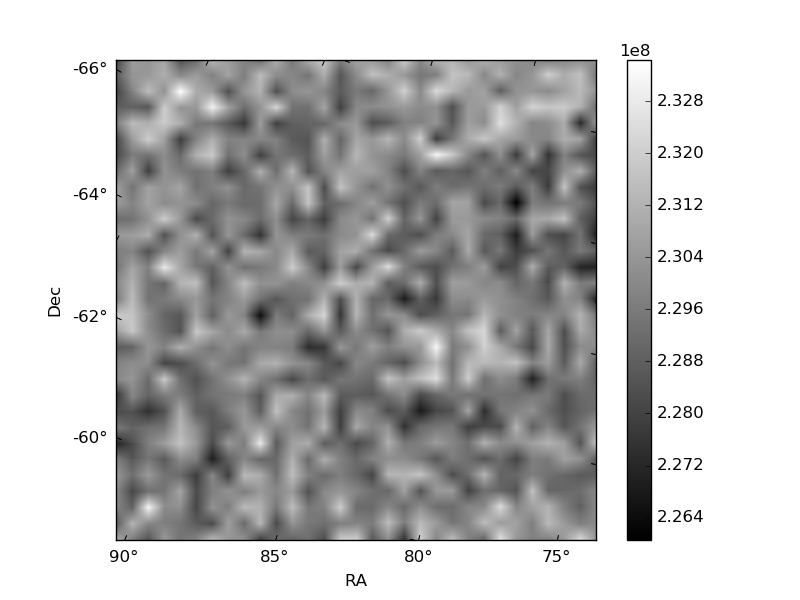
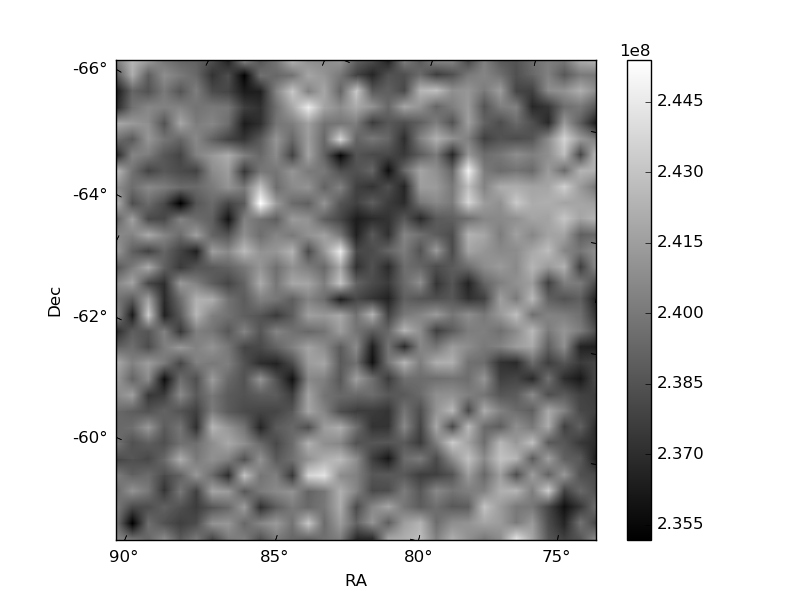
Histogram calculated using DETX and DETY for each event in the final _common_clean file
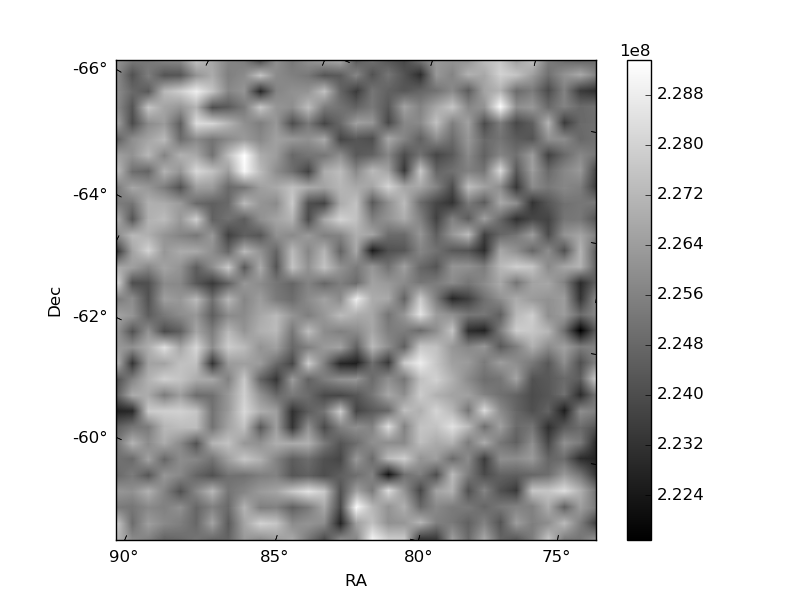
| Quadrant A | 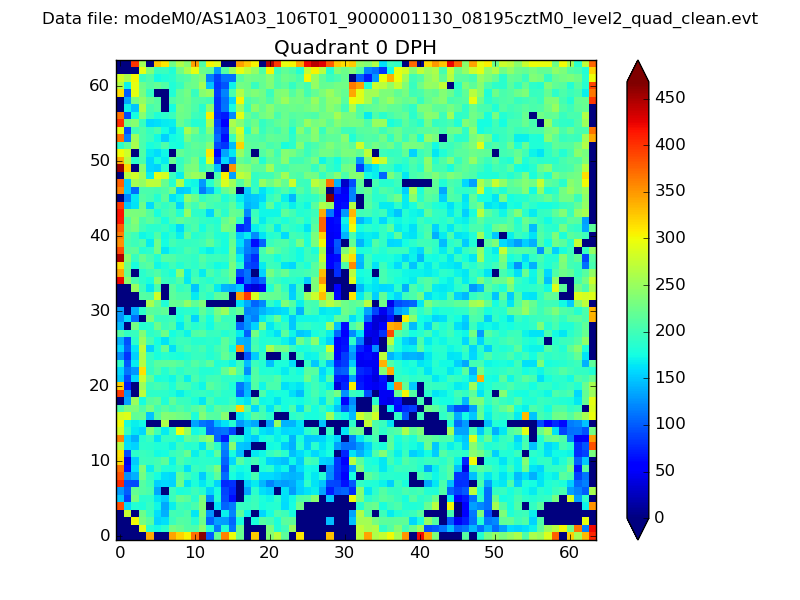 |
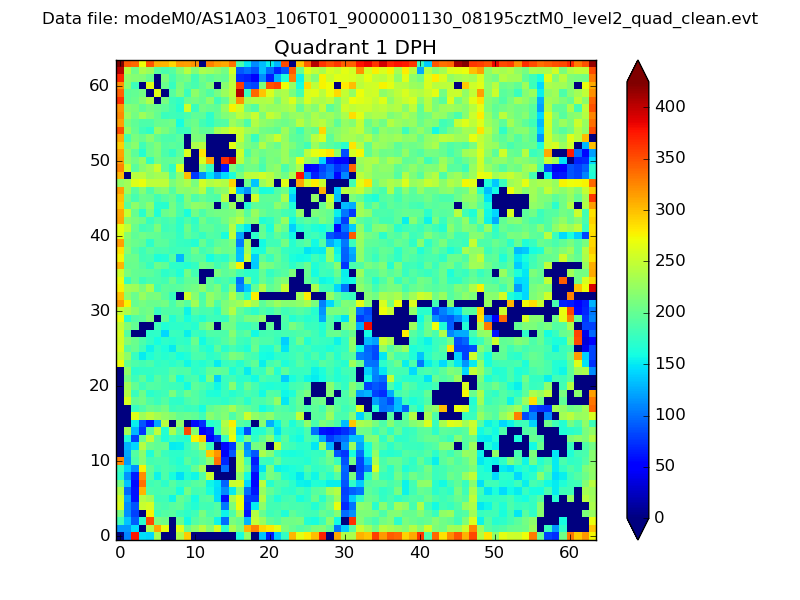 |
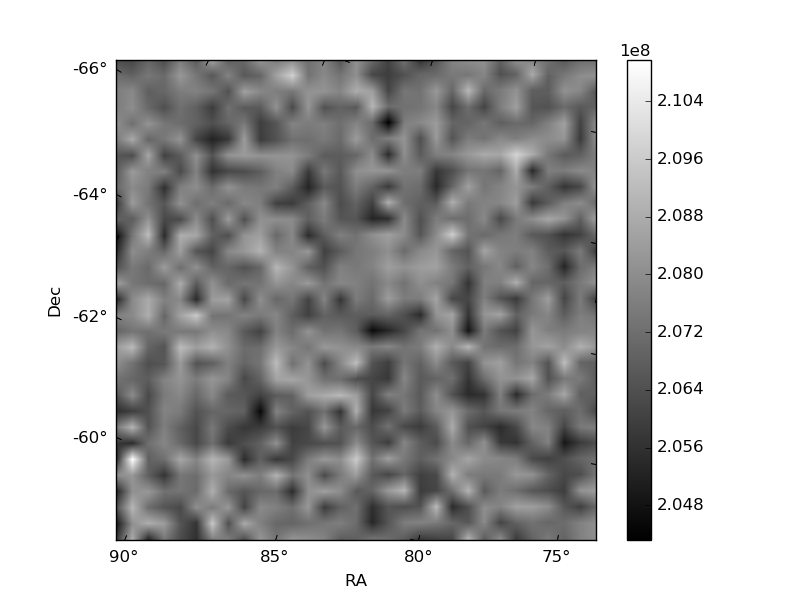
Quadrant B |
|---|---|---|---|
| Quadrant D | 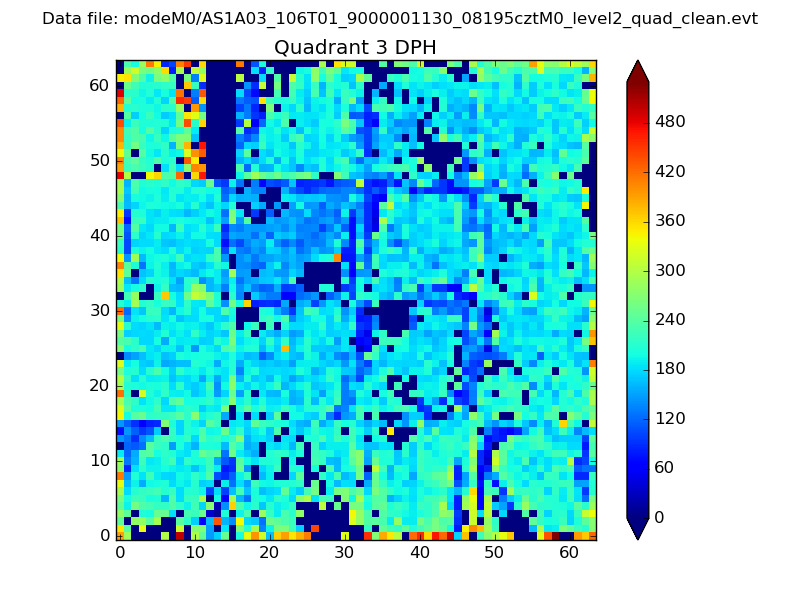 |
 |
Quadrant C |
| Plot type | Count rate plots | Images |
|---|---|---|
| Comparison with Poisson distribution Blue bars denote a histogram of data divided into 1 sec bins. Red curve is a Poisson curve with rate = median count rate of data. |
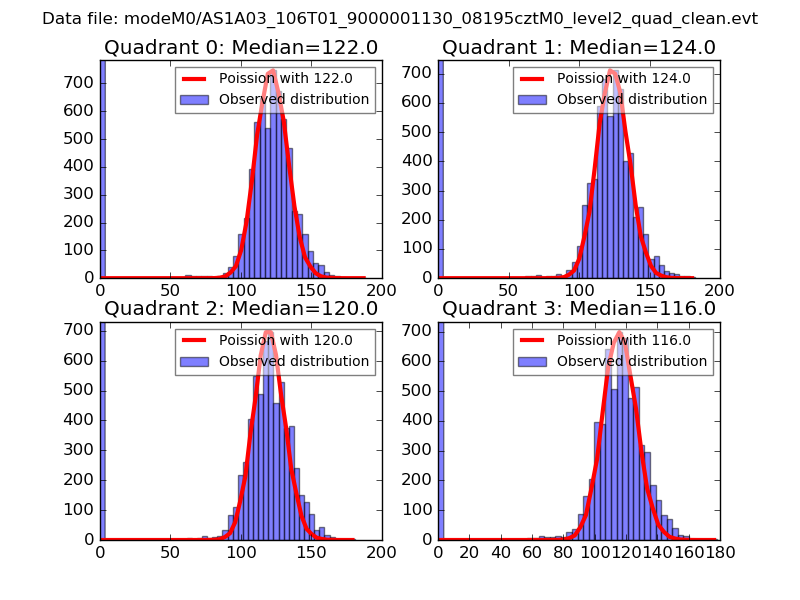 |
 |
| Quadrant-wise count rates Data is divided into 100 sec bins |
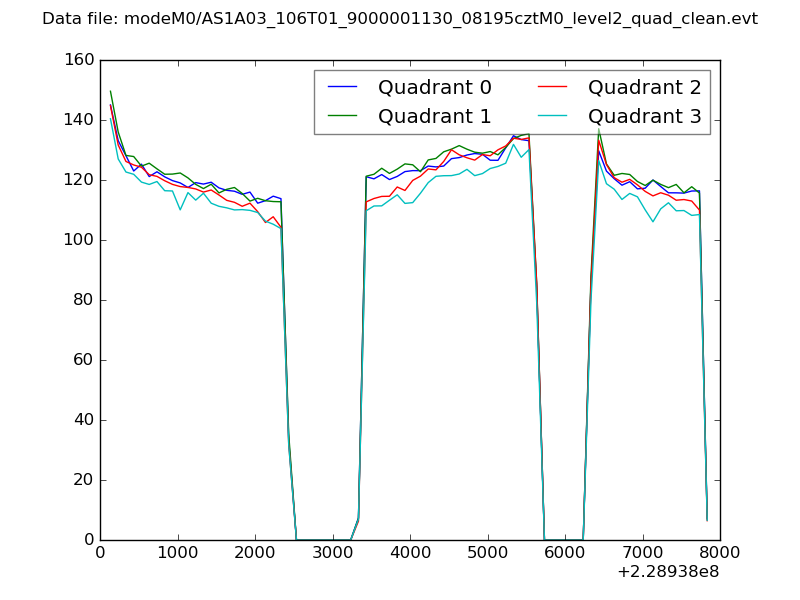 |
|
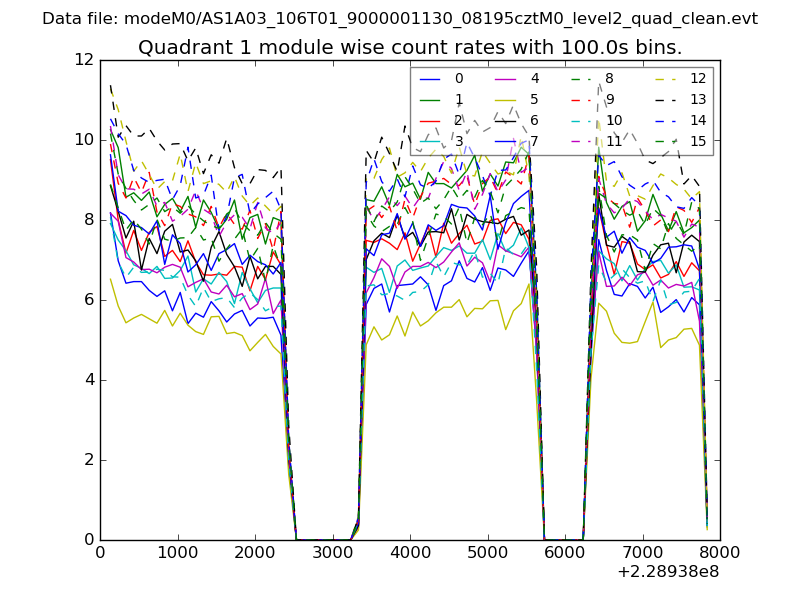
| Module-wise count rates for Quadrant A Data is divided into 100 sec bins |
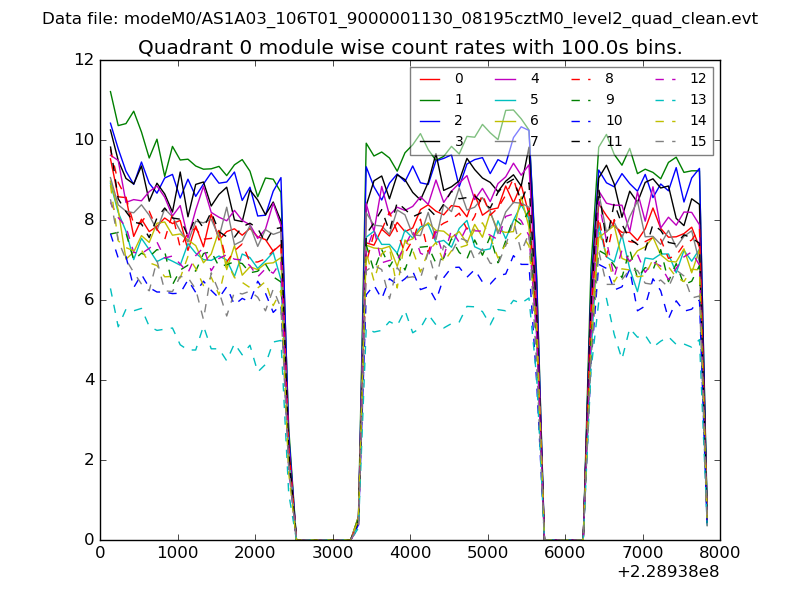 |
 |
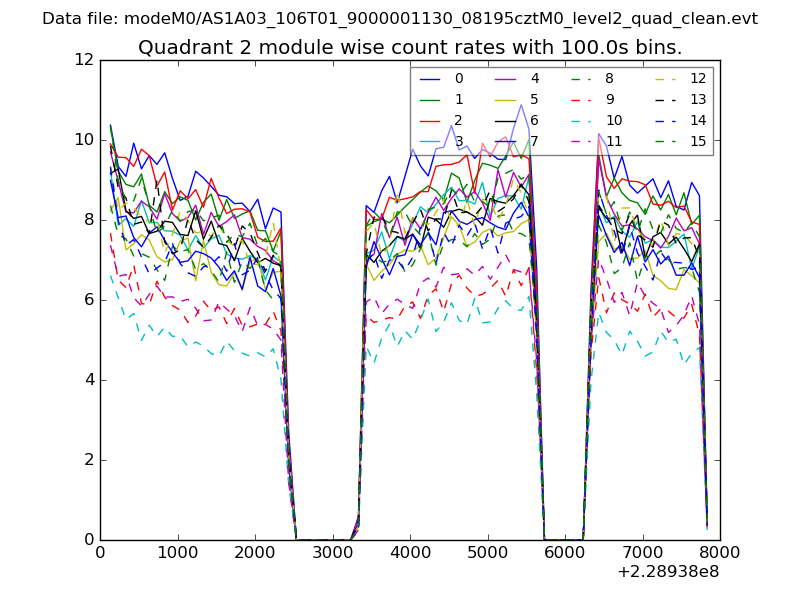
| Module-wise count rates for Quadrant B Data is divided into 100 sec bins |
 |
 |
| Module-wise count rates for Quadrant C Data is divided into 100 sec bins |
 |
 |
| Module-wise count rates for Quadrant D Data is divided into 100 sec bins |
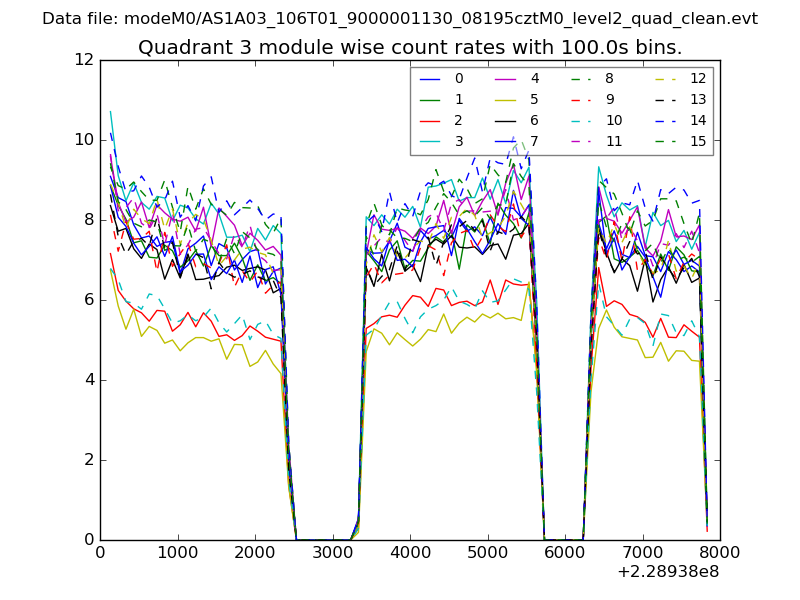 |
 |
| Parameter | Plot |
|---|---|
| CZT HV Monitor | 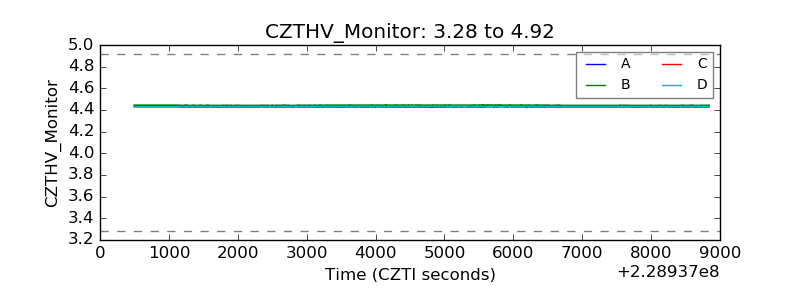 |
| D_VDD | 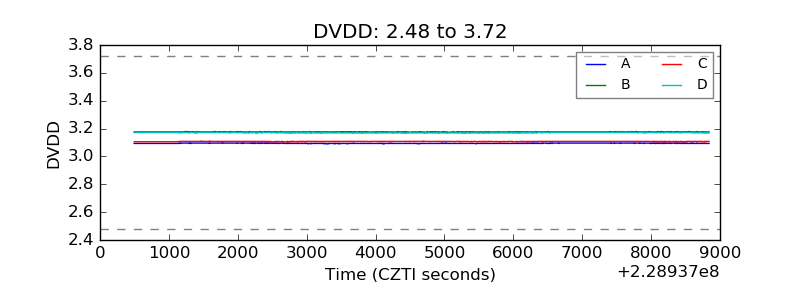 |
| Temperature 1 | 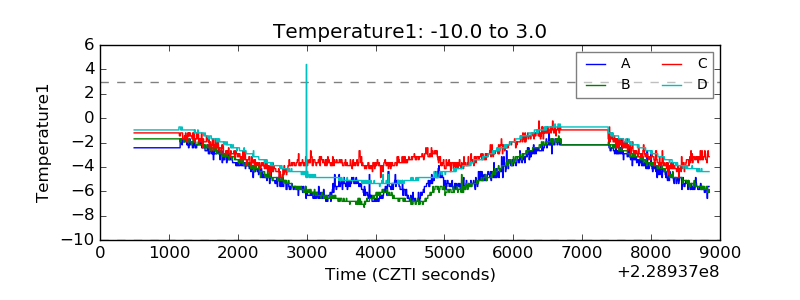 |
| Veto HV Monitor | 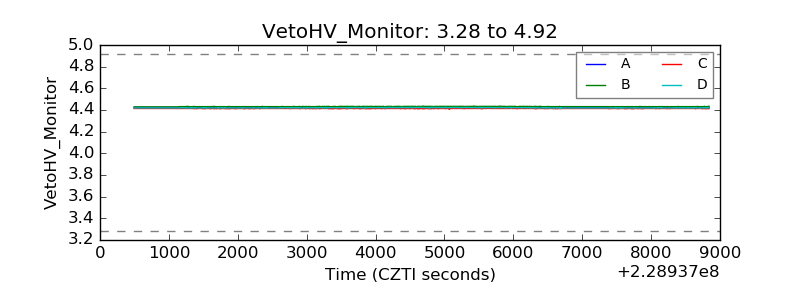 |
| Veto LLD | 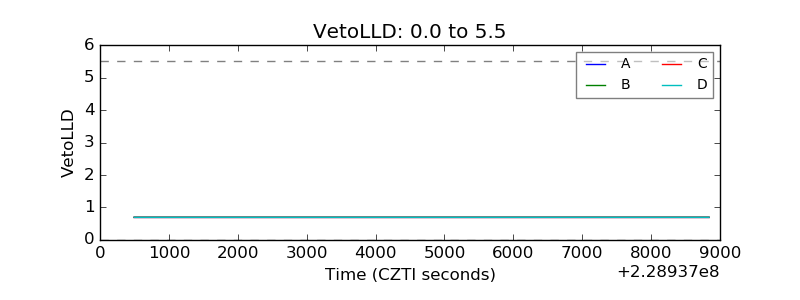 |
| Alpha Counter | 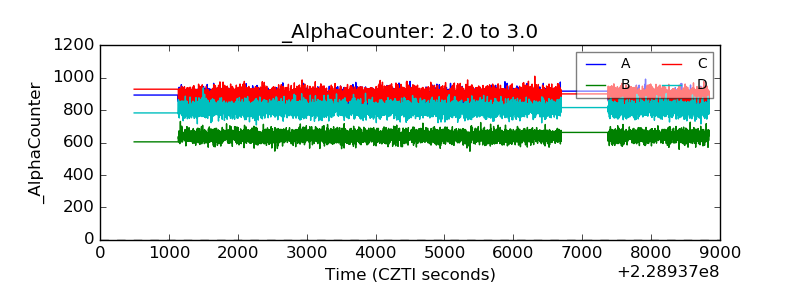 |
| _CPM_Rate | 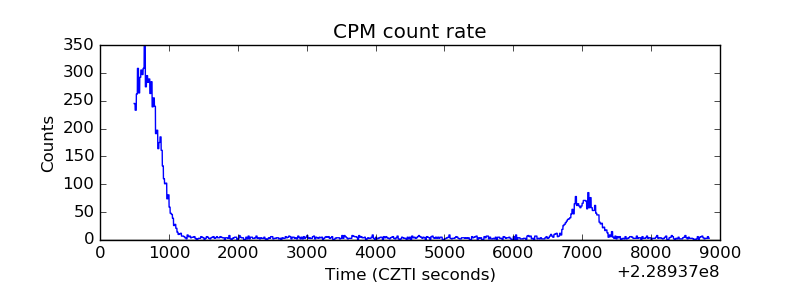 |
| CZT Counter |  |
| +2.5 Volts monitor |  |
| +5 Volts monitor |  |
| _ROLL_ROT | 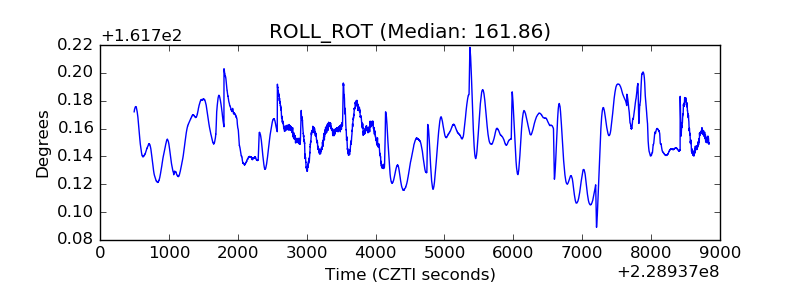 |
| _Roll_DEC | 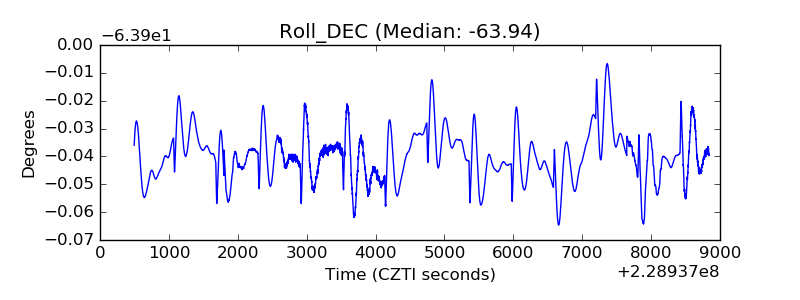 |
| _Roll_RA |  |
| Veto Counter | 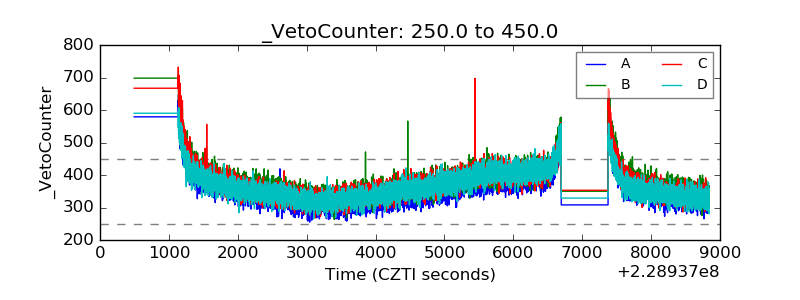 |