| Param | Original file | Final file |
|---|---|---|
| Filename | modeM0/AS1A03_106T01_9000001130_08197cztM0_level2.evt | modeM0/AS1A03_106T01_9000001130_08197cztM0_level2_quad_clean.evt |
| Size (bytes) | 528,059,520 | 126,504,000 |
| Size | 503.6 MB | 120.6 MB |
| Events in quadrant A | 3,686,804 | 826,669 |
| Events in quadrant B | 3,928,084 | 835,205 |
| Events in quadrant C | 3,572,772 | 817,186 |
| Events in quadrant D | 4,251,005 | 786,031 |
| Mode M0 | |||
|---|---|---|---|
| Quadrant | BADHDUFLAG | Total packets | Discarded packets |
| A | 0 | 16816 | 3 |
| B | 0 | 17305 | 2 |
| C | 0 | 16762 | 2 |
| D | 0 | 18683 | 2 |
| Mode M9 | |||
|---|---|---|---|
| Quadrant | BADHDUFLAG | Total packets | Discarded packets |
| A | 0 | 6 | 0 |
| B | 0 | 6 | 0 |
| C | 0 | 6 | 0 |
| D | 0 | 6 | 0 |
| Mode SS | |||
|---|---|---|---|
| Quadrant | BADHDUFLAG | Total packets | Discarded packets |
| A | 0 | 168 | 0 |
| B | 0 | 168 | 0 |
| C | 0 | 168 | 0 |
| D | 0 | 168 | 0 |
| Quadrant | Total seconds | Saturated seconds | Saturation percentage |
|---|---|---|---|
| A | 8149 | 121 | 1.484845% |
| B | 8149 | 150 | 1.840717% |
| C | 8149 | 67 | 0.822187% |
| D | 8149 | 175 | 2.147503% |
Noise dominated data is calculated using 1-second bins in cleaned event files. If a bin has >2000 counts, and if more than 50% of those come from <1% of pixels, then it is considered to be noise-dominated and hence unusable.
| Quadrant | # 1 sec bins | Bins with >0 counts | Bins with >2000 counts | High rate bins dominated by noise | Noise dominated (total time) | Noise dominated (detector-on time) | Marked lightcurve |
|---|---|---|---|---|---|---|---|
| A | 8724 | 8153 | 0 | 0 | 0.00% | 0.00% | 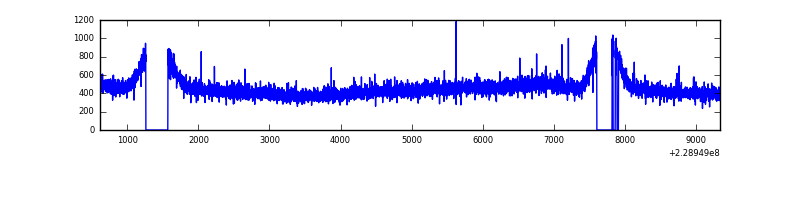 |
| B | 8724 | 8153 | 11 | 11 | 0.13% | 0.13% | 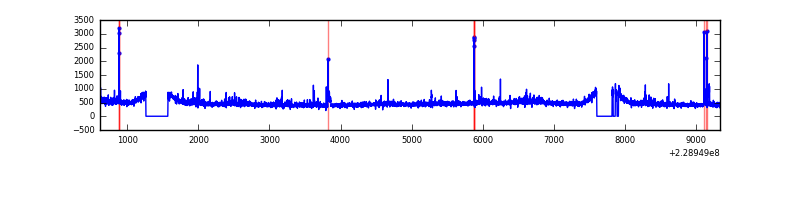 |
| C | 8724 | 8153 | 0 | 0 | 0.00% | 0.00% | 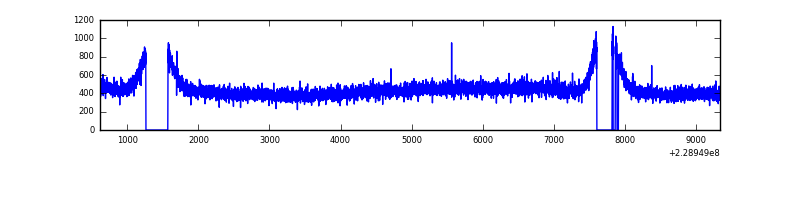 |
| D | 8724 | 8153 | 117 | 117 | 1.34% | 1.44% | 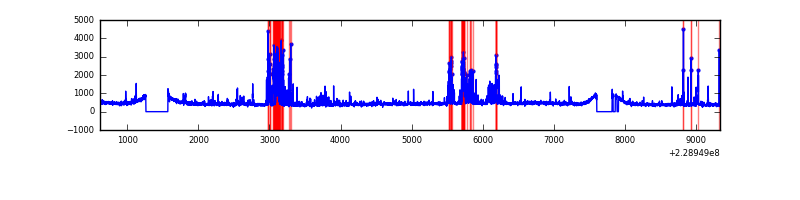 |
Top three noisy pixels from each quadrant. If the there are fewer than three noisy pixels in the level2.evt file, extra rows are filled as -1
| Pixel properties | Quadrant properties | ||||||
|---|---|---|---|---|---|---|---|
| Quadrant | DetID | PixID | Counts | Sigma | Mean | Median | Sigma |
| A | 8 | 15 | 29795 | 147.13 | 948 | 926 | 196.2 |
| A | 0 | 226 | 8930 | 40.79 | 948 | 926 | 196.2 |
| A | 12 | 194 | 8538 | 38.79 | 948 | 926 | 196.2 |
| B | 0 | 214 | 82489 | 445.29 | 950 | 923 | 183.2 |
| B | 10 | 16 | 46245 | 247.42 | 950 | 923 | 183.2 |
| B | 4 | 81 | 41584 | 221.98 | 950 | 923 | 183.2 |
| C | 8 | 128 | 9951 | 42.68 | 911 | 915 | 211.7 |
| C | 13 | 61 | 7214 | 29.75 | 911 | 915 | 211.7 |
| C | 8 | 112 | 5110 | 19.81 | 911 | 915 | 211.7 |
| D | 1 | 52 | 665414 | 2973.79 | 914 | 883 | 223.5 |
| D | 12 | 233 | 43978 | 192.85 | 914 | 883 | 223.5 |
| D | 2 | 234 | 29695 | 128.93 | 914 | 883 | 223.5 |
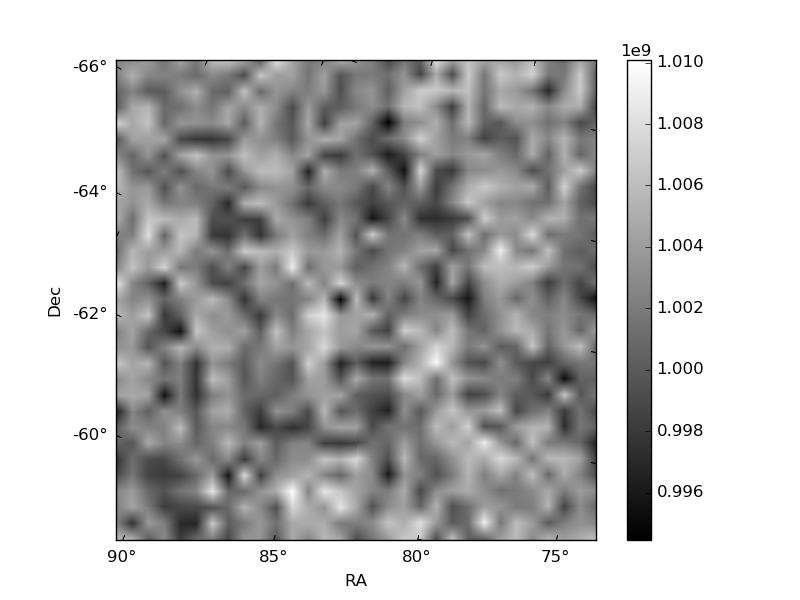
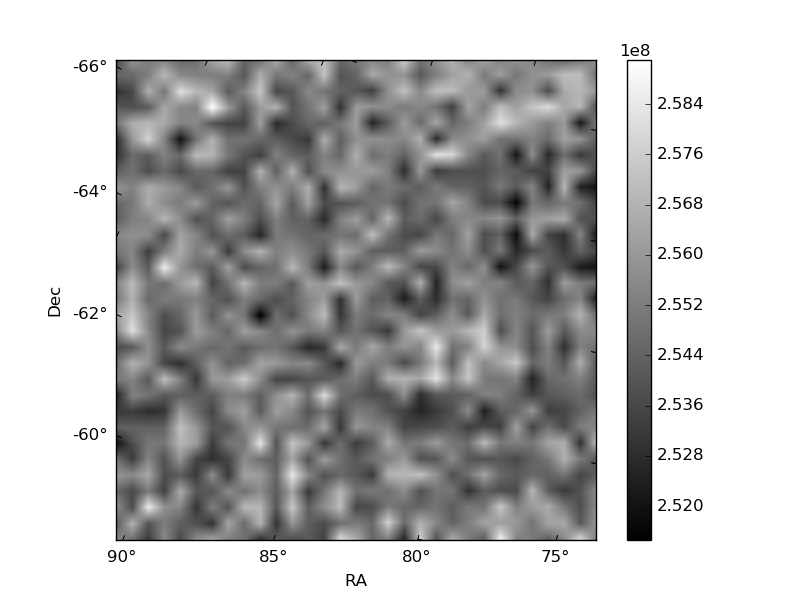
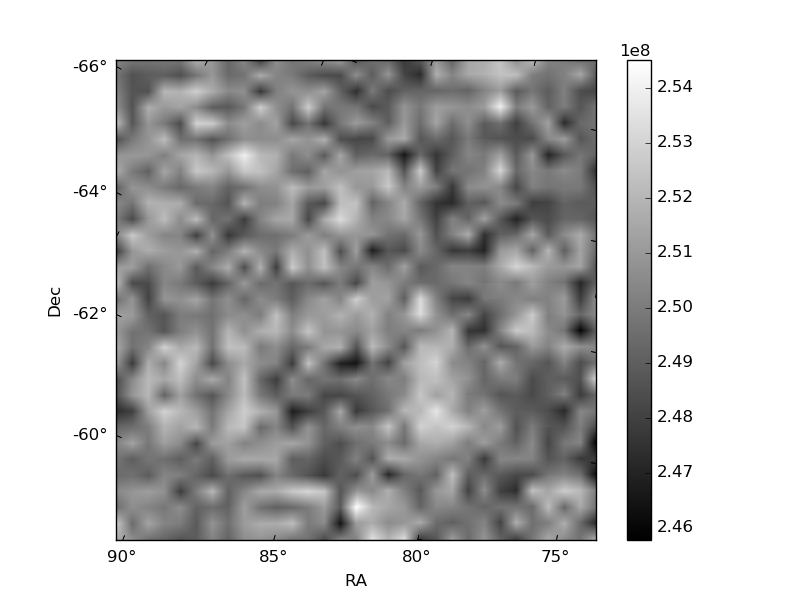
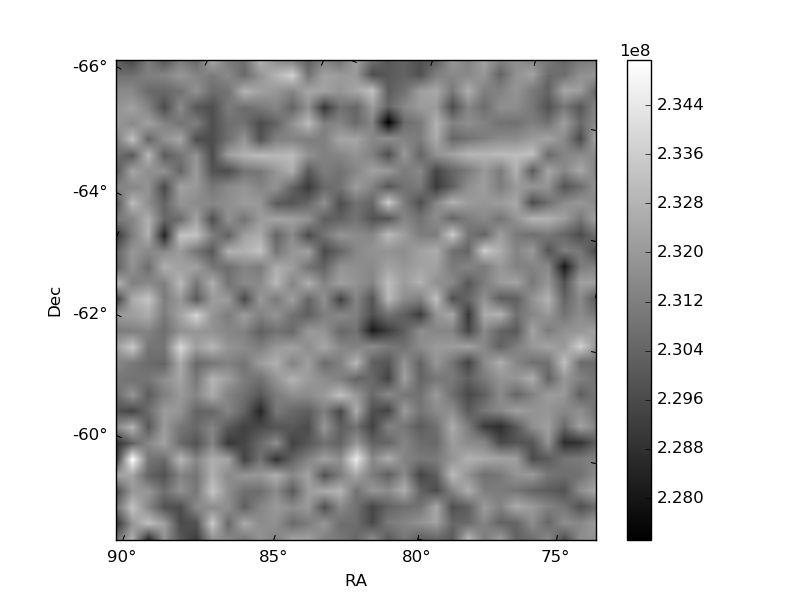
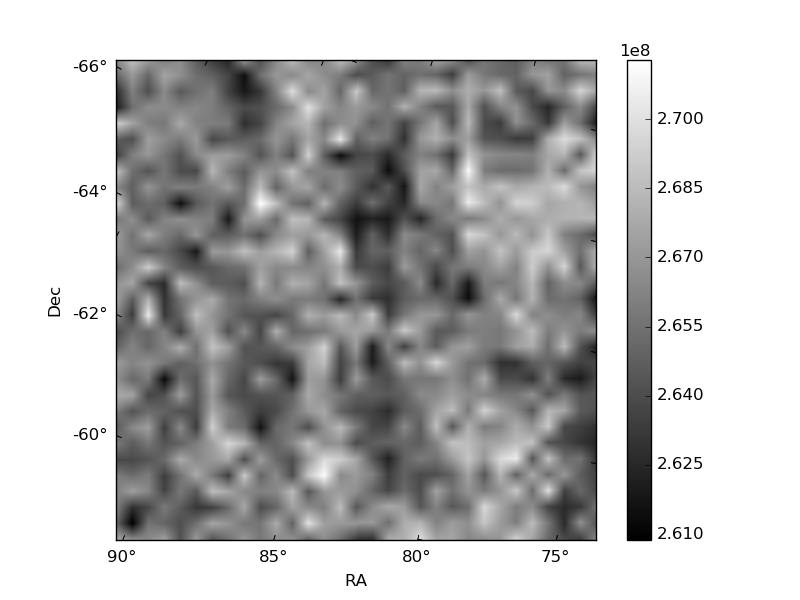
Histogram calculated using DETX and DETY for each event in the final _common_clean file
| Quadrant A | 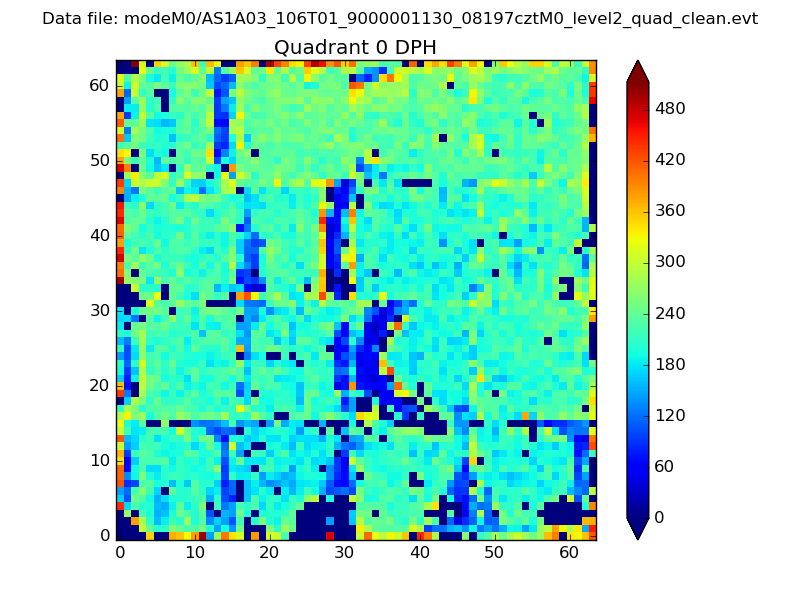 |
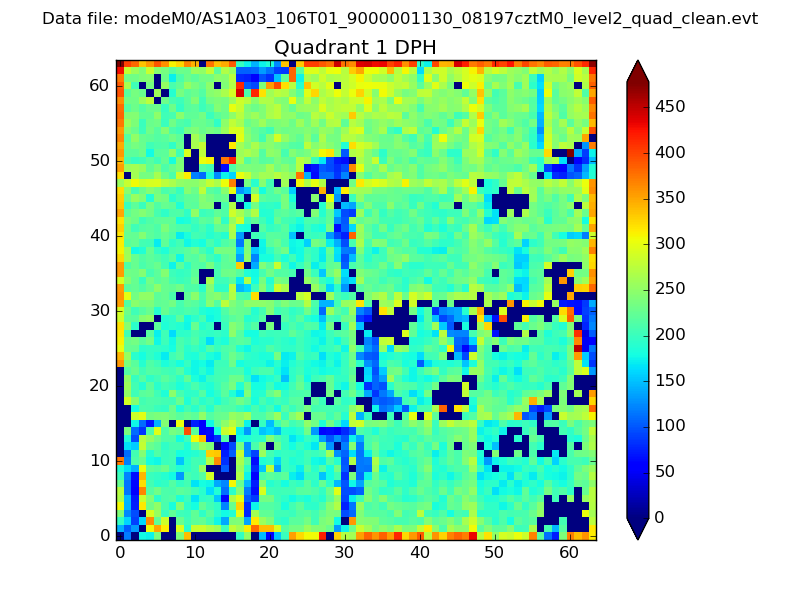 |
Quadrant B |
|---|---|---|---|
| Quadrant D | 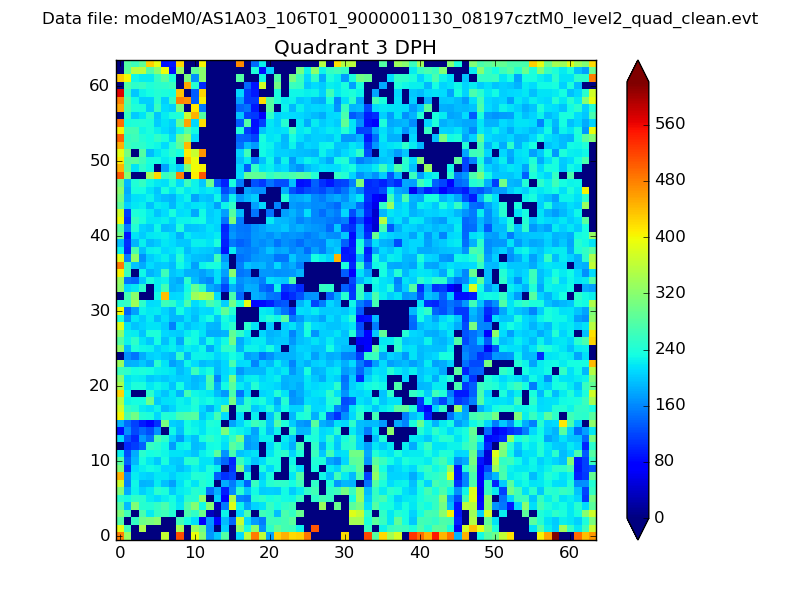 |
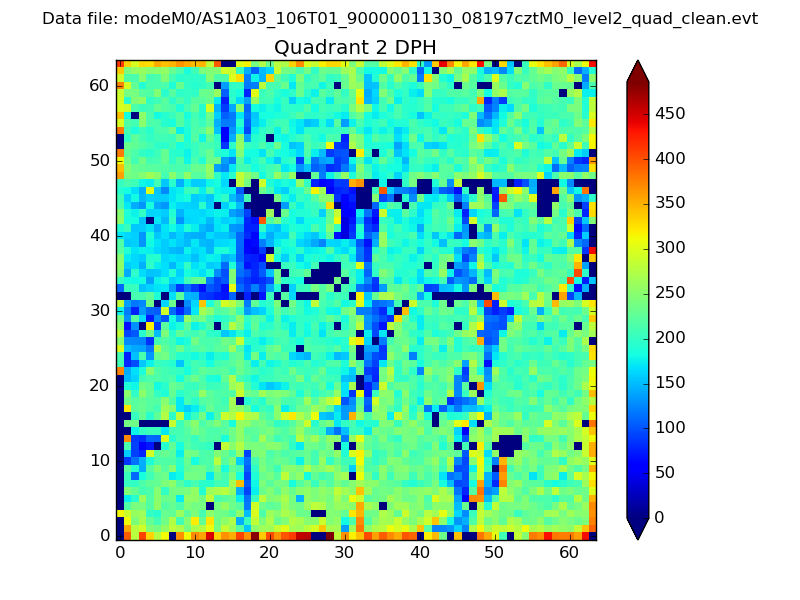 |
Quadrant C |
| Plot type | Count rate plots | Images |
|---|---|---|
| Comparison with Poisson distribution Blue bars denote a histogram of data divided into 1 sec bins. Red curve is a Poisson curve with rate = median count rate of data. |
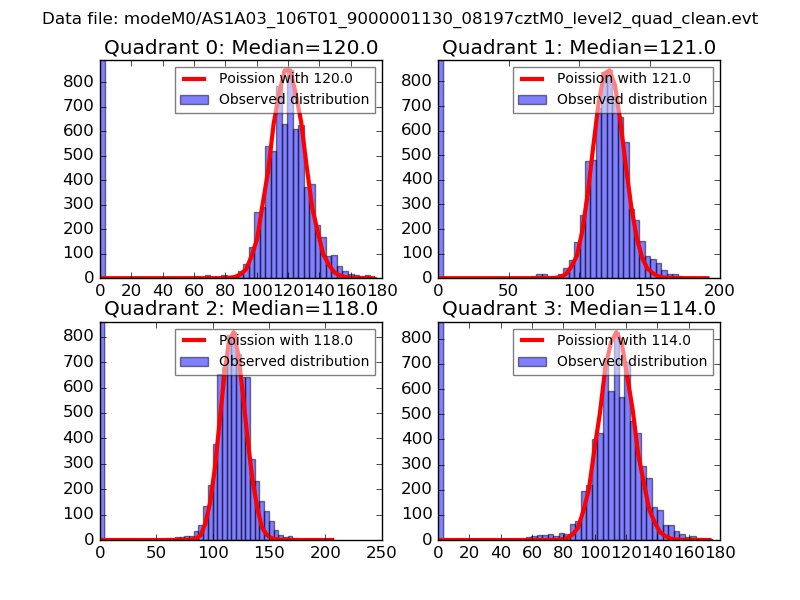 |
 |
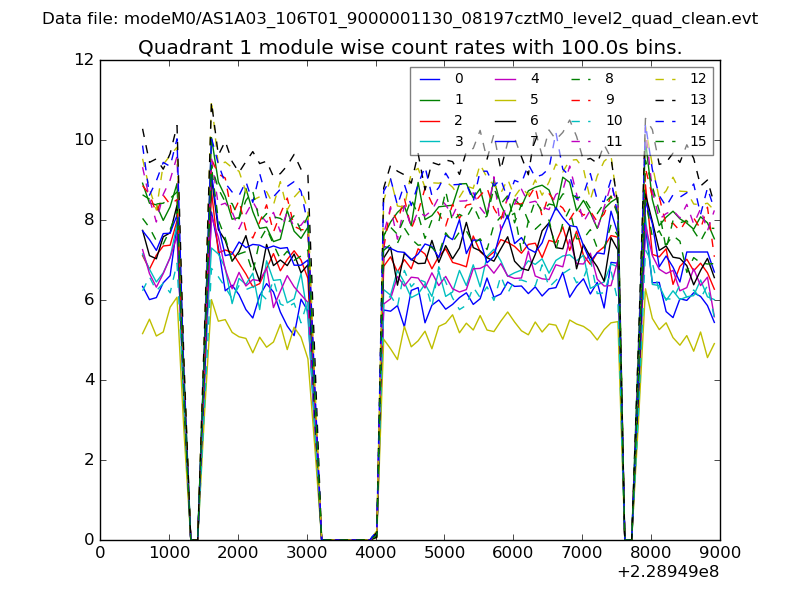
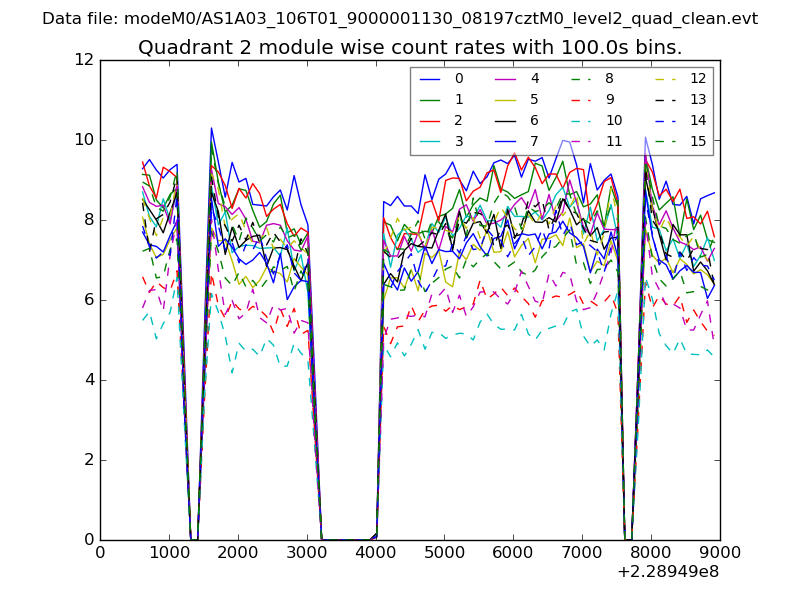
| Quadrant-wise count rates Data is divided into 100 sec bins |
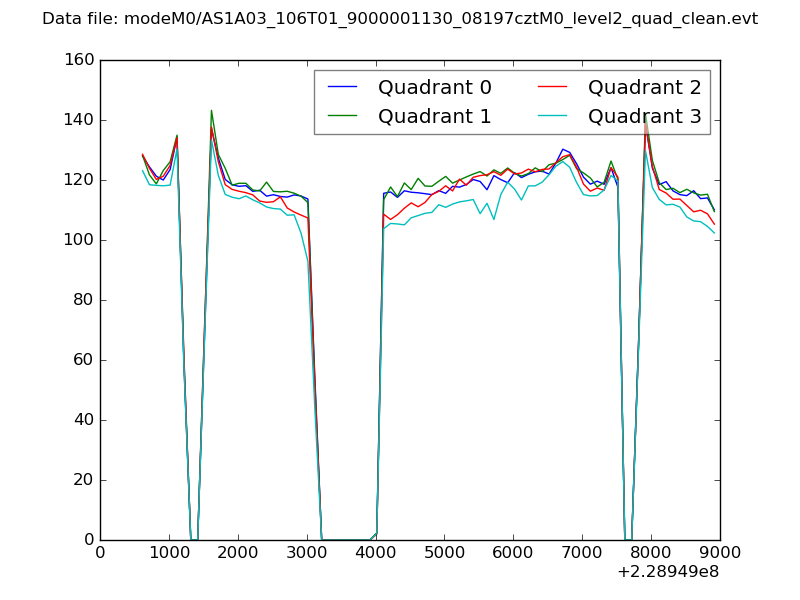 |
|
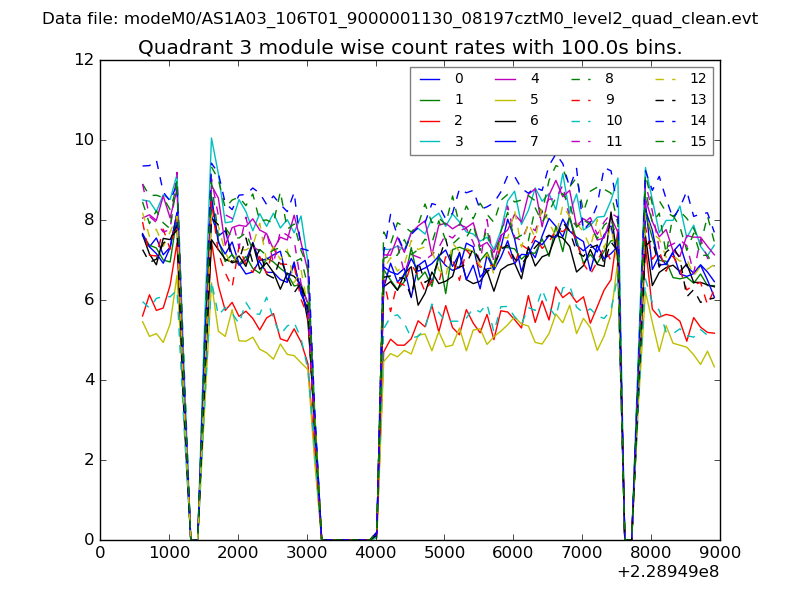
| Module-wise count rates for Quadrant A Data is divided into 100 sec bins |
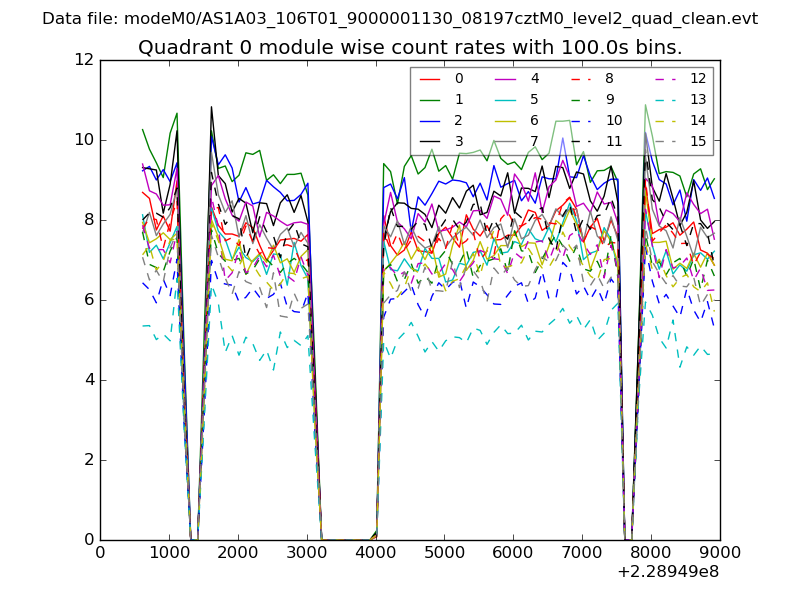 |
 |
| Module-wise count rates for Quadrant B Data is divided into 100 sec bins |
 |
 |
| Module-wise count rates for Quadrant C Data is divided into 100 sec bins |
 |
 |
| Module-wise count rates for Quadrant D Data is divided into 100 sec bins |
 |
 |
| Parameter | Plot |
|---|---|
| CZT HV Monitor | 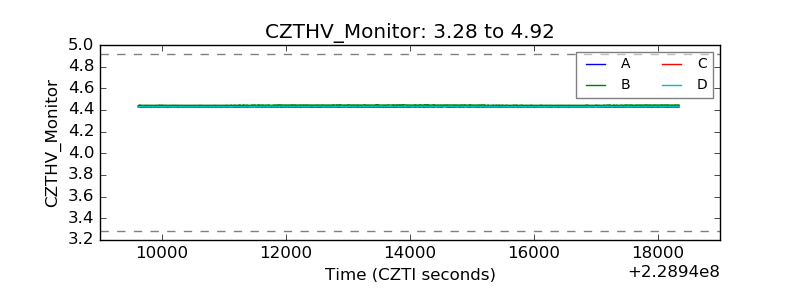 |
| D_VDD | 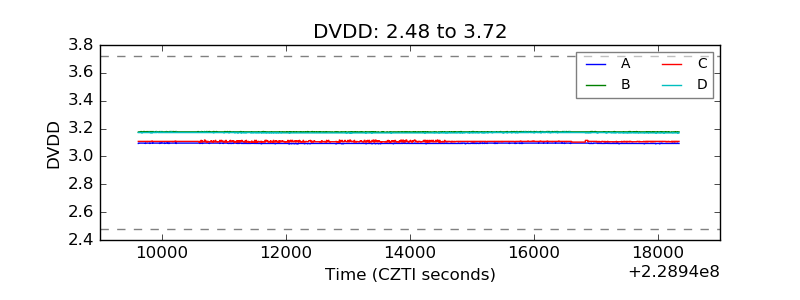 |
| Temperature 1 | 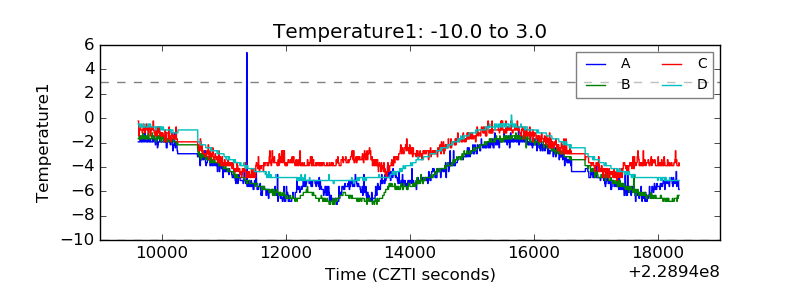 |
| Veto HV Monitor | 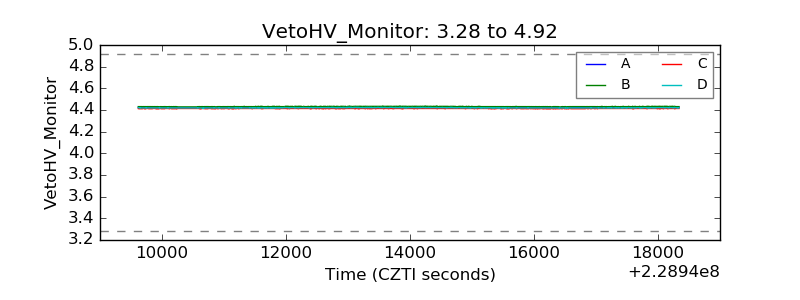 |
| Veto LLD | 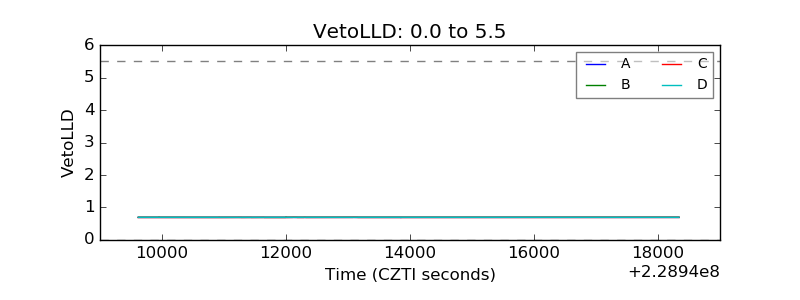 |
| Alpha Counter | 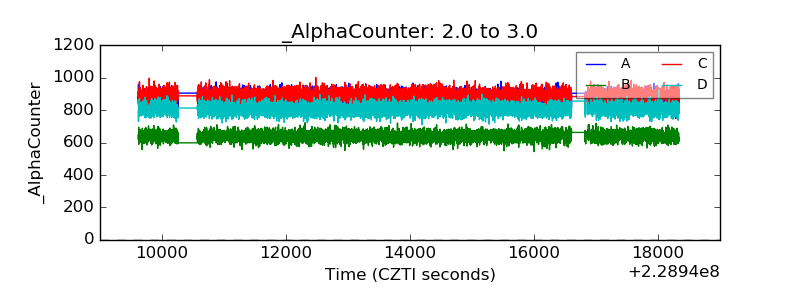 |
| _CPM_Rate | 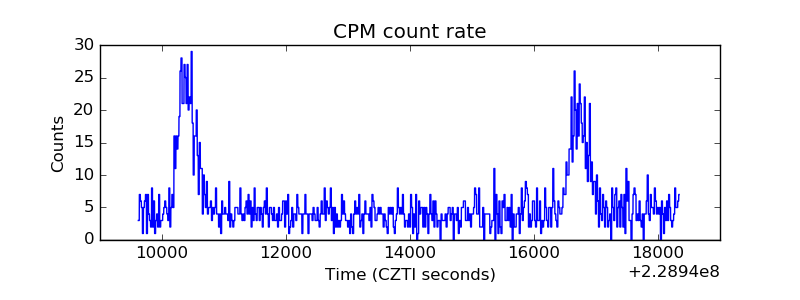 |
| CZT Counter | 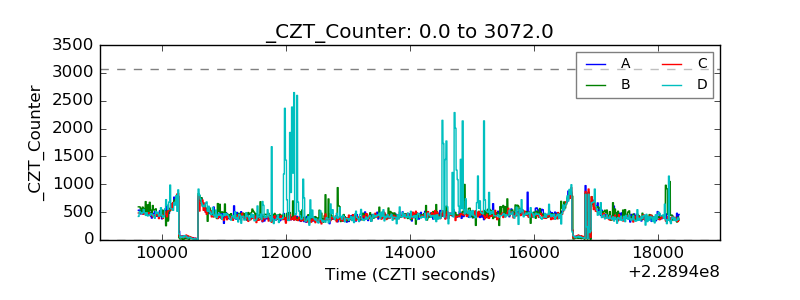 |
| +2.5 Volts monitor |  |
| +5 Volts monitor |  |
| _ROLL_ROT | 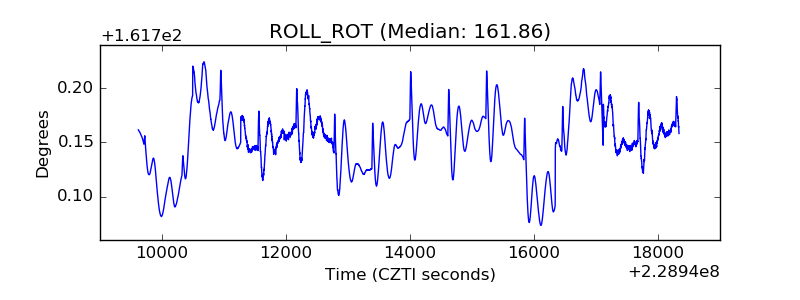 |
| _Roll_DEC | 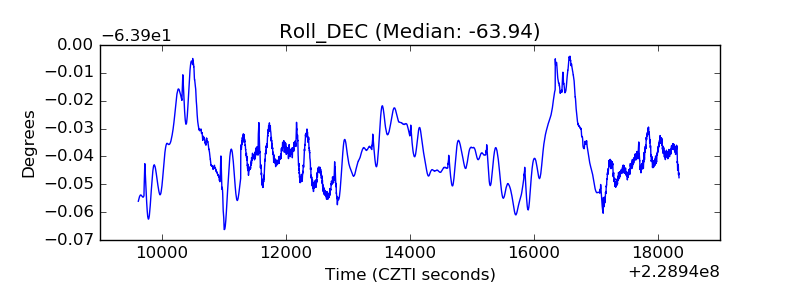 |
| _Roll_RA | 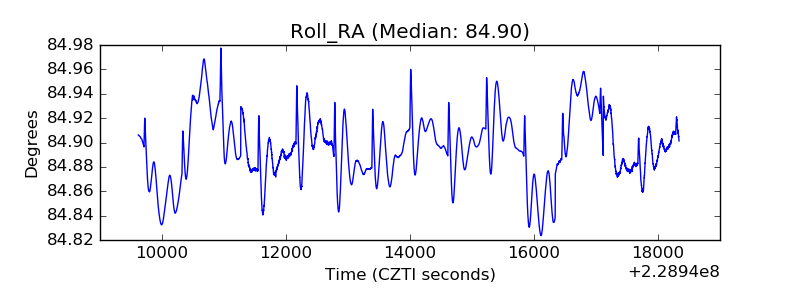 |
| Veto Counter |  |