| Param | Original file | Final file |
|---|---|---|
| Filename | modeM0/AS1A03_106T01_9000001130_08198cztM0_level2.evt | modeM0/AS1A03_106T01_9000001130_08198cztM0_level2_quad_clean.evt |
| Size (bytes) | 488,491,200 | 107,737,920 |
| Size | 465.9 MB | 102.7 MB |
| Events in quadrant A | 3,538,022 | 687,757 |
| Events in quadrant B | 3,968,783 | 697,305 |
| Events in quadrant C | 3,350,228 | 682,367 |
| Events in quadrant D | 3,414,635 | 661,257 |
| Mode M0 | |||
|---|---|---|---|
| Quadrant | BADHDUFLAG | Total packets | Discarded packets |
| A | 0 | 16136 | 33 |
| B | 0 | 17057 | 26 |
| C | 0 | 15807 | 31 |
| D | 0 | 16043 | 29 |
| Mode M9 | |||
|---|---|---|---|
| Quadrant | BADHDUFLAG | Total packets | Discarded packets |
| A | 0 | 7 | 0 |
| B | 0 | 7 | 0 |
| C | 0 | 7 | 0 |
| D | 0 | 7 | 0 |
| Mode SS | |||
|---|---|---|---|
| Quadrant | BADHDUFLAG | Total packets | Discarded packets |
| A | 0 | 160 | 0 |
| B | 0 | 160 | 0 |
| C | 0 | 160 | 2 |
| D | 0 | 160 | 0 |
| Quadrant | Total seconds | Saturated seconds | Saturation percentage |
|---|---|---|---|
| A | 7680 | 144 | 1.875000% |
| B | 7682 | 234 | 3.046082% |
| C | 7680 | 97 | 1.263021% |
| D | 7681 | 89 | 1.158703% |
Noise dominated data is calculated using 1-second bins in cleaned event files. If a bin has >2000 counts, and if more than 50% of those come from <1% of pixels, then it is considered to be noise-dominated and hence unusable.
| Quadrant | # 1 sec bins | Bins with >0 counts | Bins with >2000 counts | High rate bins dominated by noise | Noise dominated (total time) | Noise dominated (detector-on time) | Marked lightcurve |
|---|---|---|---|---|---|---|---|
| A | 8374 | 7697 | 0 | 0 | 0.00% | 0.00% | 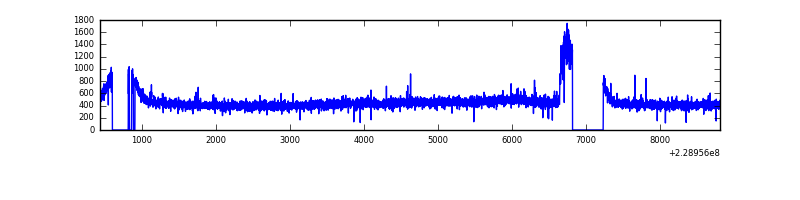 |
| B | 8374 | 7697 | 71 | 71 | 0.85% | 0.92% | 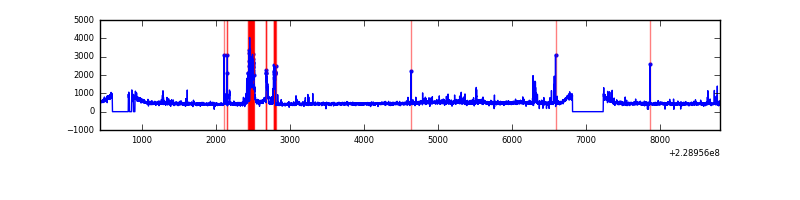 |
| C | 8374 | 7697 | 0 | 0 | 0.00% | 0.00% | 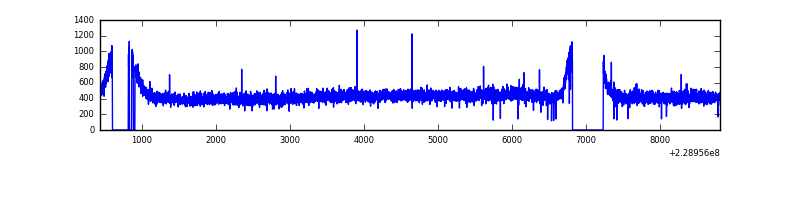 |
| D | 8374 | 7697 | 9 | 9 | 0.11% | 0.12% | 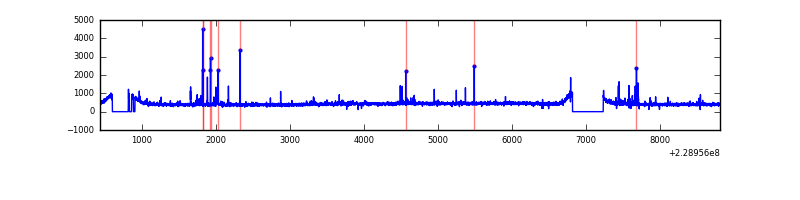 |
Top three noisy pixels from each quadrant. If the there are fewer than three noisy pixels in the level2.evt file, extra rows are filled as -1
| Pixel properties | Quadrant properties | ||||||
|---|---|---|---|---|---|---|---|
| Quadrant | DetID | PixID | Counts | Sigma | Mean | Median | Sigma |
| A | 15 | 79 | 106484 | 572.65 | 884 | 861 | 184.4 |
| A | 8 | 15 | 27157 | 142.57 | 884 | 861 | 184.4 |
| A | 0 | 226 | 8312 | 40.4 | 884 | 861 | 184.4 |
| B | 10 | 16 | 333435 | 1946.63 | 890 | 868 | 170.8 |
| B | 0 | 214 | 65247 | 376.83 | 890 | 868 | 170.8 |
| B | 4 | 81 | 38687 | 221.37 | 890 | 868 | 170.8 |
| C | 13 | 61 | 6566 | 28.62 | 857 | 857 | 199.5 |
| C | 12 | 4 | 3469 | 13.09 | 857 | 857 | 199.5 |
| C | 7 | 159 | 3360 | 12.55 | 857 | 857 | 199.5 |
| D | 1 | 52 | 93257 | 440.25 | 854 | 825 | 210.0 |
| D | 2 | 234 | 28779 | 133.14 | 854 | 825 | 210.0 |
| D | 13 | 105 | 20929 | 95.76 | 854 | 825 | 210.0 |
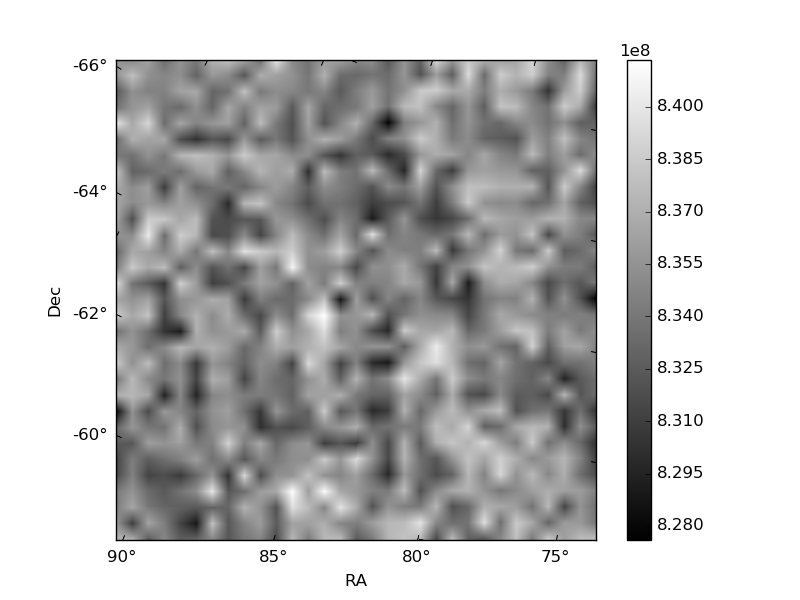
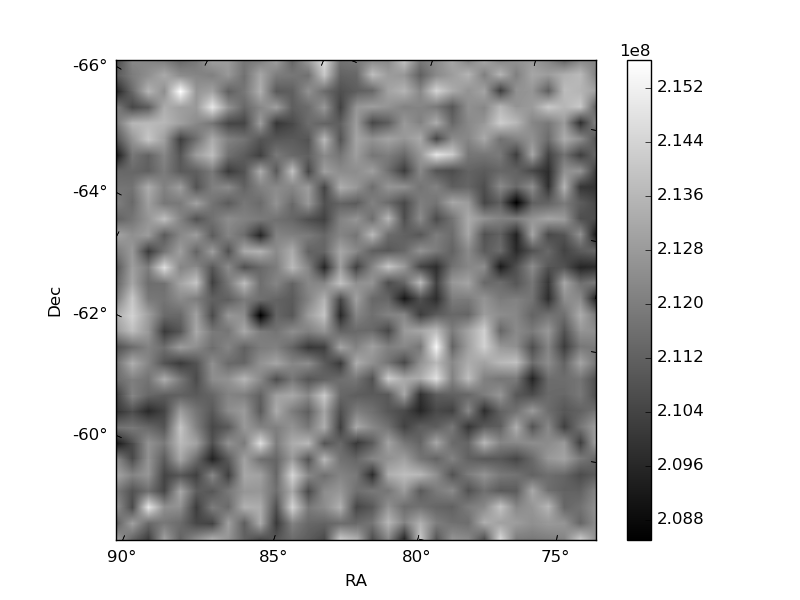
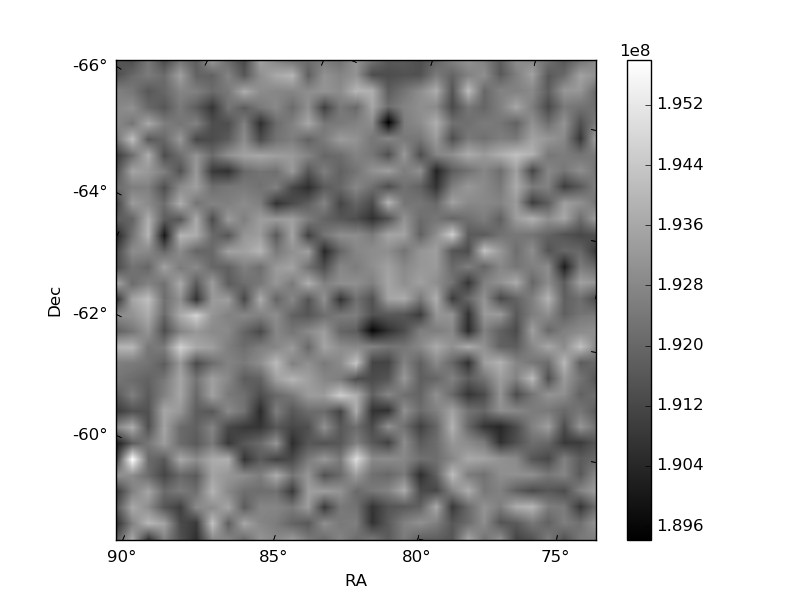
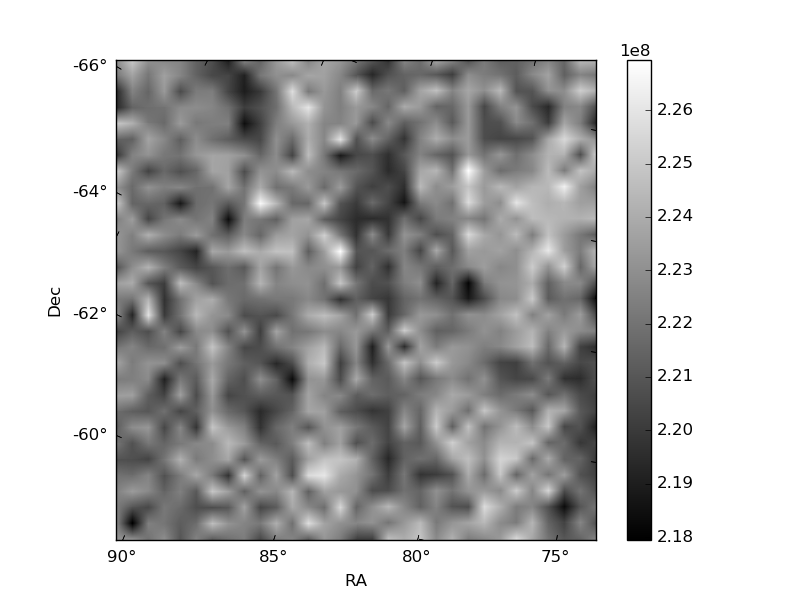
Histogram calculated using DETX and DETY for each event in the final _common_clean file
| Quadrant A | 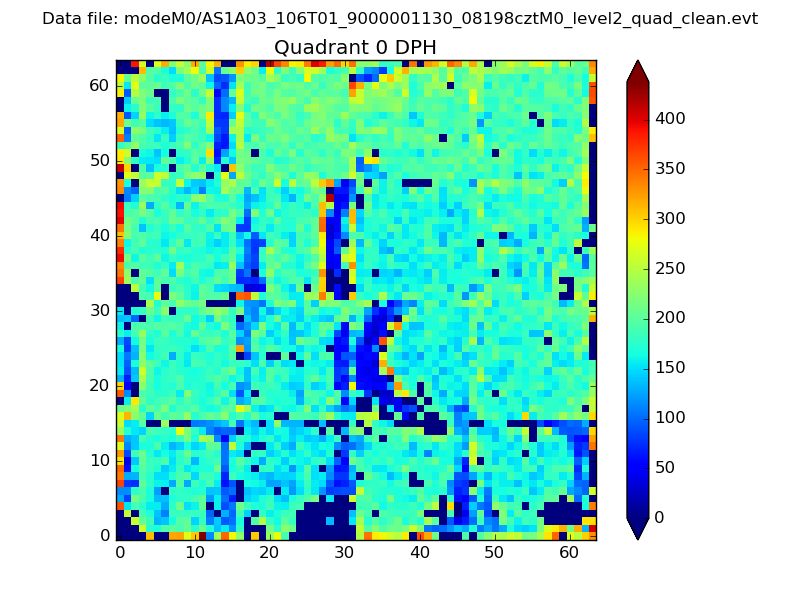 |
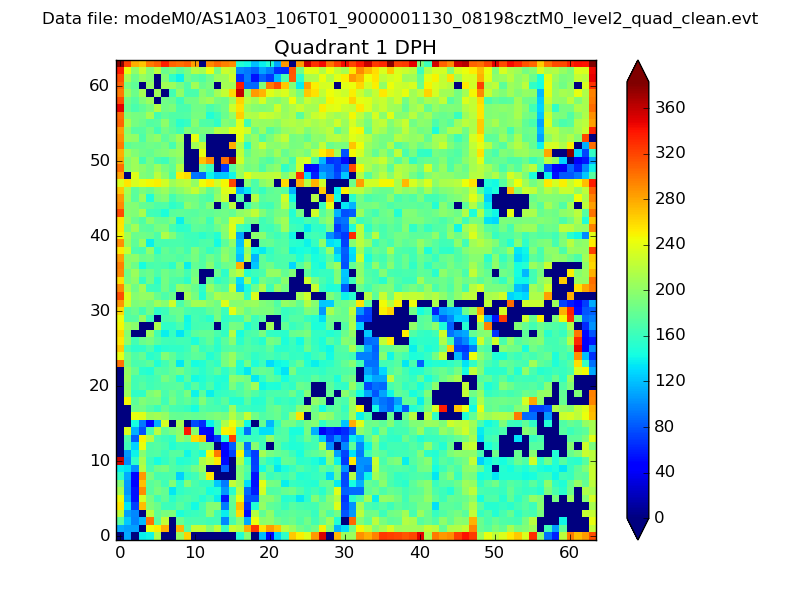 |
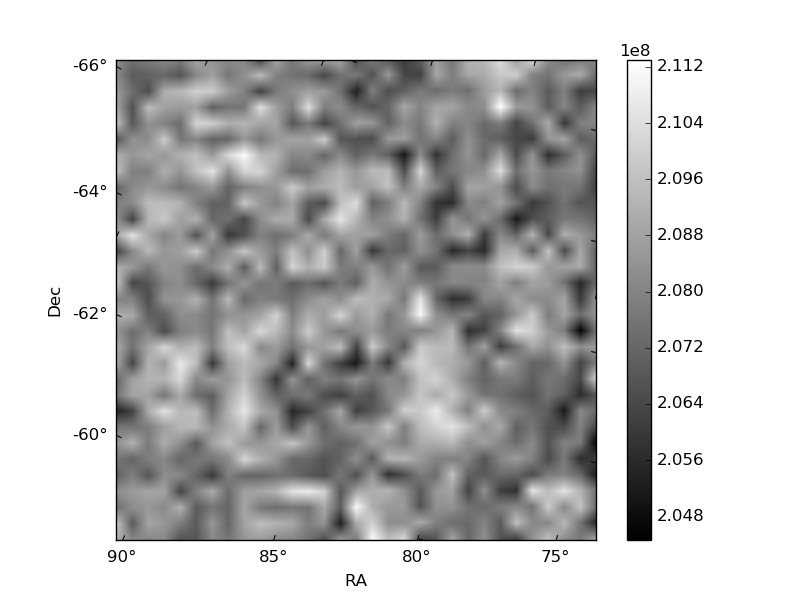
Quadrant B |
|---|---|---|---|
| Quadrant D | 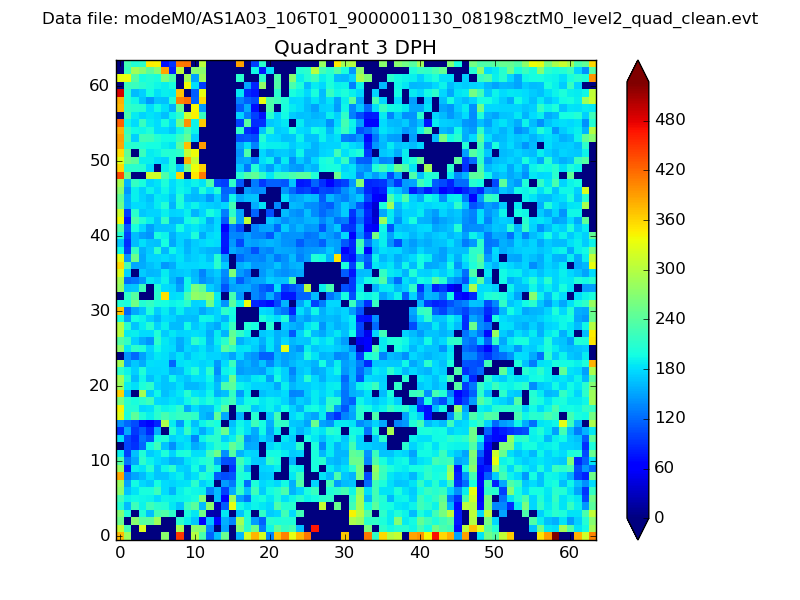 |
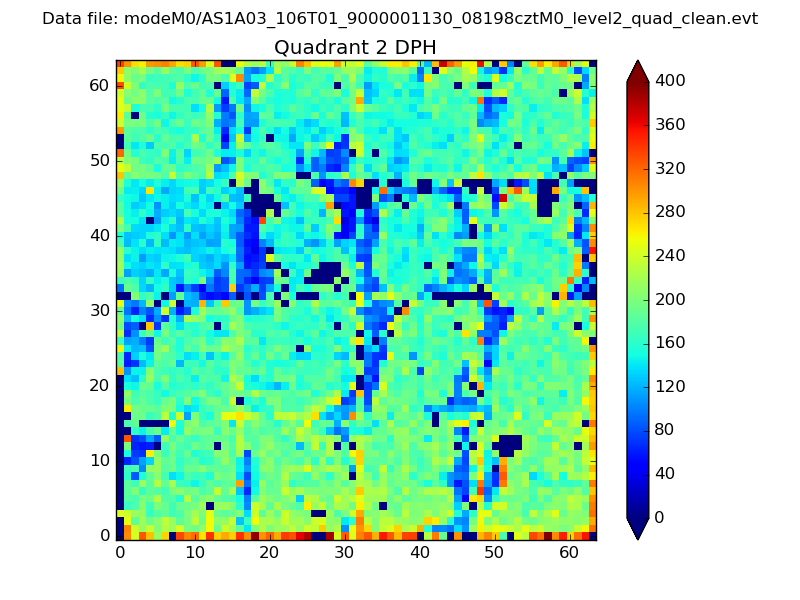 |
Quadrant C |
| Plot type | Count rate plots | Images |
|---|---|---|
| Comparison with Poisson distribution Blue bars denote a histogram of data divided into 1 sec bins. Red curve is a Poisson curve with rate = median count rate of data. |
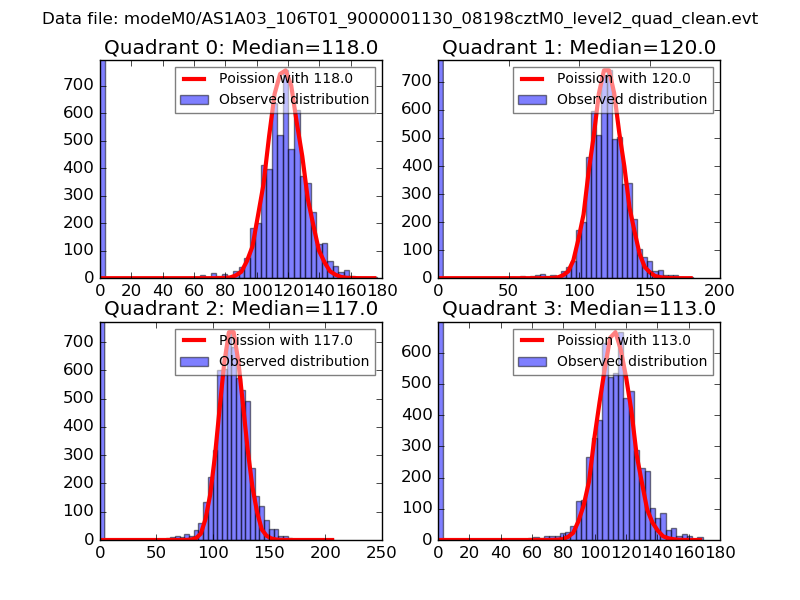 |
 |
| Quadrant-wise count rates Data is divided into 100 sec bins |
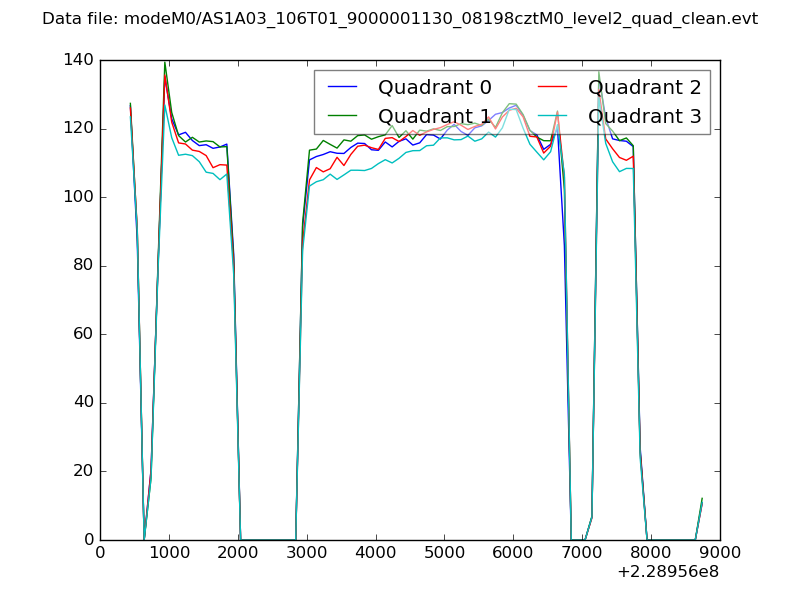 |
|
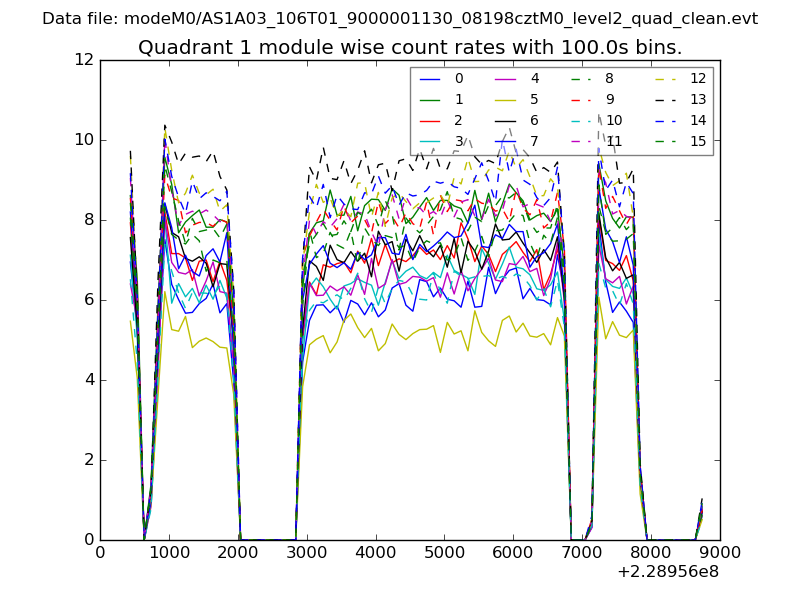
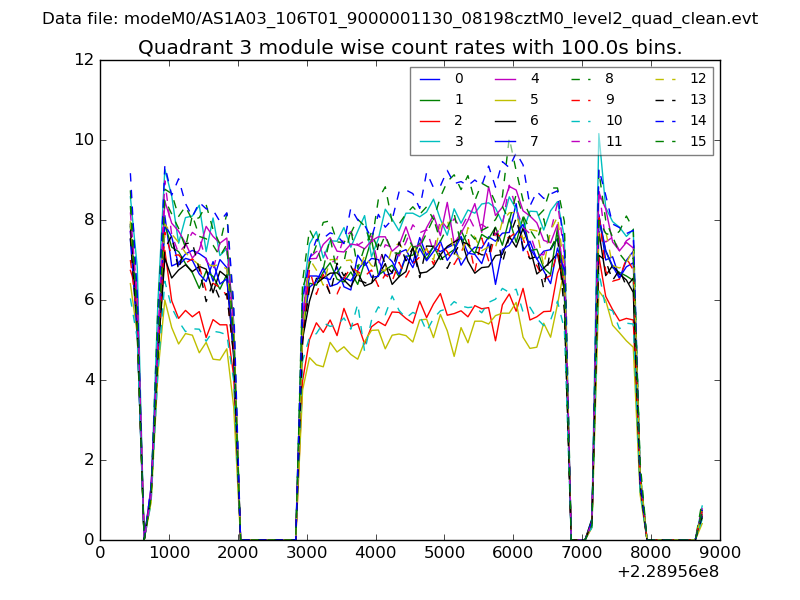
| Module-wise count rates for Quadrant A Data is divided into 100 sec bins |
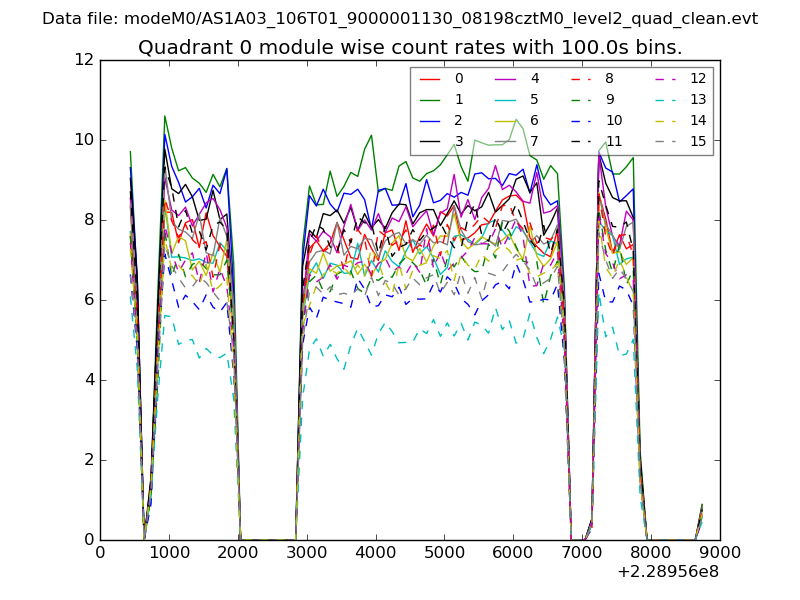 |
 |
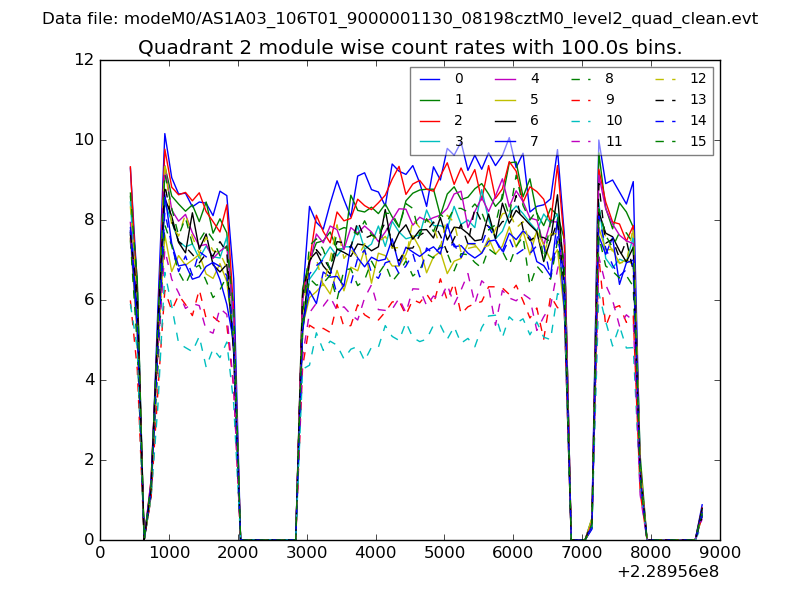
| Module-wise count rates for Quadrant B Data is divided into 100 sec bins |
 |
 |
| Module-wise count rates for Quadrant C Data is divided into 100 sec bins |
 |
 |
| Module-wise count rates for Quadrant D Data is divided into 100 sec bins |
 |
 |
| Parameter | Plot |
|---|---|
| CZT HV Monitor | 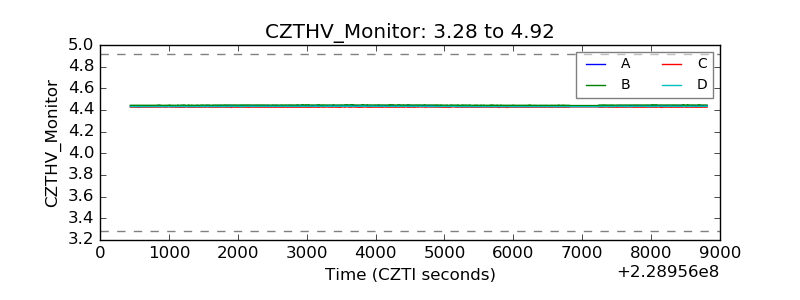 |
| D_VDD | 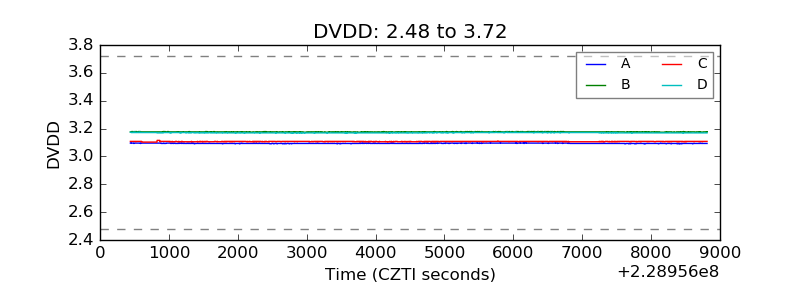 |
| Temperature 1 | 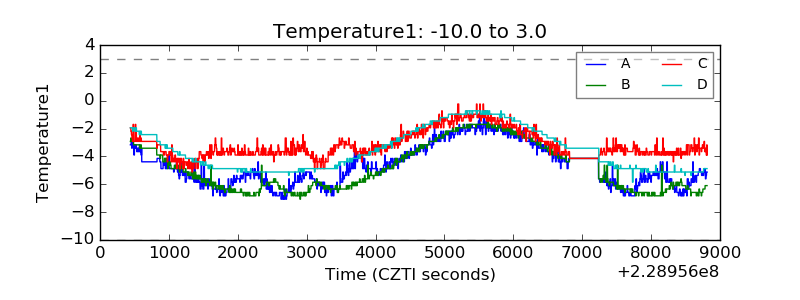 |
| Veto HV Monitor | 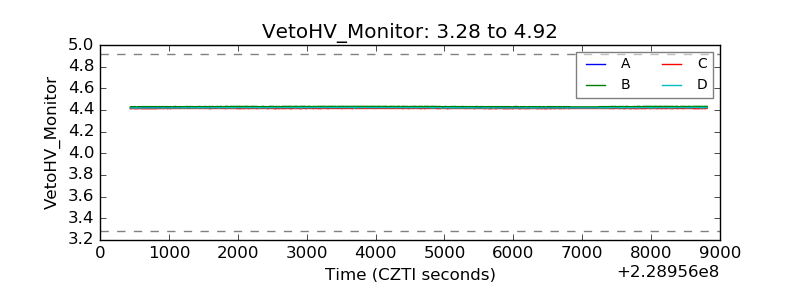 |
| Veto LLD | 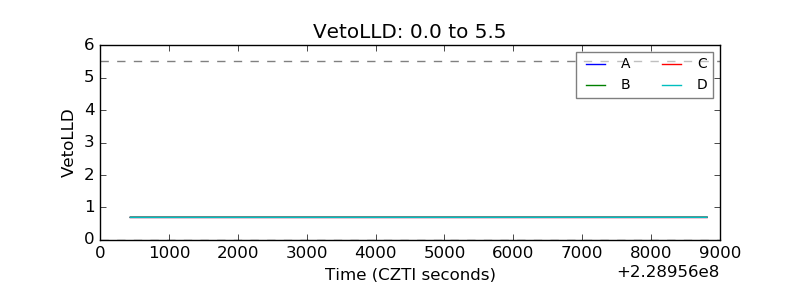 |
| Alpha Counter | 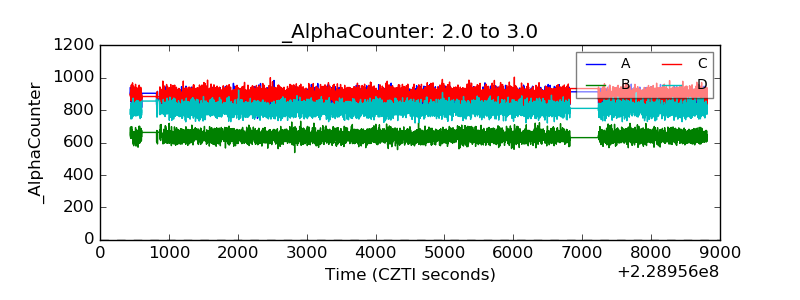 |
| _CPM_Rate | 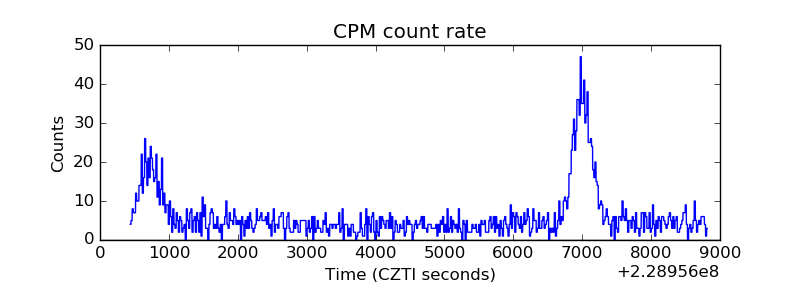 |
| CZT Counter | 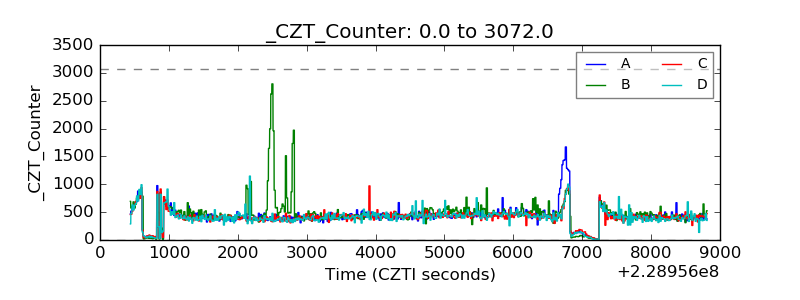 |
| +2.5 Volts monitor |  |
| +5 Volts monitor |  |
| _ROLL_ROT | 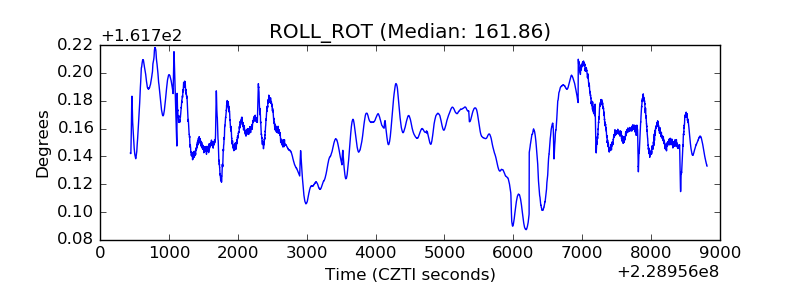 |
| _Roll_DEC | 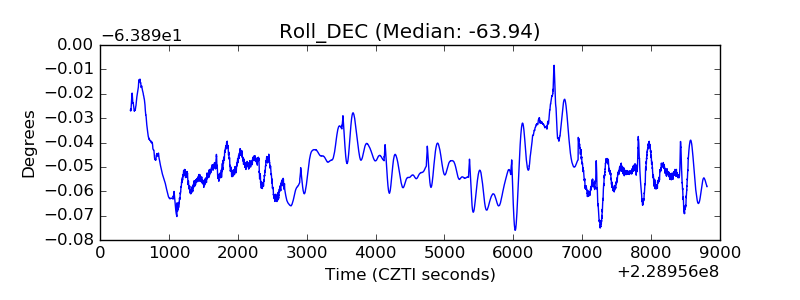 |
| _Roll_RA | 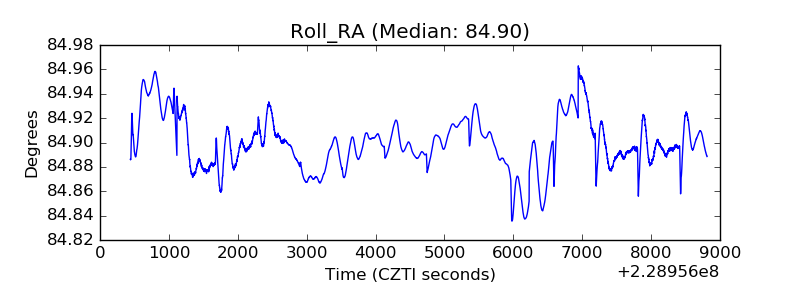 |
| Veto Counter | 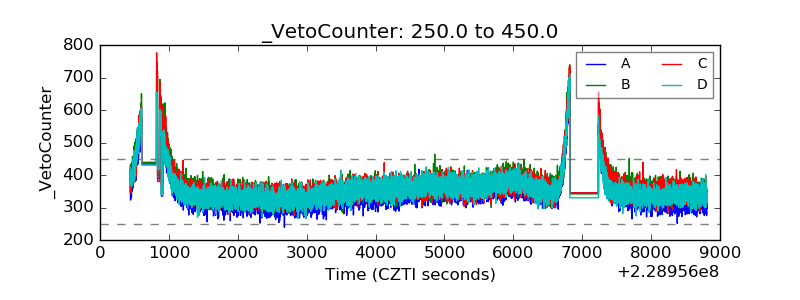 |