| Param | Original file | Final file |
|---|---|---|
| Filename | modeM0/AS1A03_106T01_9000001130_08200cztM0_level2.evt | modeM0/AS1A03_106T01_9000001130_08200cztM0_level2_quad_clean.evt |
| Size (bytes) | 353,986,560 | 86,005,440 |
| Size | 337.6 MB | 82.0 MB |
| Events in quadrant A | 2,624,362 | 554,670 |
| Events in quadrant B | 2,685,754 | 563,239 |
| Events in quadrant C | 2,453,191 | 553,554 |
| Events in quadrant D | 2,569,271 | 535,151 |
| Mode M0 | |||
|---|---|---|---|
| Quadrant | BADHDUFLAG | Total packets | Discarded packets |
| A | 0 | 11878 | 1 |
| B | 0 | 11844 | 1 |
| C | 0 | 11560 | 1 |
| D | 0 | 11791 | 3 |
| Mode M9 | |||
|---|---|---|---|
| Quadrant | BADHDUFLAG | Total packets | Discarded packets |
| A | 0 | 4 | 0 |
| B | 0 | 4 | 0 |
| C | 0 | 4 | 0 |
| D | 0 | 4 | 0 |
| Mode SS | |||
|---|---|---|---|
| Quadrant | BADHDUFLAG | Total packets | Discarded packets |
| A | 0 | 116 | 0 |
| B | 0 | 116 | 0 |
| C | 0 | 116 | 0 |
| D | 0 | 116 | 0 |
| Quadrant | Total seconds | Saturated seconds | Saturation percentage |
|---|---|---|---|
| A | 5691 | 84 | 1.476015% |
| B | 5691 | 74 | 1.300299% |
| C | 5691 | 46 | 0.808294% |
| D | 5690 | 48 | 0.843585% |
Noise dominated data is calculated using 1-second bins in cleaned event files. If a bin has >2000 counts, and if more than 50% of those come from <1% of pixels, then it is considered to be noise-dominated and hence unusable.
| Quadrant | # 1 sec bins | Bins with >0 counts | Bins with >2000 counts | High rate bins dominated by noise | Noise dominated (total time) | Noise dominated (detector-on time) | Marked lightcurve |
|---|---|---|---|---|---|---|---|
| A | 6106 | 5691 | 0 | 0 | 0.00% | 0.00% | 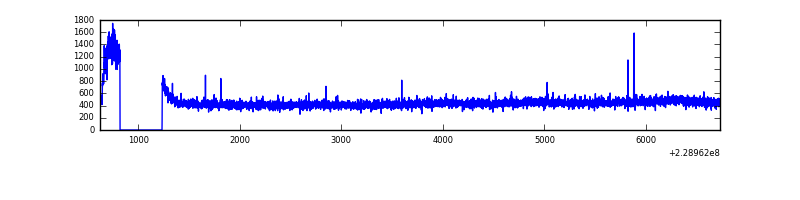 |
| B | 6106 | 5691 | 2 | 2 | 0.03% | 0.04% | 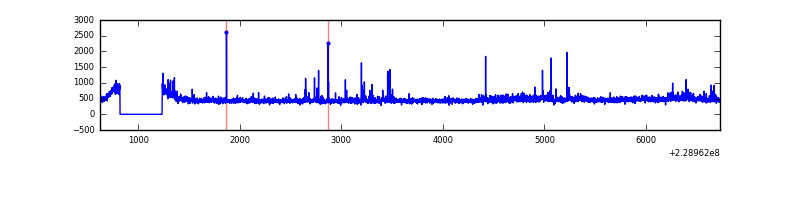 |
| C | 6106 | 5691 | 0 | 0 | 0.00% | 0.00% | 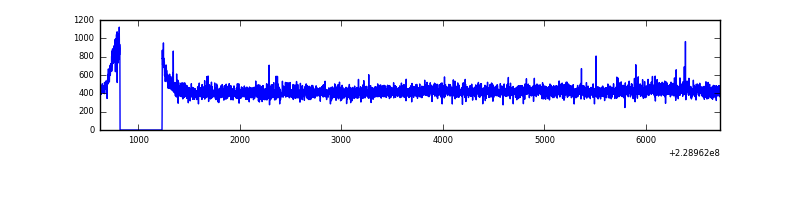 |
| D | 6106 | 5691 | 7 | 7 | 0.11% | 0.12% | 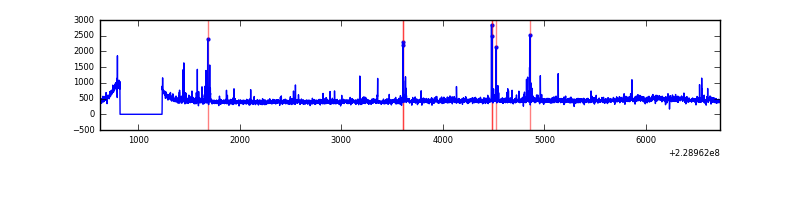 |
Top three noisy pixels from each quadrant. If the there are fewer than three noisy pixels in the level2.evt file, extra rows are filled as -1
| Pixel properties | Quadrant properties | ||||||
|---|---|---|---|---|---|---|---|
| Quadrant | DetID | PixID | Counts | Sigma | Mean | Median | Sigma |
| A | 15 | 79 | 106892 | 786.47 | 646 | 630 | 135.1 |
| A | 8 | 15 | 22788 | 164.0 | 646 | 630 | 135.1 |
| A | 0 | 128 | 6959 | 46.84 | 646 | 630 | 135.1 |
| B | 0 | 214 | 51582 | 404.92 | 651 | 635 | 125.8 |
| B | 4 | 81 | 45407 | 355.85 | 651 | 635 | 125.8 |
| B | 0 | 219 | 40934 | 320.29 | 651 | 635 | 125.8 |
| C | 13 | 61 | 4856 | 28.7 | 628 | 629 | 147.3 |
| C | 3 | 202 | 1483 | 5.8 | 628 | 629 | 147.3 |
| C | 4 | 191 | 1389 | 5.16 | 628 | 629 | 147.3 |
| D | 1 | 52 | 68927 | 444.08 | 627 | 608 | 153.8 |
| D | 6 | 225 | 32601 | 207.96 | 627 | 608 | 153.8 |
| D | 1 | 7 | 23707 | 150.15 | 627 | 608 | 153.8 |
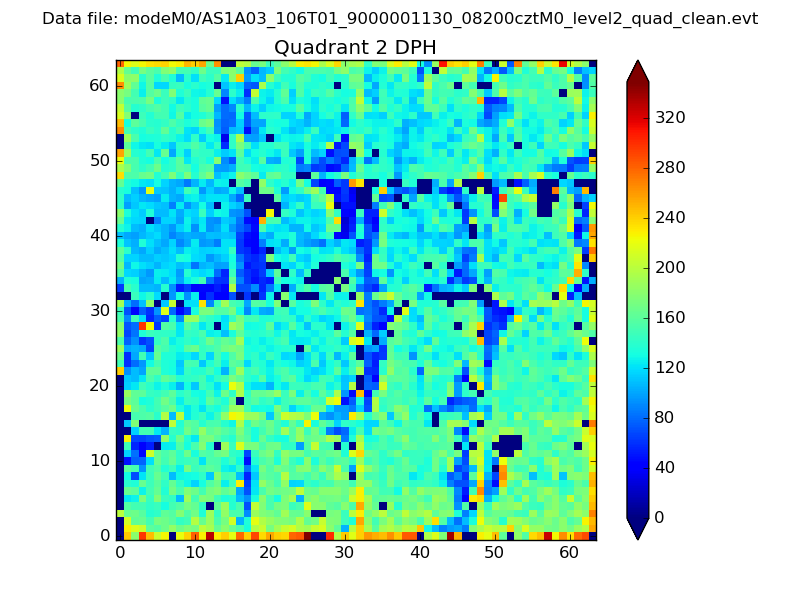
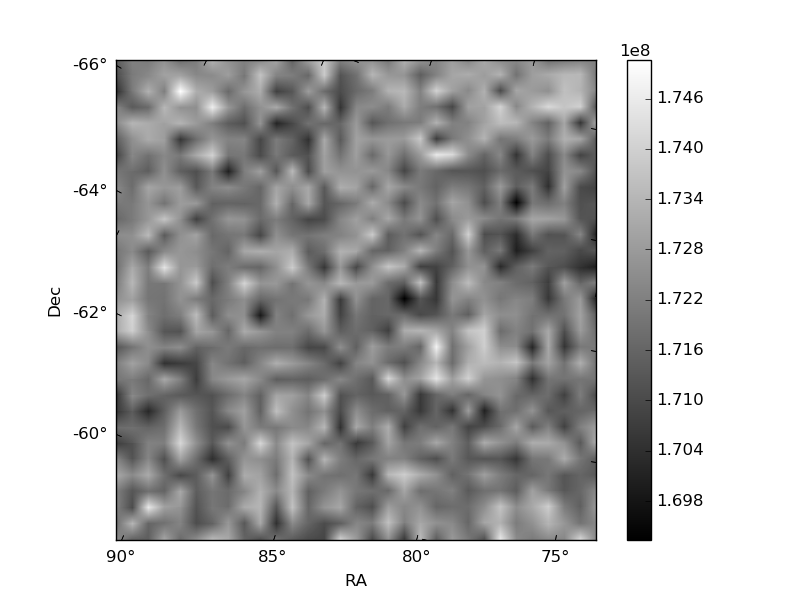
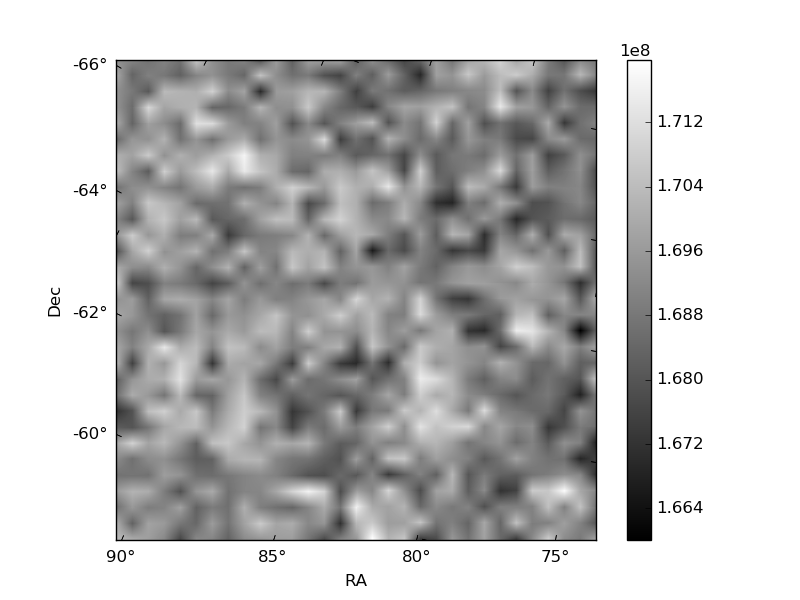
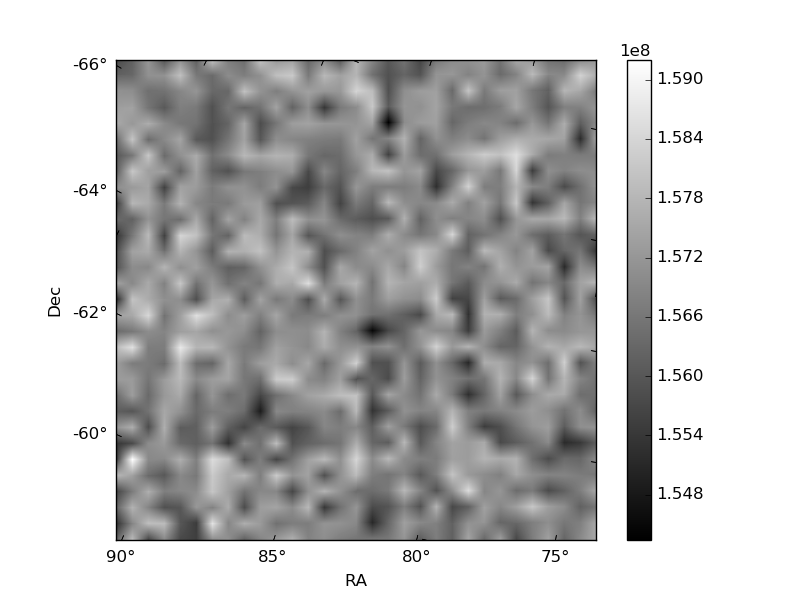
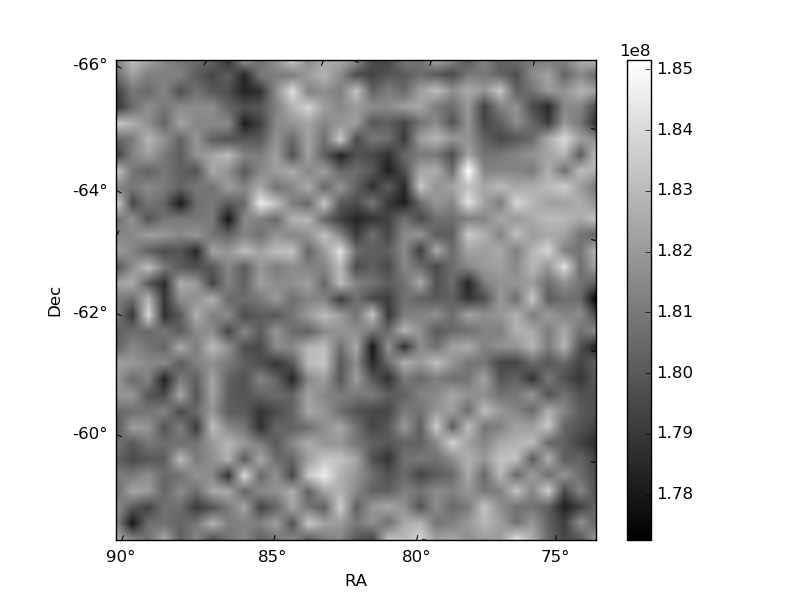
Histogram calculated using DETX and DETY for each event in the final _common_clean file
| Quadrant A | 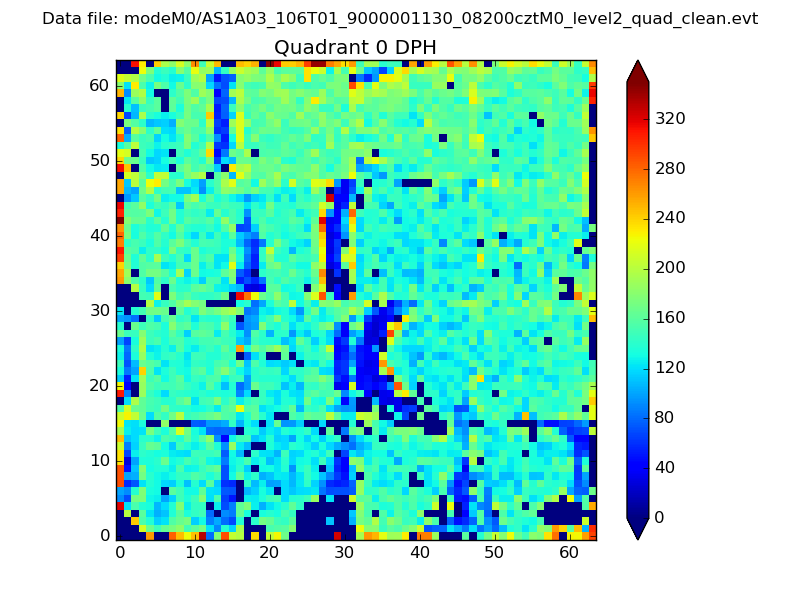 |
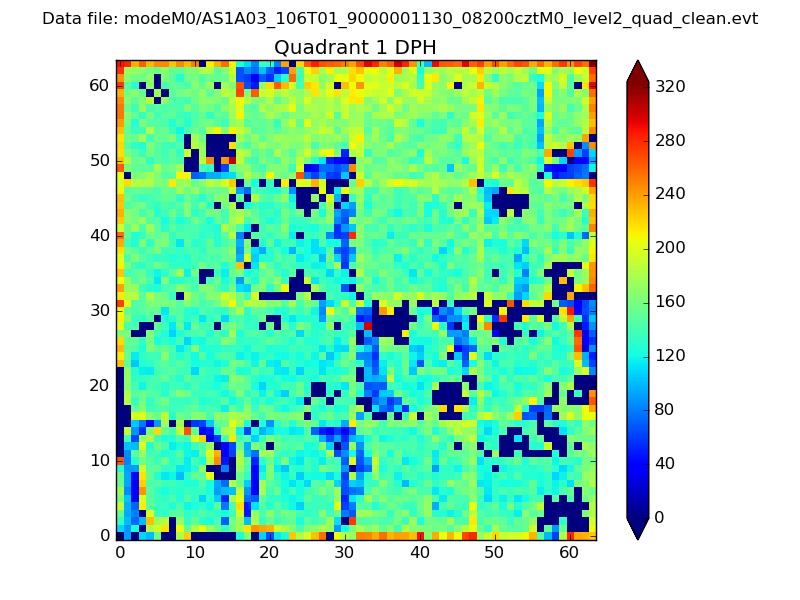 |
Quadrant B |
|---|---|---|---|
| Quadrant D | 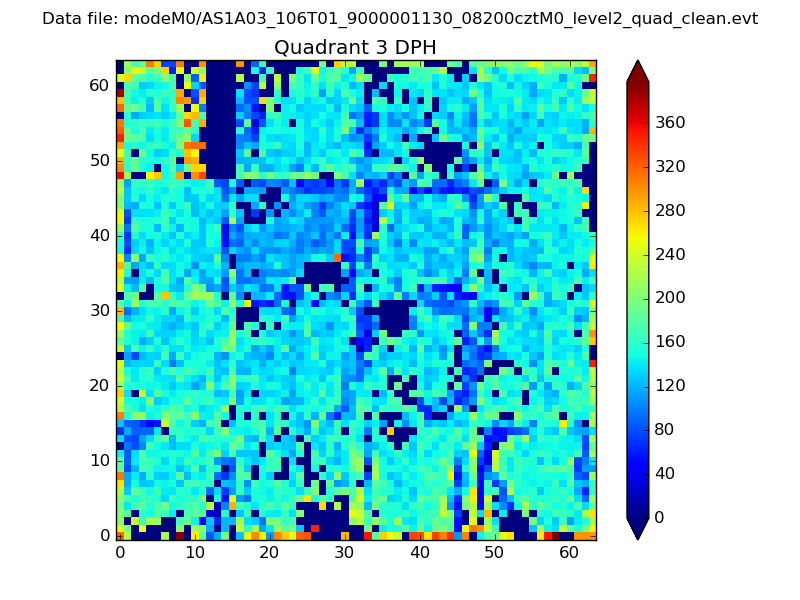 |
 |
Quadrant C |
| Plot type | Count rate plots | Images |
|---|---|---|
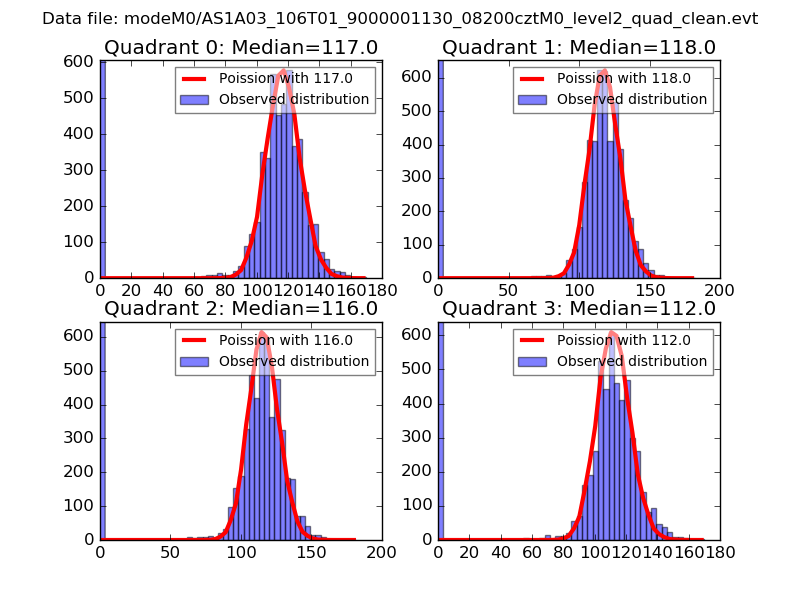
| Comparison with Poisson distribution Blue bars denote a histogram of data divided into 1 sec bins. Red curve is a Poisson curve with rate = median count rate of data. |
 |
 |
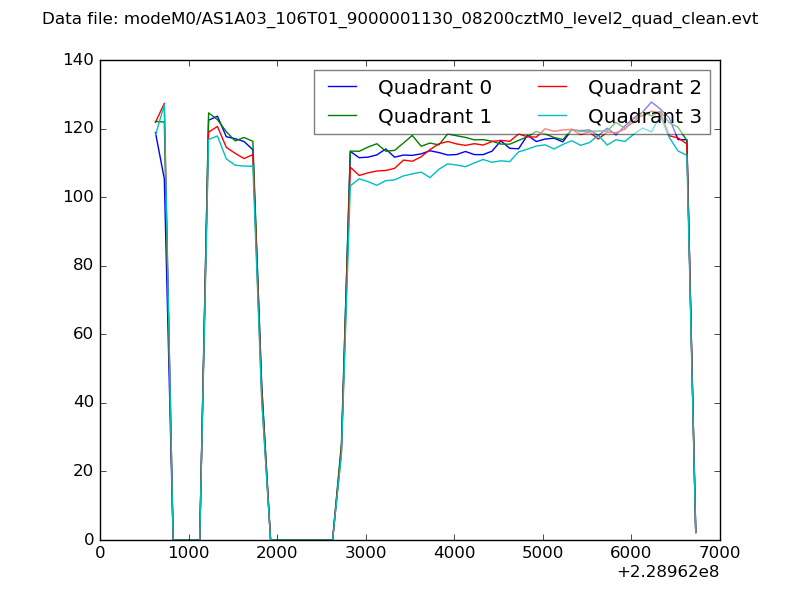
| Quadrant-wise count rates Data is divided into 100 sec bins |
 |
|
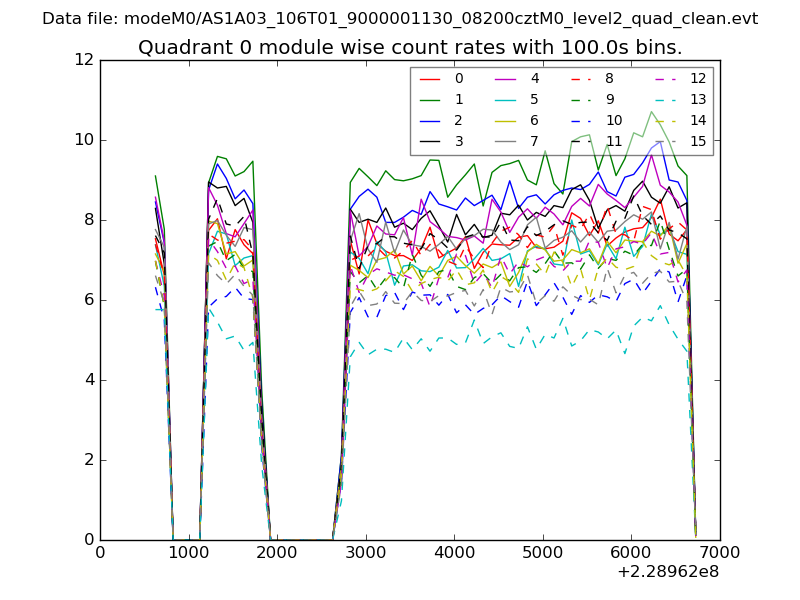
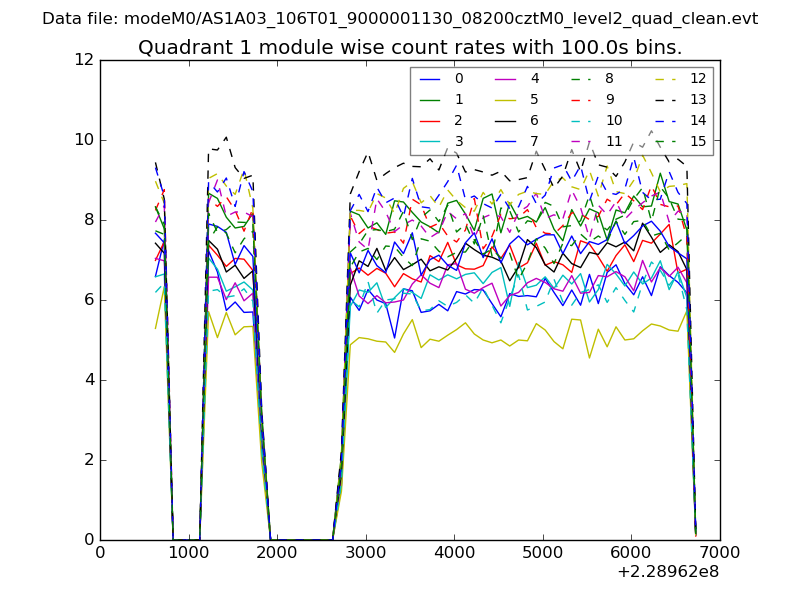
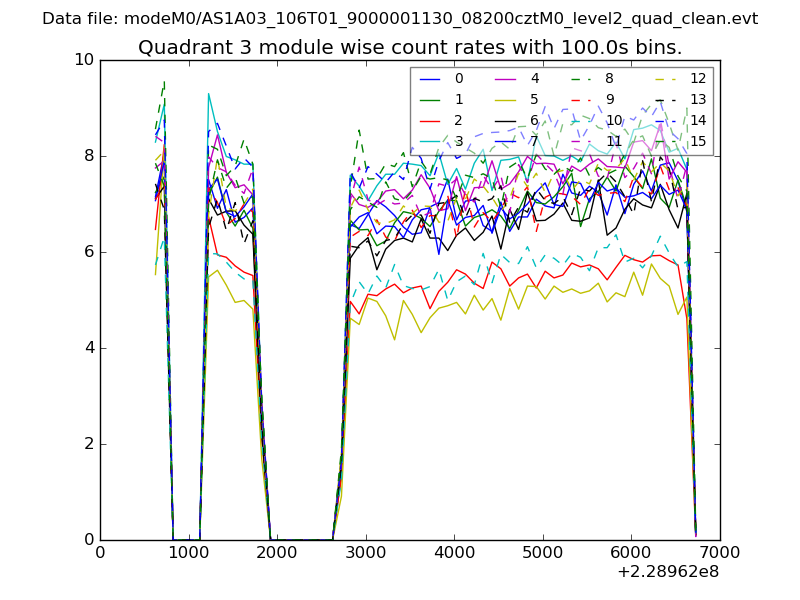
| Module-wise count rates for Quadrant A Data is divided into 100 sec bins |
 |
 |
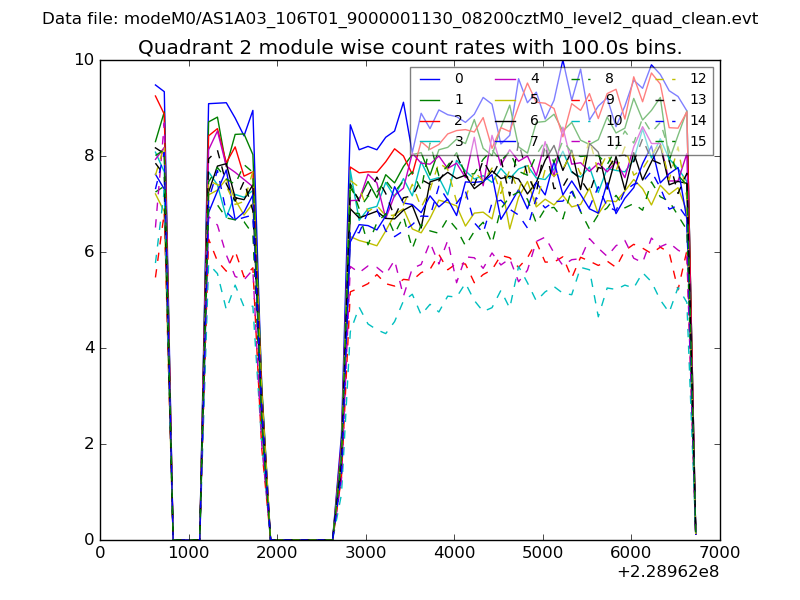
| Module-wise count rates for Quadrant B Data is divided into 100 sec bins |
 |
 |
| Module-wise count rates for Quadrant C Data is divided into 100 sec bins |
 |
 |
| Module-wise count rates for Quadrant D Data is divided into 100 sec bins |
 |
 |
| Parameter | Plot |
|---|---|
| CZT HV Monitor | 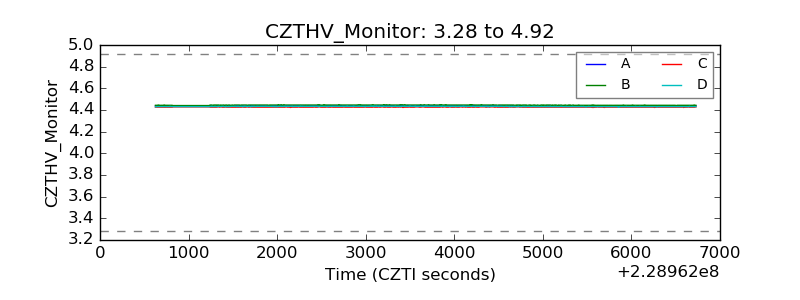 |
| D_VDD | 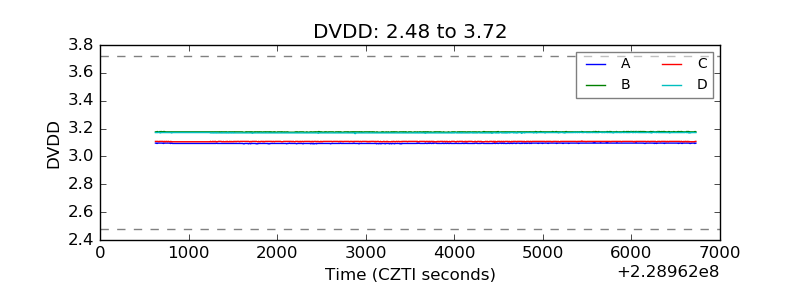 |
| Temperature 1 | 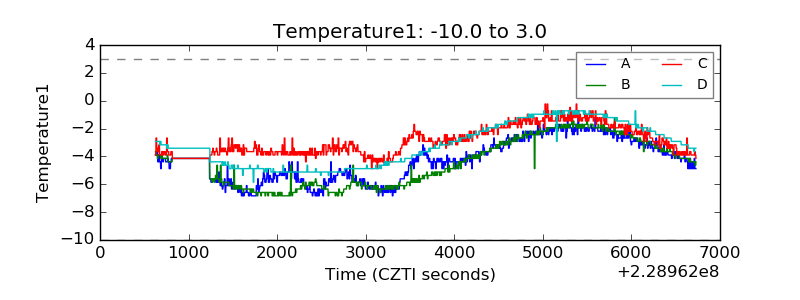 |
| Veto HV Monitor | 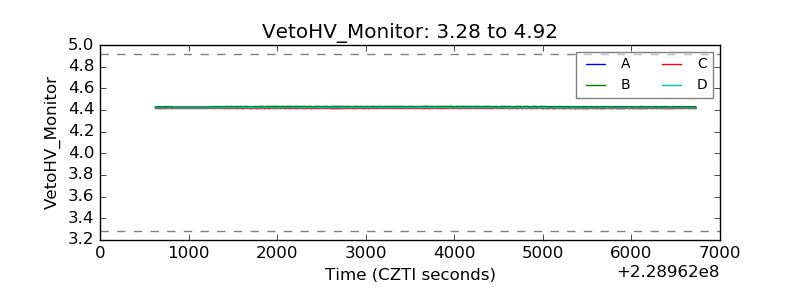 |
| Veto LLD | 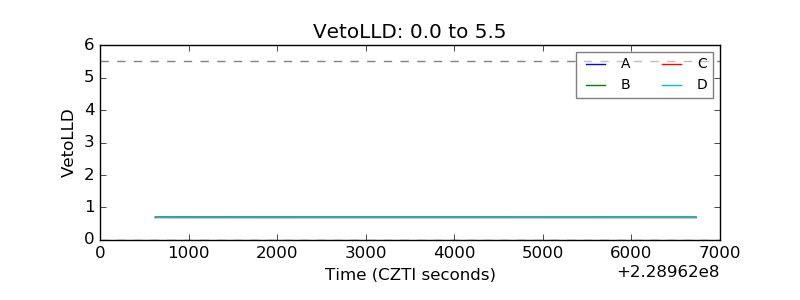 |
| Alpha Counter | 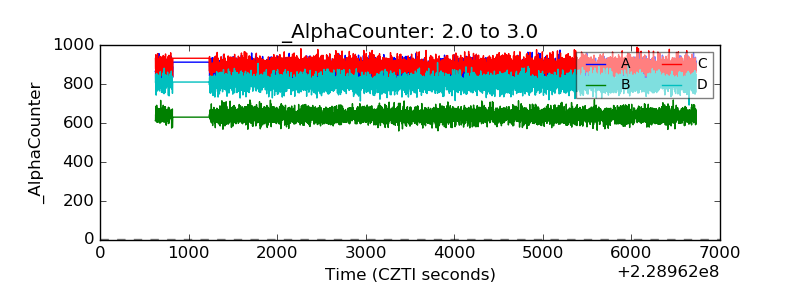 |
| _CPM_Rate | 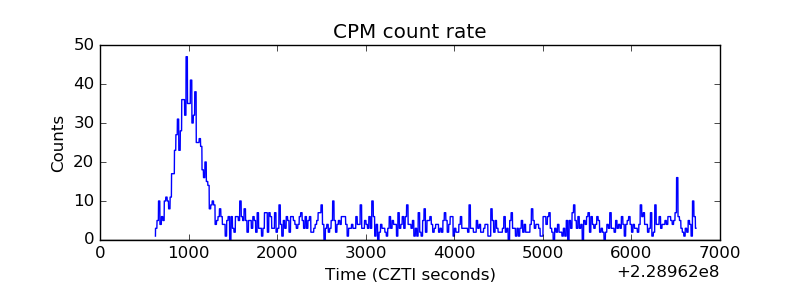 |
| CZT Counter | 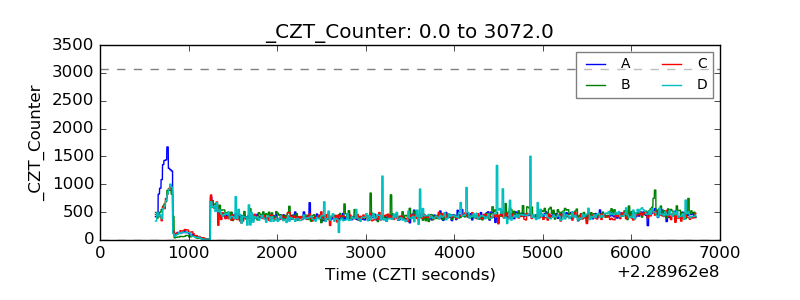 |
| +2.5 Volts monitor | 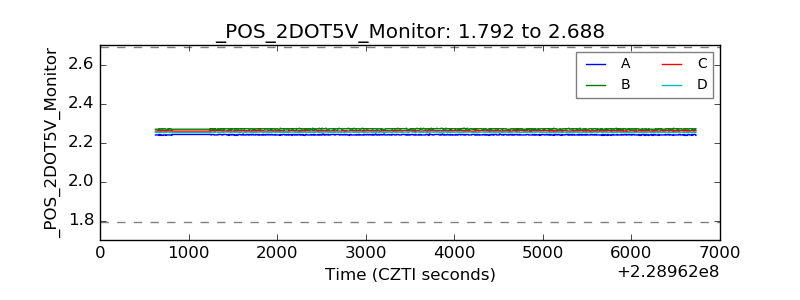 |
| +5 Volts monitor |  |
| _ROLL_ROT | 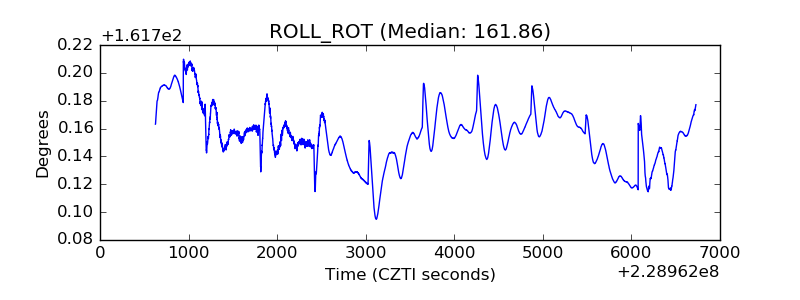 |
| _Roll_DEC | 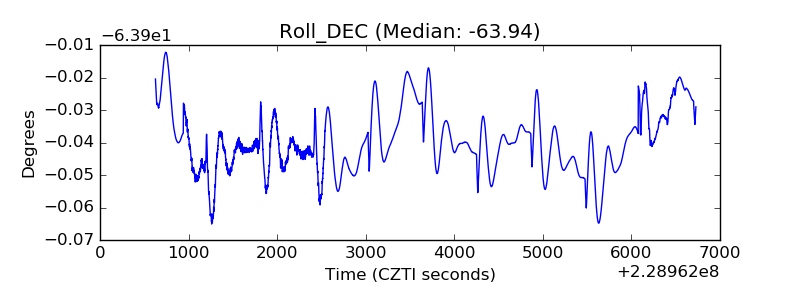 |
| _Roll_RA | 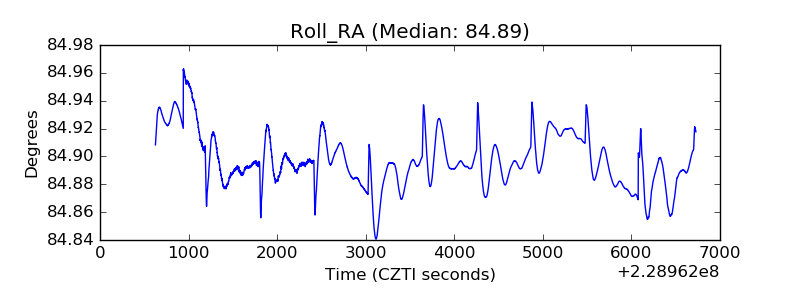 |
| Veto Counter | 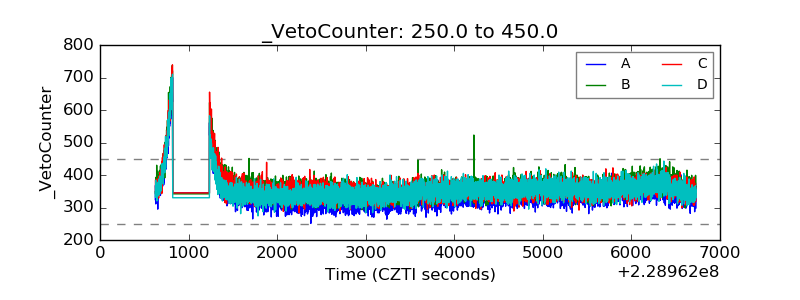 |