| Param | Original file | Final file |
|---|---|---|
| Filename | modeM0/AS1A03_103T01_9000001132cztM0_level2.fits | modeM0/AS1A03_103T01_9000001132cztM0_level2_quad_clean.evt |
| Size (bytes) | 407,952,000 | 557,130,240 |
| Size | 389.1 MB | 531.3 MB |
| Events in quadrant A | 2,483,558 | 3,640,202 |
| Events in quadrant B | 2,397,622 | 3,641,099 |
| Events in quadrant C | 2,425,920 | 3,468,159 |
| Events in quadrant D | 2,042,060 | 3,120,549 |
| Mode M9 | |||
|---|---|---|---|
| Quadrant | BADHDUFLAG | Total packets | Discarded packets |
| A | 0 | 87 | 0 |
| B | 0 | 87 | 0 |
| C | 0 | 87 | 0 |
| D | 0 | 87 | 0 |
| Mode M0 | |||
|---|---|---|---|
| Quadrant | BADHDUFLAG | Total packets | Discarded packets |
| A | 0 | 90962 | 0 |
| B | 0 | 92816 | 0 |
| C | 0 | 89510 | 0 |
| D | 0 | 108229 | 0 |
| Mode SS | |||
|---|---|---|---|
| Quadrant | BADHDUFLAG | Total packets | Discarded packets |
| A | 0 | 892 | 0 |
| B | 0 | 892 | 0 |
| C | 0 | 892 | 0 |
| D | 0 | 892 | 0 |
| Quadrant | Total seconds | Saturated seconds | Saturation percentage |
|---|---|---|---|
| A | 43773 | 604 | 1.379846% |
| B | 43772 | 642 | 1.466691% |
| C | 43773 | 409 | 0.934366% |
| D | 43773 | 2310 | 5.277226% |
Noise dominated data is calculated using 1-second bins in cleaned event files. If a bin has >2000 counts, and if more than 50% of those come from <1% of pixels, then it is considered to be noise-dominated and hence unusable.
| Quadrant | # 1 sec bins | Bins with >0 counts | Bins with >2000 counts | High rate bins dominated by noise | Noise dominated (total time) | Noise dominated (detector-on time) | Marked lightcurve |
|---|---|---|---|---|---|---|---|
| A | 52237 | 43758 | 0 | 0 | 0.00% | 0.00% | 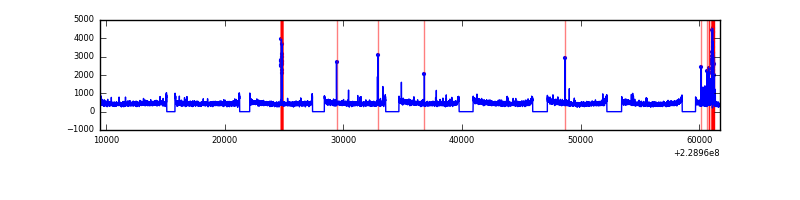 |
| B | 52237 | 43766 | 0 | 0 | 0.00% | 0.00% | 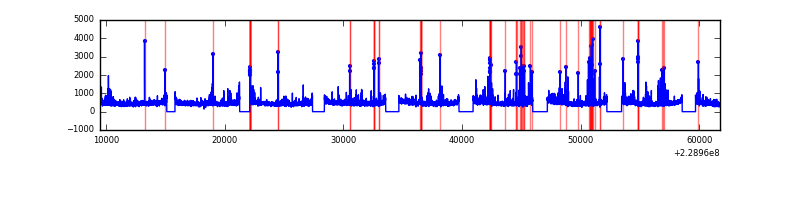 |
| C | 52237 | 43767 | 0 | 0 | 0.00% | 0.00% |  |
| D | 52237 | 43612 | 0 | 0 | 0.00% | 0.00% |  |
Top three noisy pixels from each quadrant. If the there are fewer than three noisy pixels in the level2.evt file, extra rows are filled as -1
| Pixel properties | Quadrant properties | ||||||
|---|---|---|---|---|---|---|---|
| Quadrant | DetID | PixID | Counts | Sigma | Mean | Median | Sigma |
| A | 0 | 29 | 2431 | 11.21 | 646 | 608 | 162.6 |
| A | 7 | 110 | 2064 | 8.96 | 646 | 608 | 162.6 |
| A | 0 | 30 | 1901 | 7.95 | 646 | 608 | 162.6 |
| B | 2 | 9 | 2099 | 11.98 | 633 | 606 | 124.7 |
| B | 14 | 254 | 1641 | 8.3 | 633 | 606 | 124.7 |
| B | 12 | 226 | 1606 | 8.02 | 633 | 606 | 124.7 |
| C | 1 | 80 | 1860 | 7.65 | 639 | 595 | 165.4 |
| C | 1 | 81 | 1839 | 7.52 | 639 | 595 | 165.4 |
| C | 12 | 241 | 1749 | 6.98 | 639 | 595 | 165.4 |
| D | 1 | 19 | 1502 | 6.24 | 581 | 529 | 155.8 |
| D | 7 | 5 | 1458 | 5.96 | 581 | 529 | 155.8 |
| D | 6 | 231 | 1447 | 5.89 | 581 | 529 | 155.8 |
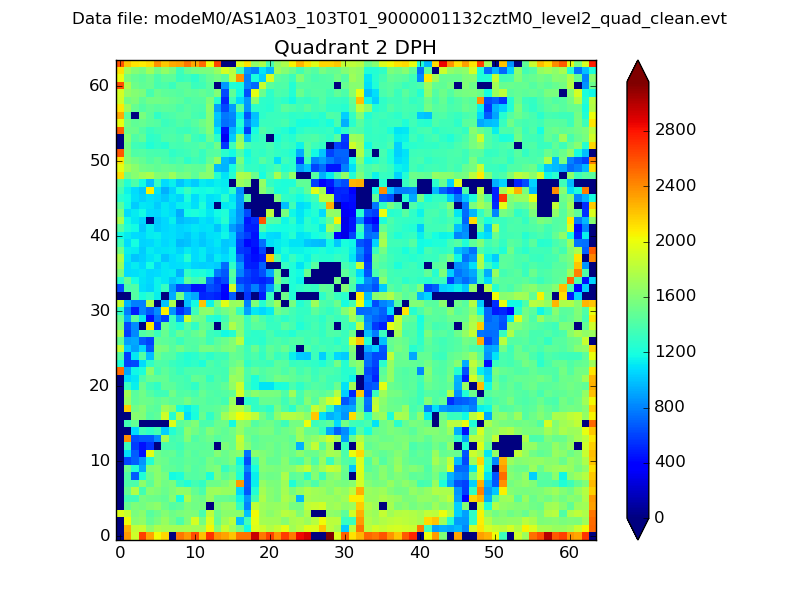
Histogram calculated using DETX and DETY for each event in the final _common_clean file
| Quadrant A | 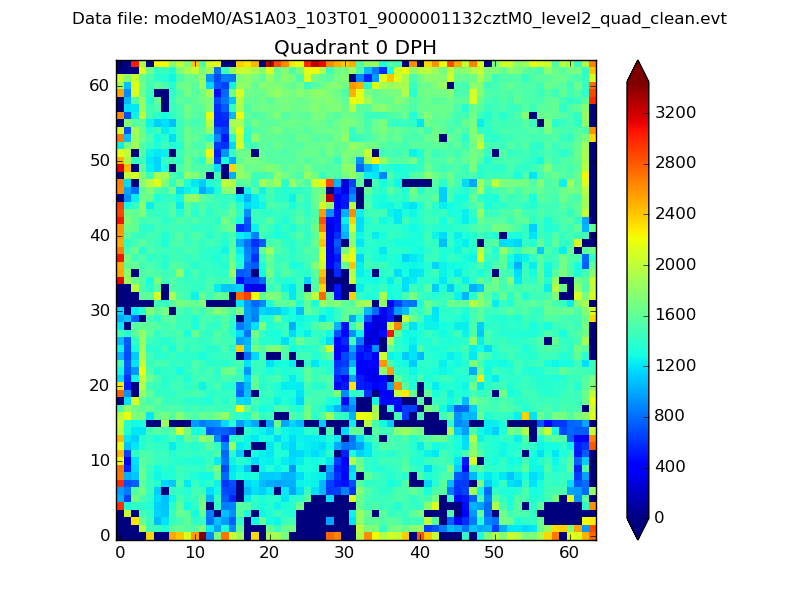 |
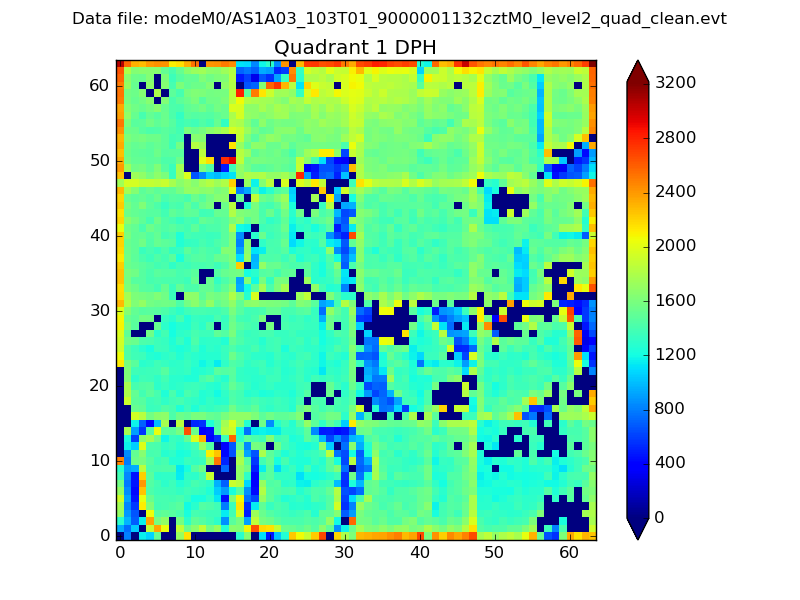 |
Quadrant B |
|---|---|---|---|
| Quadrant D | 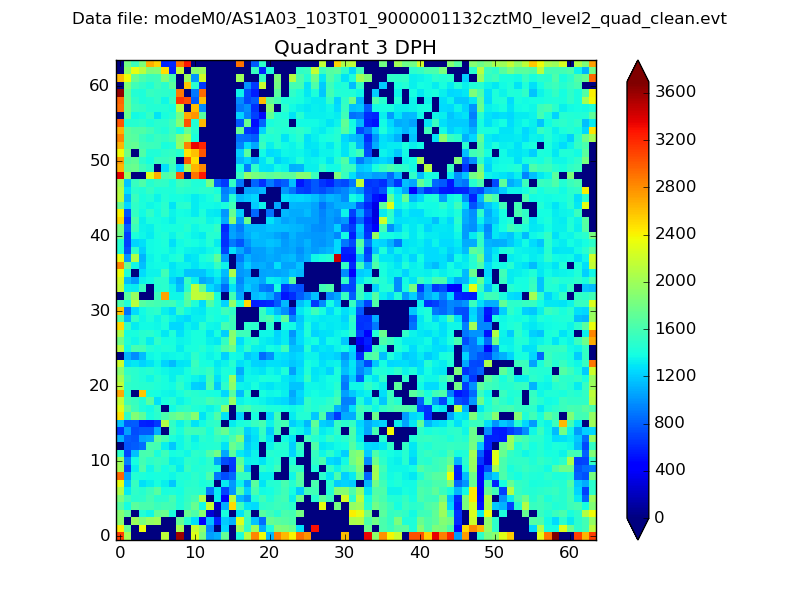 |
 |
Quadrant C |
| Plot type | Count rate plots | Images |
|---|---|---|
| Comparison with Poisson distribution Blue bars denote a histogram of data divided into 1 sec bins. Red curve is a Poisson curve with rate = median count rate of data. |
 |
 |
| Quadrant-wise count rates Data is divided into 100 sec bins |
 |
|
| Module-wise count rates for Quadrant A Data is divided into 100 sec bins |
 |
 |
| Module-wise count rates for Quadrant B Data is divided into 100 sec bins |
 |
 |
| Module-wise count rates for Quadrant C Data is divided into 100 sec bins |
 |
 |
| Module-wise count rates for Quadrant D Data is divided into 100 sec bins |
 |
 |
| Parameter | Plot |
|---|---|
| CZT HV Monitor | 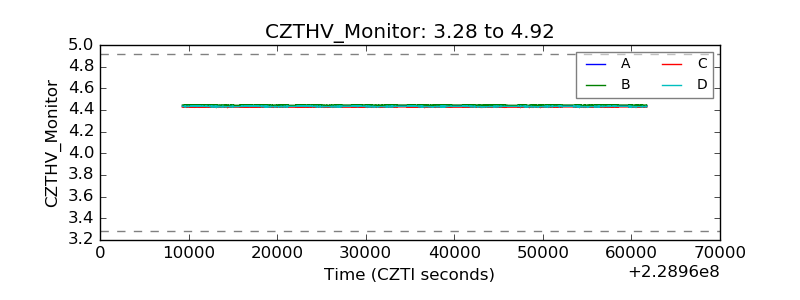 |
| D_VDD | 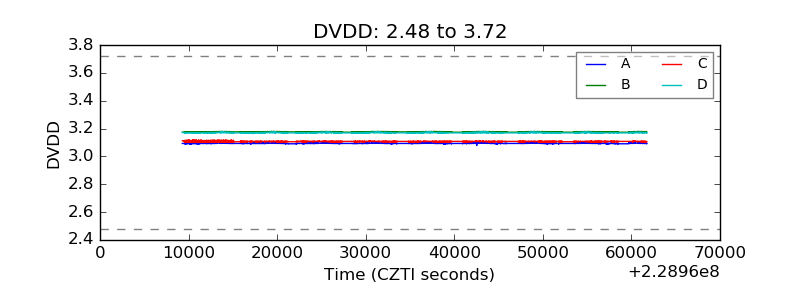 |
| Temperature 1 |  |
| Veto HV Monitor |  |
| Veto LLD |  |
| Alpha Counter | 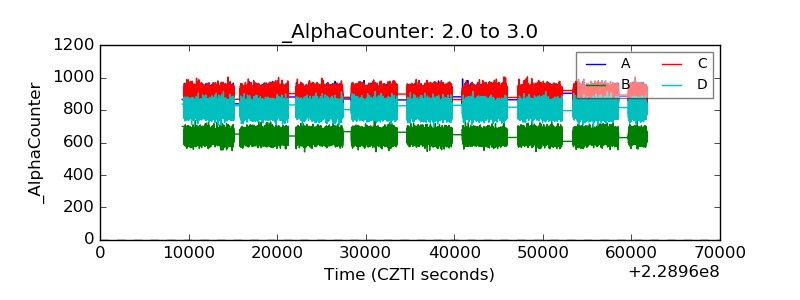 |
| _CPM_Rate | 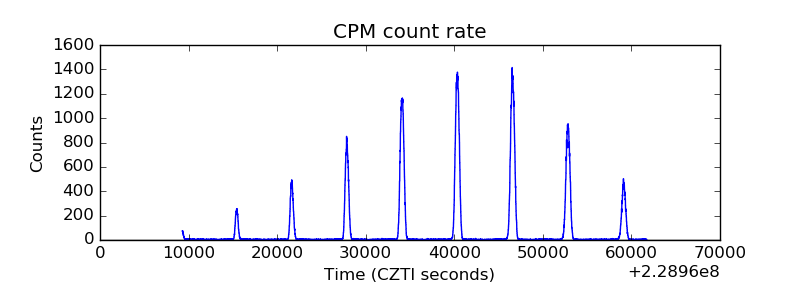 |
| CZT Counter | 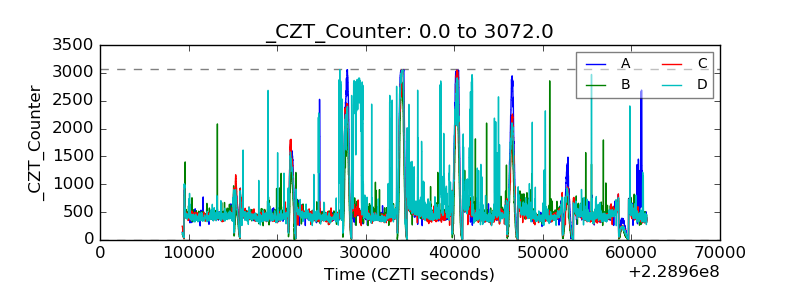 |
| +2.5 Volts monitor |  |
| +5 Volts monitor |  |
| _ROLL_ROT |  |
| _Roll_DEC |  |
| _Roll_RA | 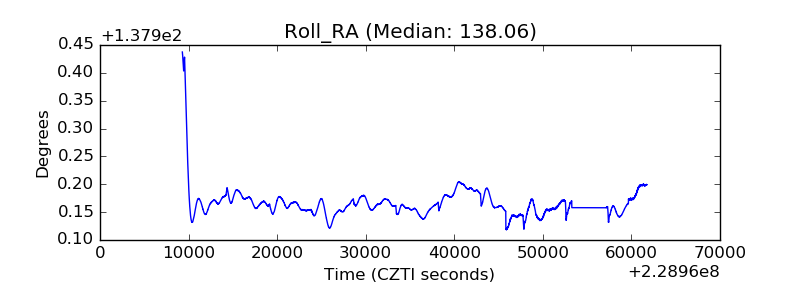 |
| Veto Counter |  |