| Param | Original file | Final file |
|---|---|---|
| Filename | modeM0/AS1A03_103T01_9000001132_08204cztM0_level2.evt | modeM0/AS1A03_103T01_9000001132_08204cztM0_level2_quad_clean.evt |
| Size (bytes) | 451,797,120 | 112,769,280 |
| Size | 430.9 MB | 107.5 MB |
| Events in quadrant A | 2,792,351 | 775,220 |
| Events in quadrant B | 2,969,757 | 785,507 |
| Events in quadrant C | 2,713,240 | 772,734 |
| Events in quadrant D | 4,799,661 | 663,038 |
| Mode M9 | |||
|---|---|---|---|
| Quadrant | BADHDUFLAG | Total packets | Discarded packets |
| A | 0 | 11 | 0 |
| B | 0 | 11 | 0 |
| C | 0 | 11 | 0 |
| D | 0 | 11 | 0 |
| Mode M0 | |||
|---|---|---|---|
| Quadrant | BADHDUFLAG | Total packets | Discarded packets |
| A | 0 | 12389 | 2 |
| B | 0 | 12660 | 1 |
| C | 0 | 12315 | 1 |
| D | 0 | 18619 | 1 |
| Mode SS | |||
|---|---|---|---|
| Quadrant | BADHDUFLAG | Total packets | Discarded packets |
| A | 0 | 122 | 0 |
| B | 0 | 122 | 0 |
| C | 0 | 122 | 0 |
| D | 0 | 122 | 0 |
| Quadrant | Total seconds | Saturated seconds | Saturation percentage |
|---|---|---|---|
| A | 5994 | 65 | 1.084418% |
| B | 5994 | 65 | 1.084418% |
| C | 5994 | 47 | 0.784117% |
| D | 5994 | 810 | 13.513514% |
Noise dominated data is calculated using 1-second bins in cleaned event files. If a bin has >2000 counts, and if more than 50% of those come from <1% of pixels, then it is considered to be noise-dominated and hence unusable.
| Quadrant | # 1 sec bins | Bins with >0 counts | Bins with >2000 counts | High rate bins dominated by noise | Noise dominated (total time) | Noise dominated (detector-on time) | Marked lightcurve |
|---|---|---|---|---|---|---|---|
| A | 7109 | 5994 | 2 | 2 | 0.03% | 0.03% | 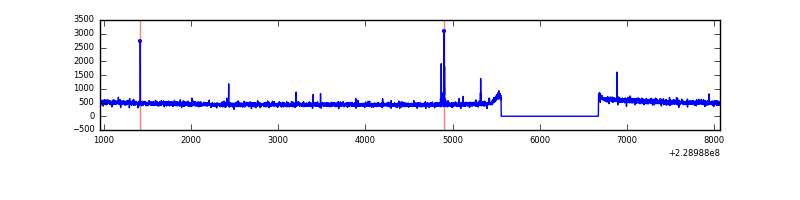 |
| B | 7109 | 5994 | 8 | 8 | 0.11% | 0.13% | 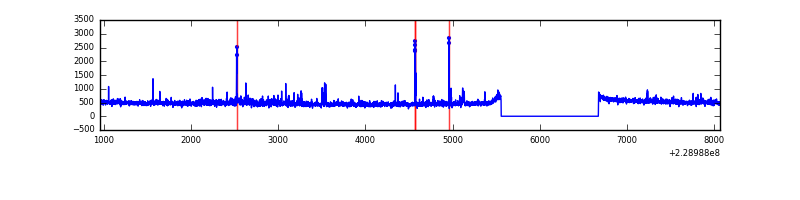 |
| C | 7109 | 5994 | 0 | 0 | 0.00% | 0.00% | 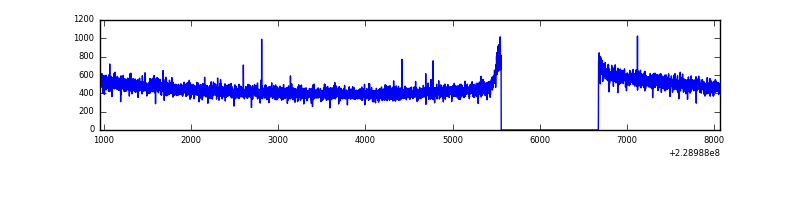 |
| D | 7109 | 5994 | 714 | 714 | 10.04% | 11.91% | 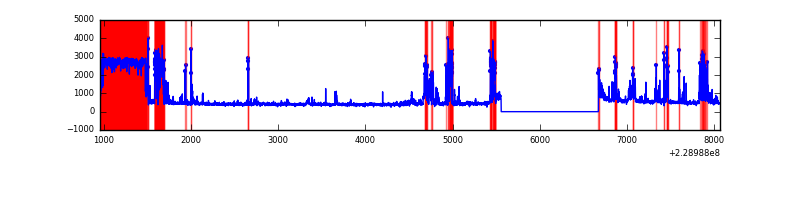 |
Top three noisy pixels from each quadrant. If the there are fewer than three noisy pixels in the level2.evt file, extra rows are filled as -1
| Pixel properties | Quadrant properties | ||||||
|---|---|---|---|---|---|---|---|
| Quadrant | DetID | PixID | Counts | Sigma | Mean | Median | Sigma |
| A | 5 | 16 | 21536 | 143.41 | 719 | 705 | 145.3 |
| A | 0 | 226 | 6680 | 41.14 | 719 | 705 | 145.3 |
| A | 12 | 194 | 6583 | 40.47 | 719 | 705 | 145.3 |
| B | 0 | 214 | 102612 | 758.38 | 717 | 700 | 134.4 |
| B | 10 | 16 | 46138 | 338.13 | 717 | 700 | 134.4 |
| B | 4 | 81 | 20534 | 147.59 | 717 | 700 | 134.4 |
| C | 13 | 61 | 5333 | 29.18 | 695 | 698 | 158.8 |
| C | 3 | 202 | 1797 | 6.92 | 695 | 698 | 158.8 |
| C | 12 | 4 | 1672 | 6.13 | 695 | 698 | 158.8 |
| D | 1 | 52 | 2296861 | 14809.73 | 632 | 611 | 155.1 |
| D | 13 | 122 | 48721 | 310.28 | 632 | 611 | 155.1 |
| D | 13 | 137 | 24459 | 153.81 | 632 | 611 | 155.1 |
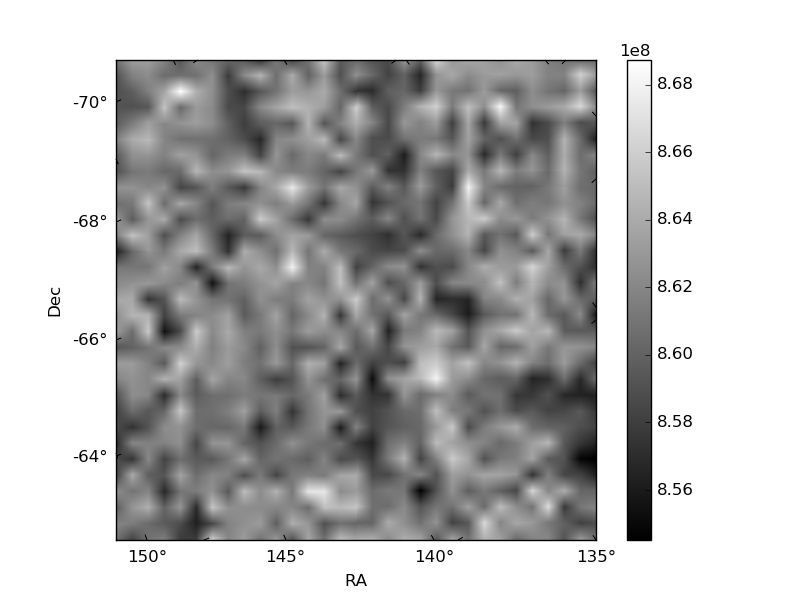
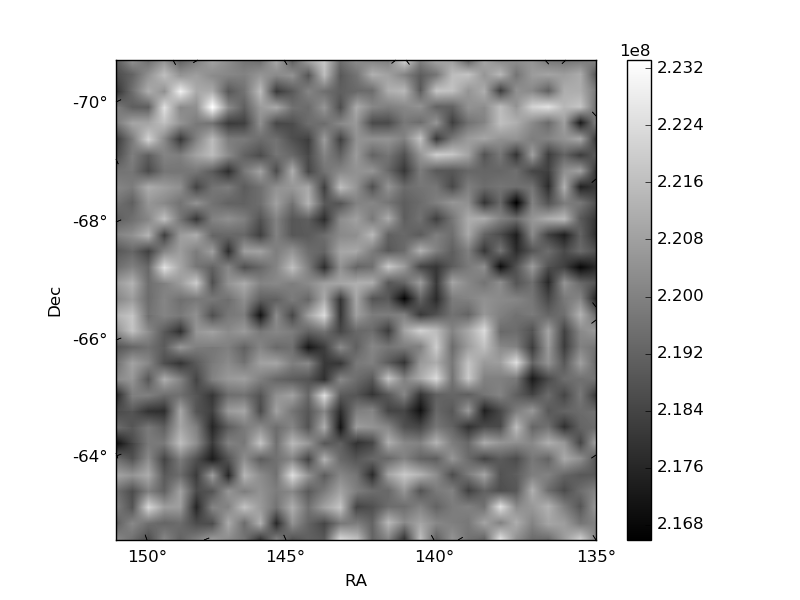
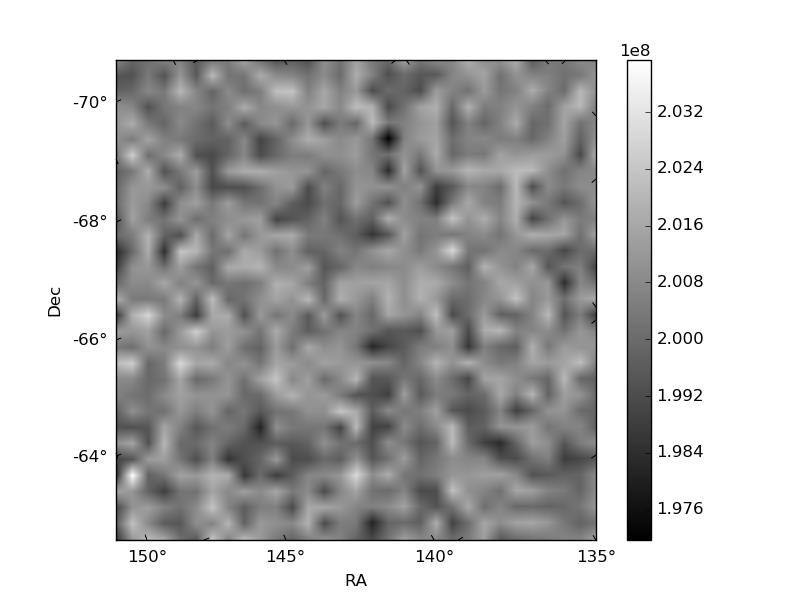
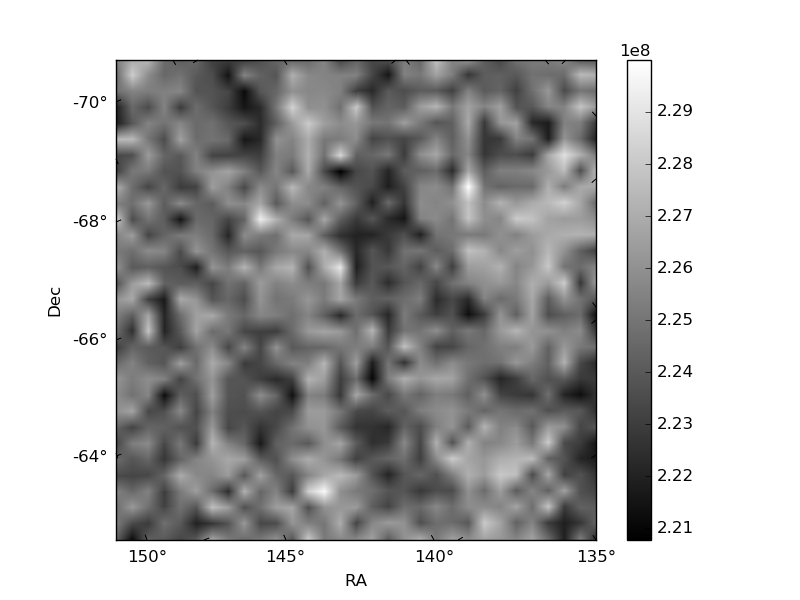
Histogram calculated using DETX and DETY for each event in the final _common_clean file
| Quadrant A | 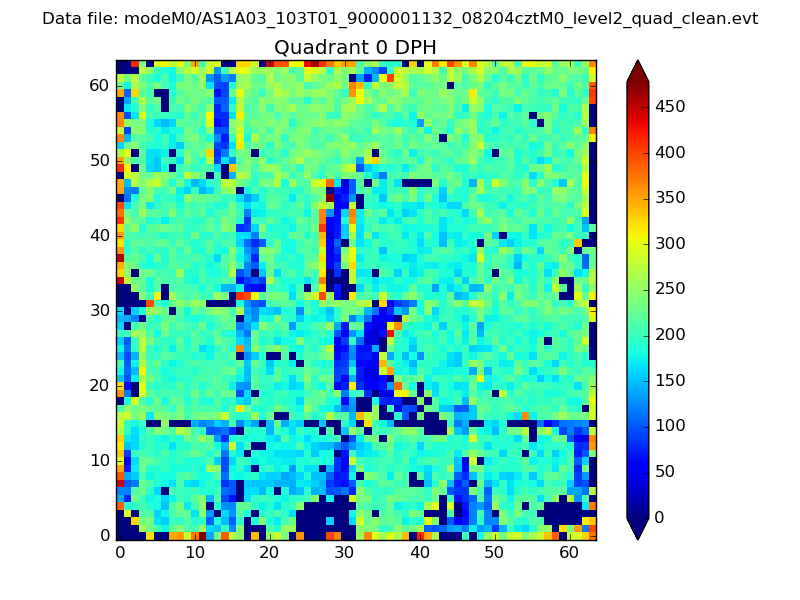 |
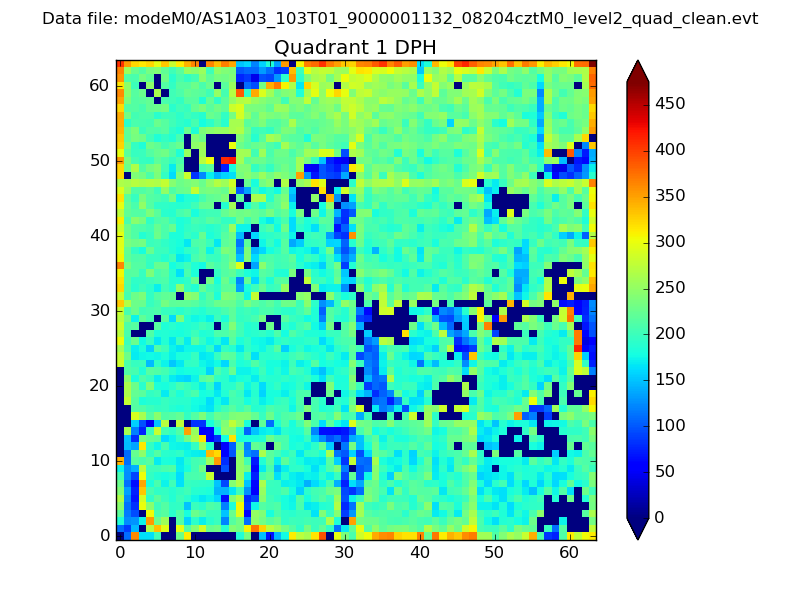 |
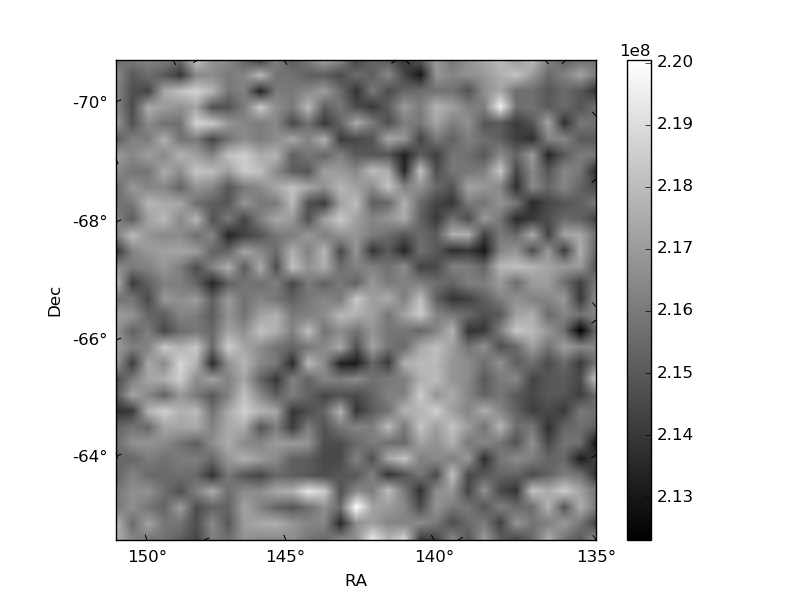
Quadrant B |
|---|---|---|---|
| Quadrant D | 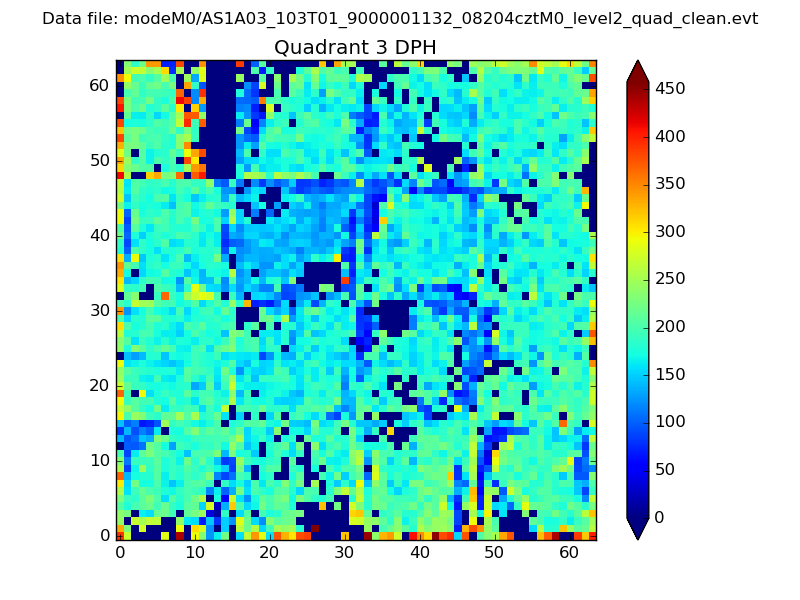 |
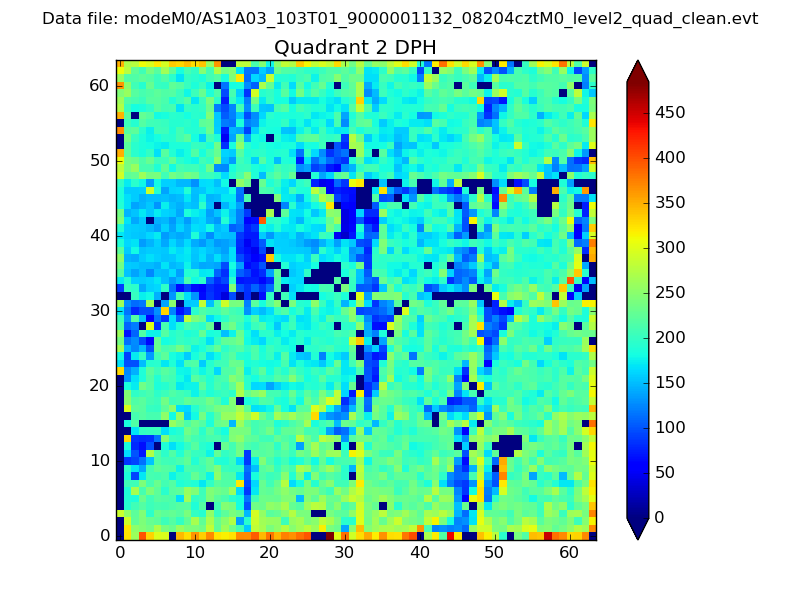 |
Quadrant C |
| Plot type | Count rate plots | Images |
|---|---|---|
| Comparison with Poisson distribution Blue bars denote a histogram of data divided into 1 sec bins. Red curve is a Poisson curve with rate = median count rate of data. |
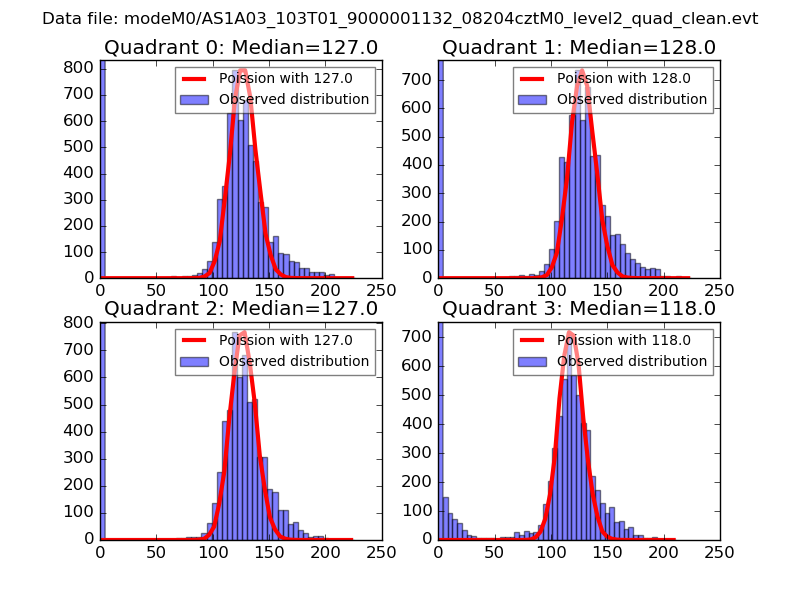 |
 |
| Quadrant-wise count rates Data is divided into 100 sec bins |
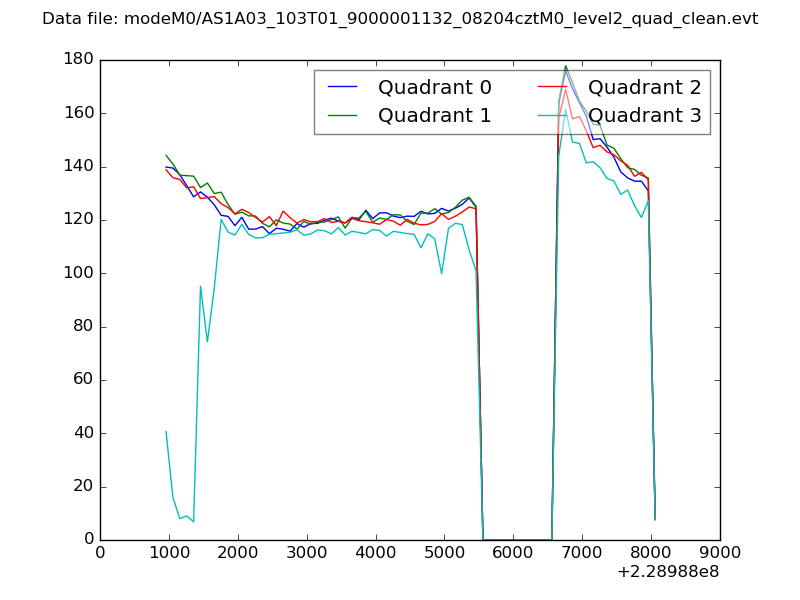 |
|
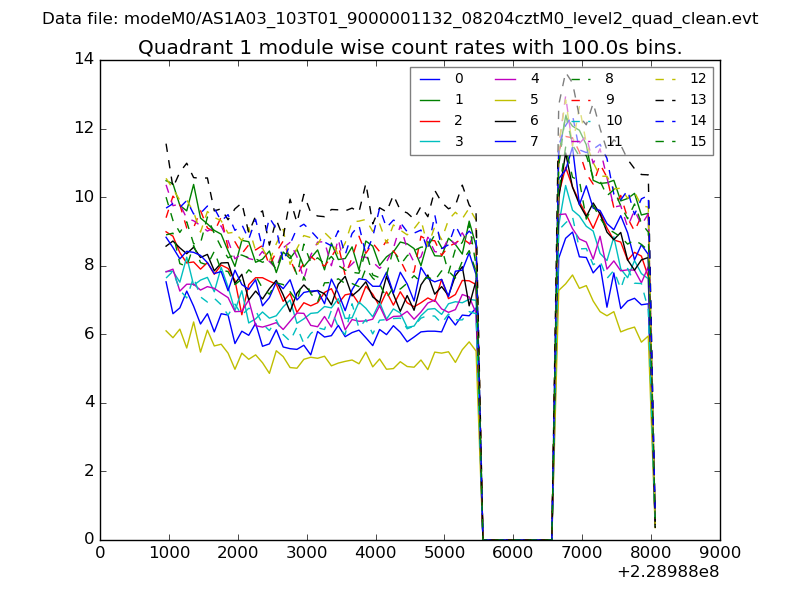
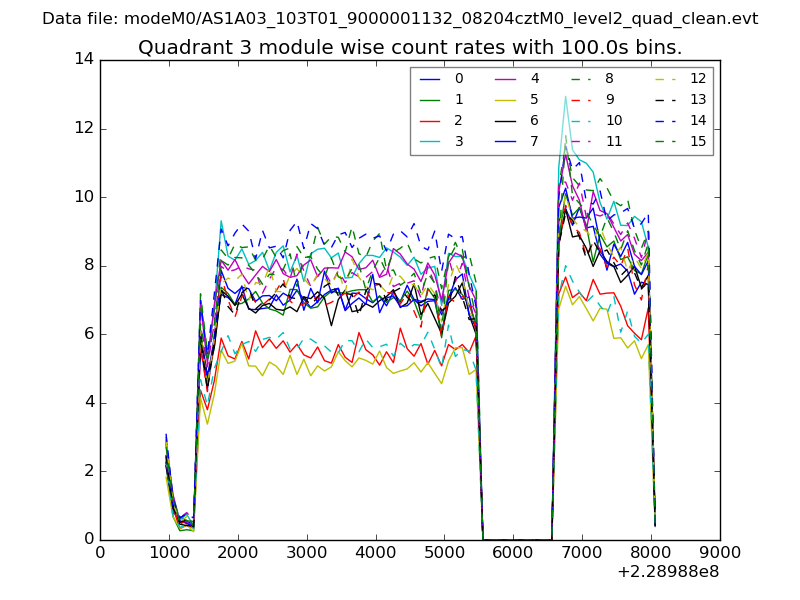
| Module-wise count rates for Quadrant A Data is divided into 100 sec bins |
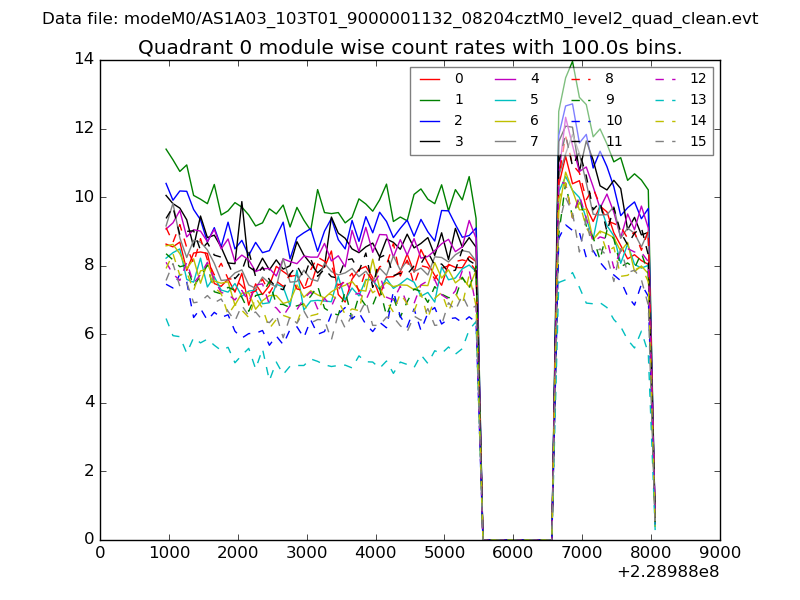 |
 |
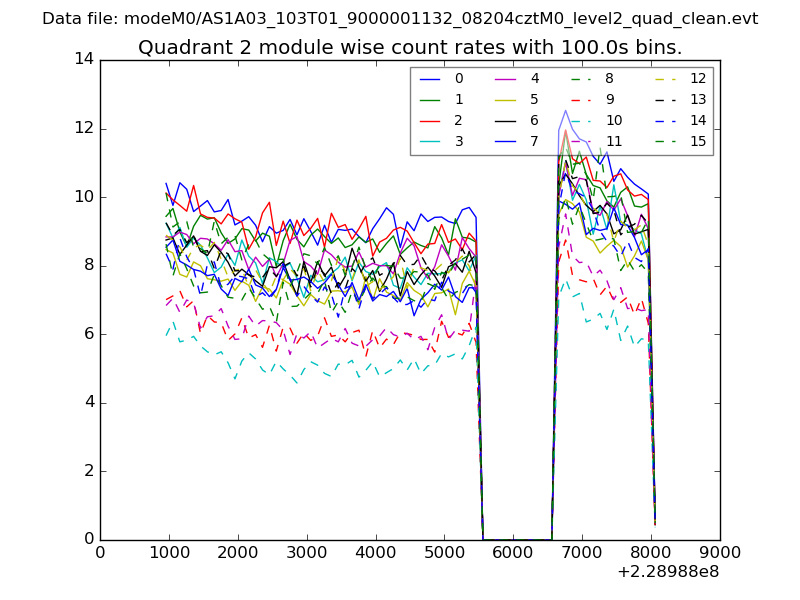
| Module-wise count rates for Quadrant B Data is divided into 100 sec bins |
 |
 |
| Module-wise count rates for Quadrant C Data is divided into 100 sec bins |
 |
 |
| Module-wise count rates for Quadrant D Data is divided into 100 sec bins |
 |
 |
| Parameter | Plot |
|---|---|
| CZT HV Monitor | 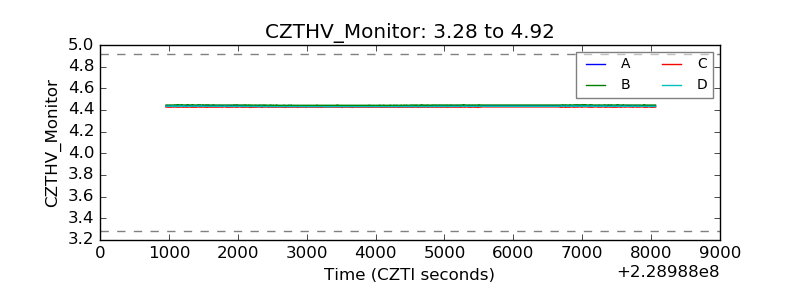 |
| D_VDD | 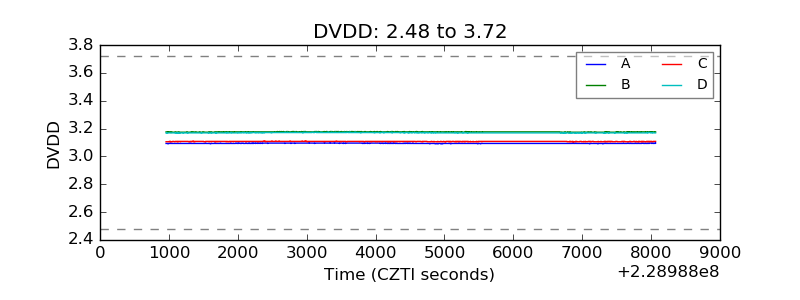 |
| Temperature 1 | 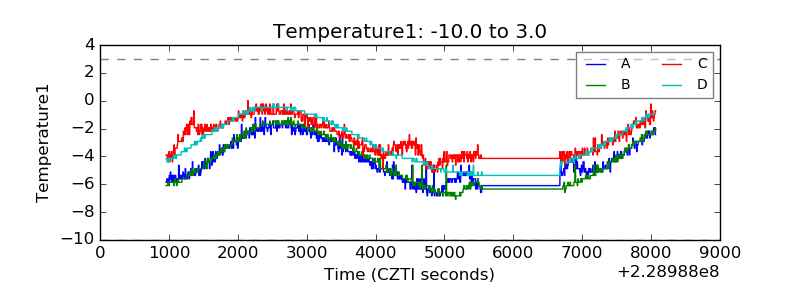 |
| Veto HV Monitor | 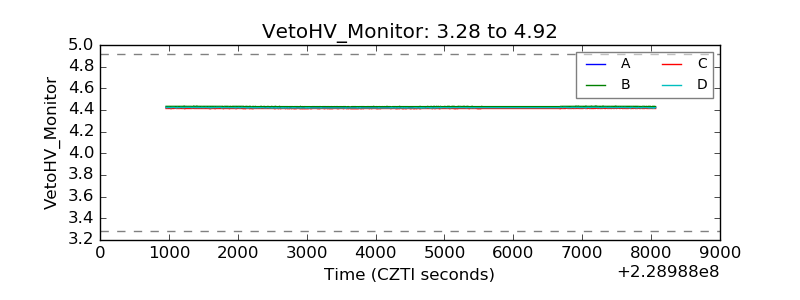 |
| Veto LLD | 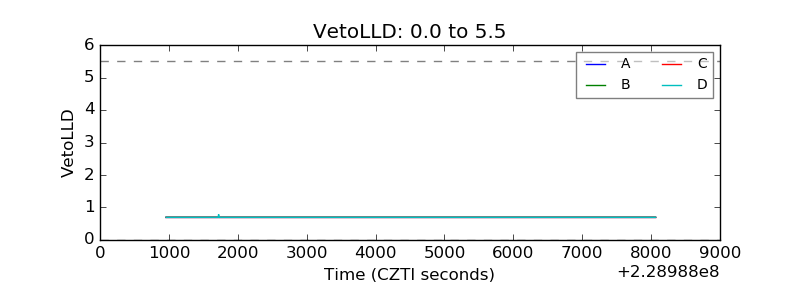 |
| Alpha Counter | 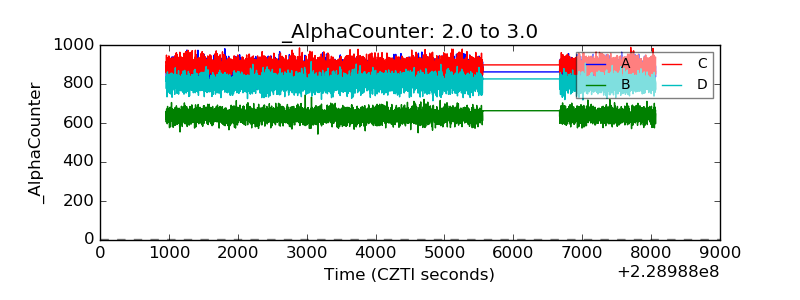 |
| _CPM_Rate | 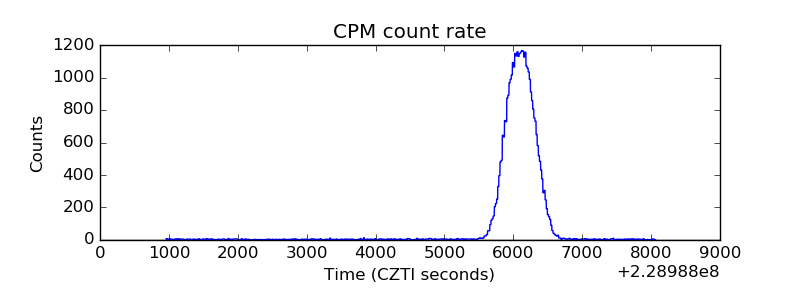 |
| CZT Counter | 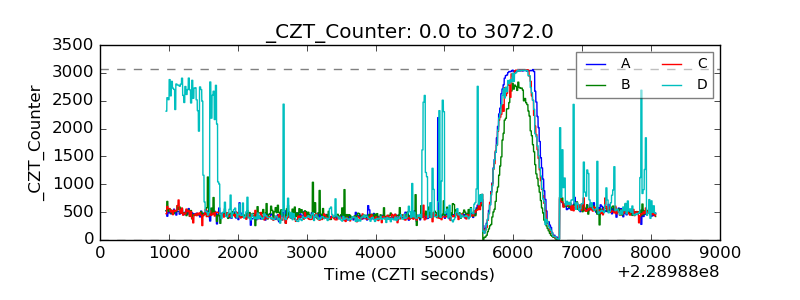 |
| +2.5 Volts monitor |  |
| +5 Volts monitor |  |
| _ROLL_ROT | 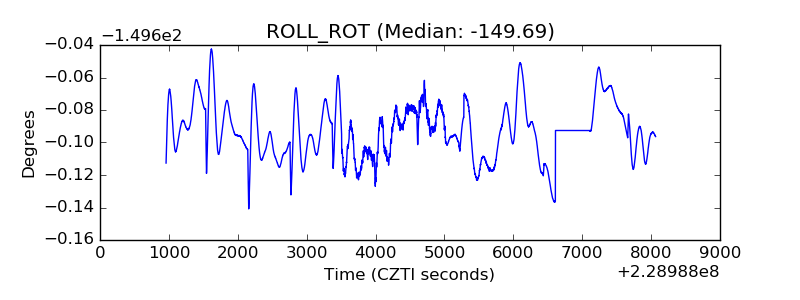 |
| _Roll_DEC | 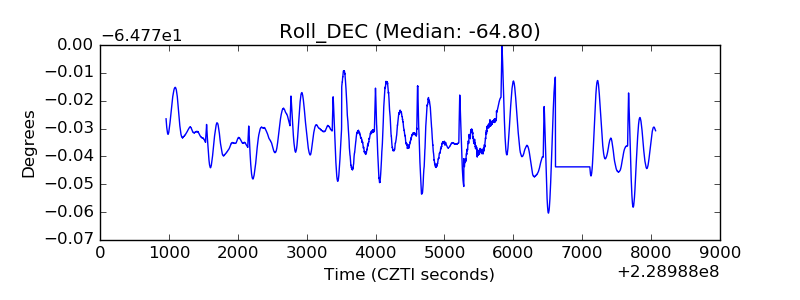 |
| _Roll_RA | 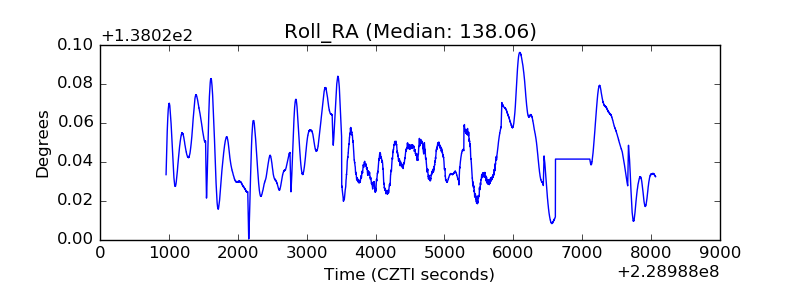 |
| Veto Counter | 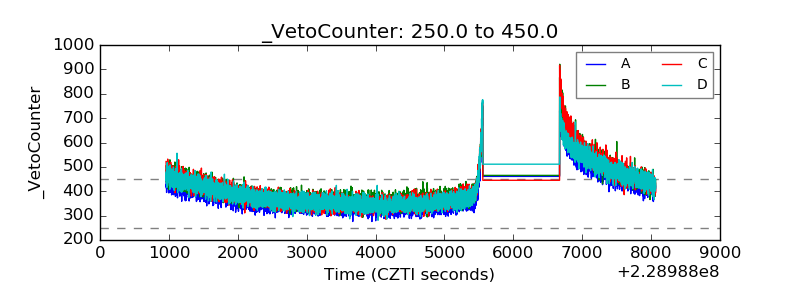 |