| Param | Original file | Final file |
|---|---|---|
| Filename | modeM0/AS1A03_103T01_9000001132_08206cztM0_level2.evt | modeM0/AS1A03_103T01_9000001132_08206cztM0_level2_quad_clean.evt |
| Size (bytes) | 440,470,080 | 122,924,160 |
| Size | 420.1 MB | 117.2 MB |
| Events in quadrant A | 2,955,047 | 840,363 |
| Events in quadrant B | 3,270,345 | 846,556 |
| Events in quadrant C | 2,825,273 | 827,202 |
| Events in quadrant D | 3,866,050 | 774,576 |
| Mode M9 | |||
|---|---|---|---|
| Quadrant | BADHDUFLAG | Total packets | Discarded packets |
| A | 0 | 12 | 0 |
| B | 0 | 12 | 0 |
| C | 0 | 12 | 0 |
| D | 0 | 12 | 0 |
| Mode M0 | |||
|---|---|---|---|
| Quadrant | BADHDUFLAG | Total packets | Discarded packets |
| A | 0 | 12860 | 2 |
| B | 0 | 13921 | 1 |
| C | 0 | 12721 | 1 |
| D | 0 | 15892 | 1 |
| Mode SS | |||
|---|---|---|---|
| Quadrant | BADHDUFLAG | Total packets | Discarded packets |
| A | 0 | 128 | 0 |
| B | 0 | 128 | 0 |
| C | 0 | 128 | 0 |
| D | 0 | 128 | 0 |
| Quadrant | Total seconds | Saturated seconds | Saturation percentage |
|---|---|---|---|
| A | 6215 | 82 | 1.319389% |
| B | 6215 | 112 | 1.802092% |
| C | 6215 | 66 | 1.061947% |
| D | 6215 | 310 | 4.987932% |
Noise dominated data is calculated using 1-second bins in cleaned event files. If a bin has >2000 counts, and if more than 50% of those come from <1% of pixels, then it is considered to be noise-dominated and hence unusable.
| Quadrant | # 1 sec bins | Bins with >0 counts | Bins with >2000 counts | High rate bins dominated by noise | Noise dominated (total time) | Noise dominated (detector-on time) | Marked lightcurve |
|---|---|---|---|---|---|---|---|
| A | 7455 | 6215 | 1 | 1 | 0.01% | 0.02% | 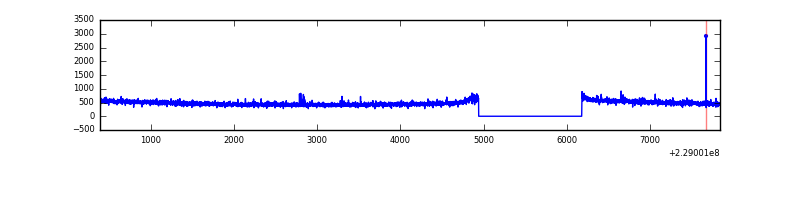 |
| B | 7455 | 6215 | 23 | 23 | 0.31% | 0.37% | 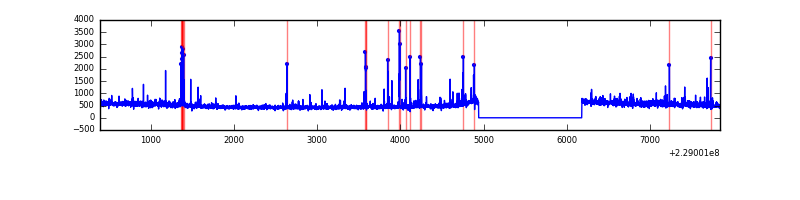 |
| C | 7455 | 6216 | 0 | 0 | 0.00% | 0.00% | 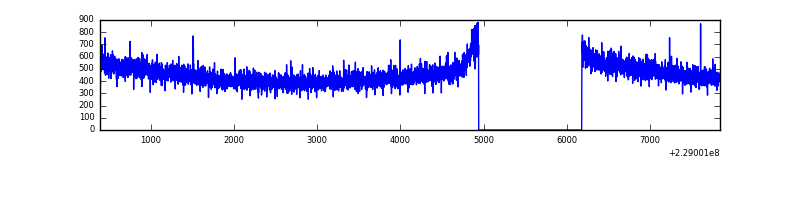 |
| D | 7455 | 6215 | 235 | 235 | 3.15% | 3.78% | 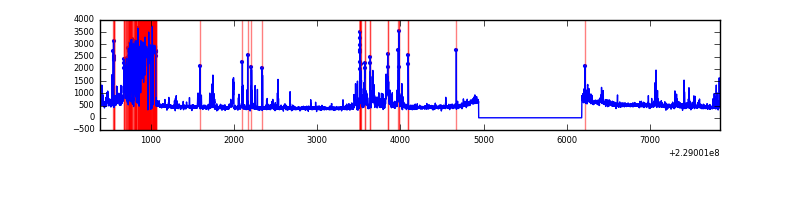 |
Top three noisy pixels from each quadrant. If the there are fewer than three noisy pixels in the level2.evt file, extra rows are filled as -1
| Pixel properties | Quadrant properties | ||||||
|---|---|---|---|---|---|---|---|
| Quadrant | DetID | PixID | Counts | Sigma | Mean | Median | Sigma |
| A | 8 | 15 | 10688 | 64.64 | 761 | 749 | 153.8 |
| A | 4 | 2 | 8561 | 50.81 | 761 | 749 | 153.8 |
| A | 0 | 226 | 7120 | 41.44 | 761 | 749 | 153.8 |
| B | 0 | 214 | 168151 | 1174.26 | 757 | 740 | 142.6 |
| B | 10 | 16 | 87477 | 608.39 | 757 | 740 | 142.6 |
| B | 0 | 213 | 40957 | 282.09 | 757 | 740 | 142.6 |
| C | 13 | 61 | 5623 | 29.72 | 724 | 727 | 164.8 |
| C | 3 | 202 | 1880 | 7.0 | 724 | 727 | 164.8 |
| C | -1 | -1 | -1 | -1.0 | 724 | 727 | 164.8 |
| D | 1 | 52 | 736909 | 4232.69 | 716 | 691 | 173.9 |
| D | 12 | 233 | 254758 | 1460.69 | 716 | 691 | 173.9 |
| D | 7 | 55 | 47633 | 269.88 | 716 | 691 | 173.9 |
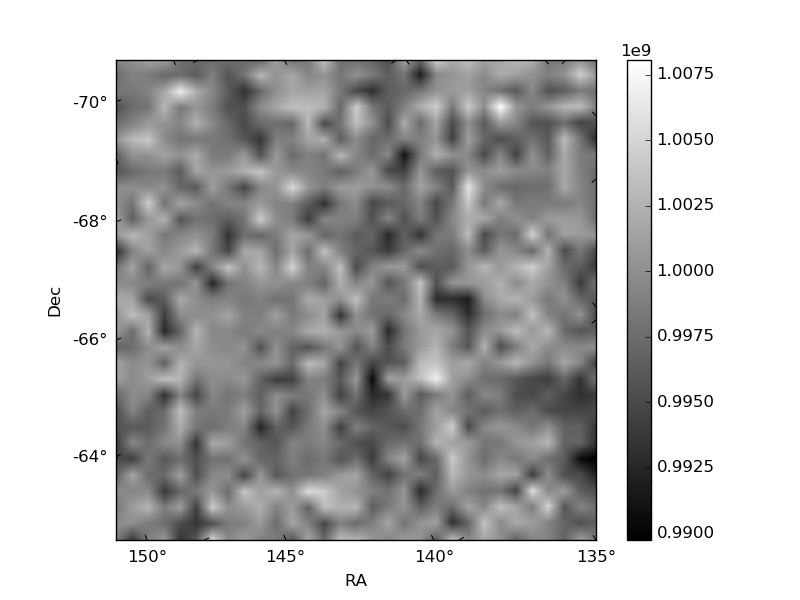
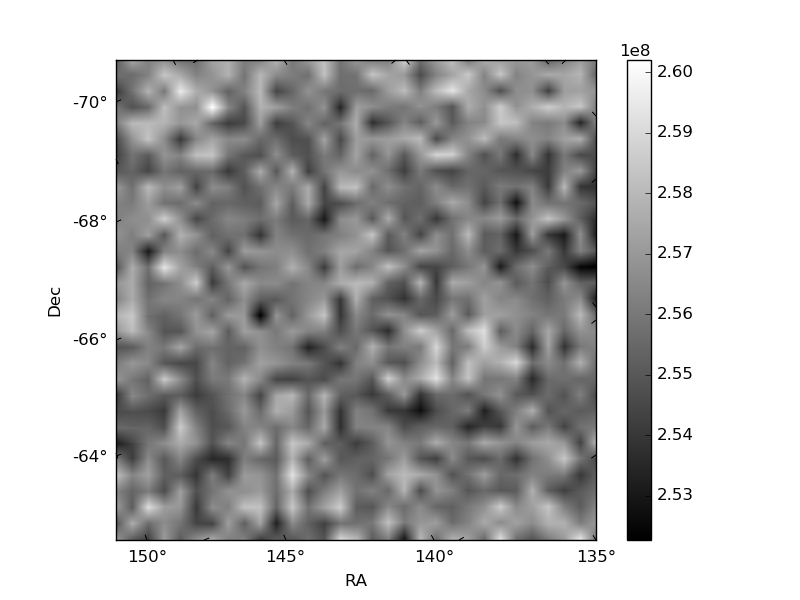
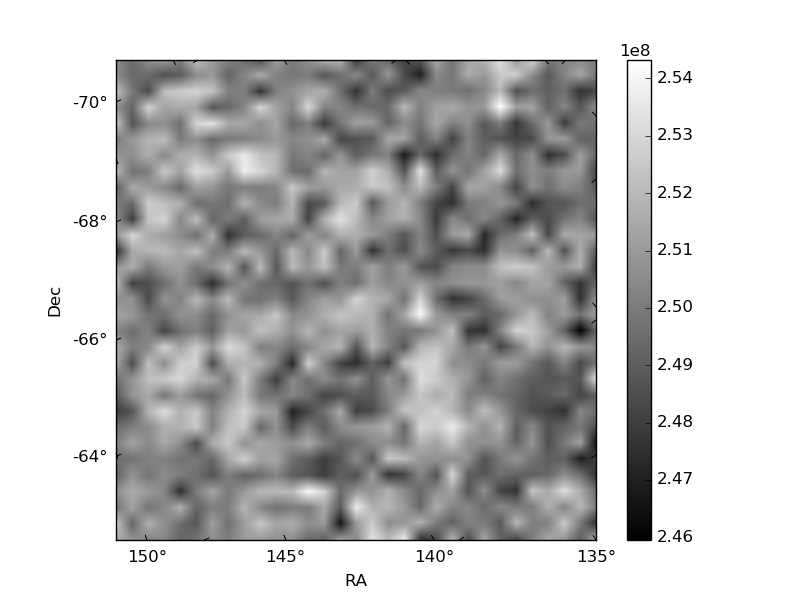
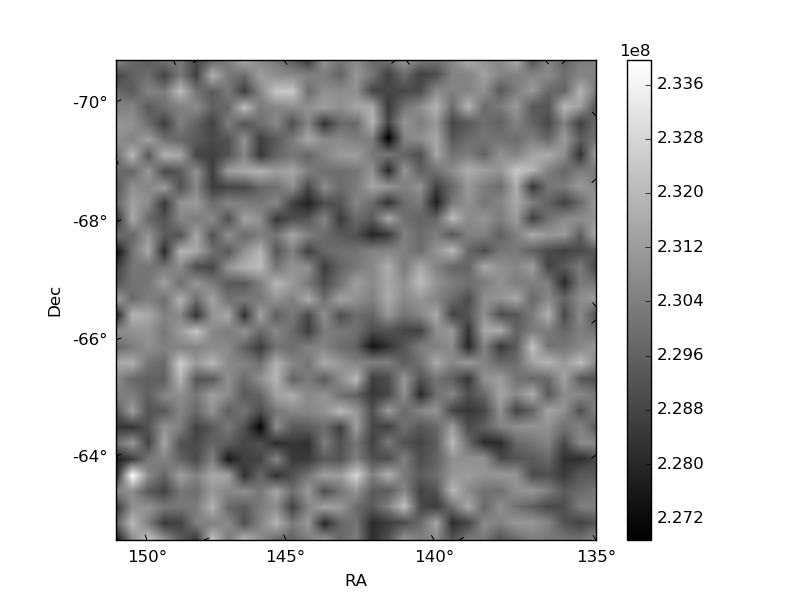
Histogram calculated using DETX and DETY for each event in the final _common_clean file
| Quadrant A | 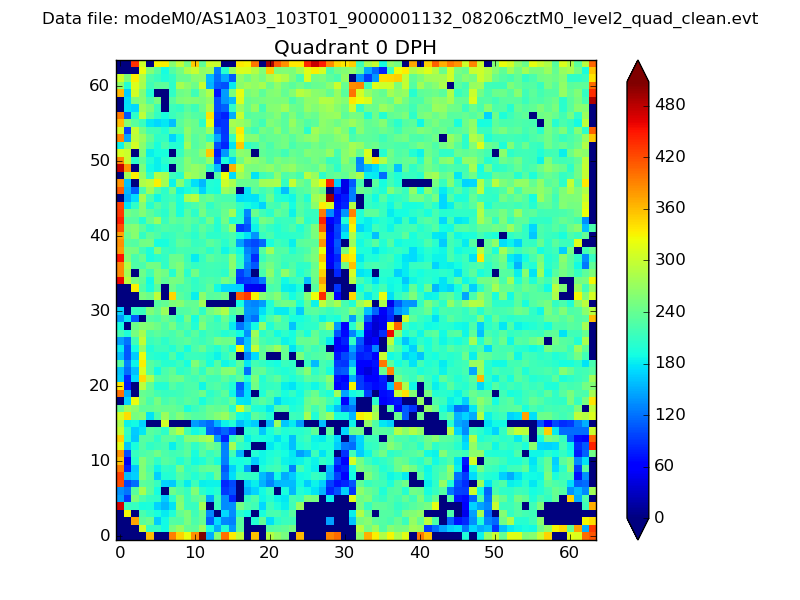 |
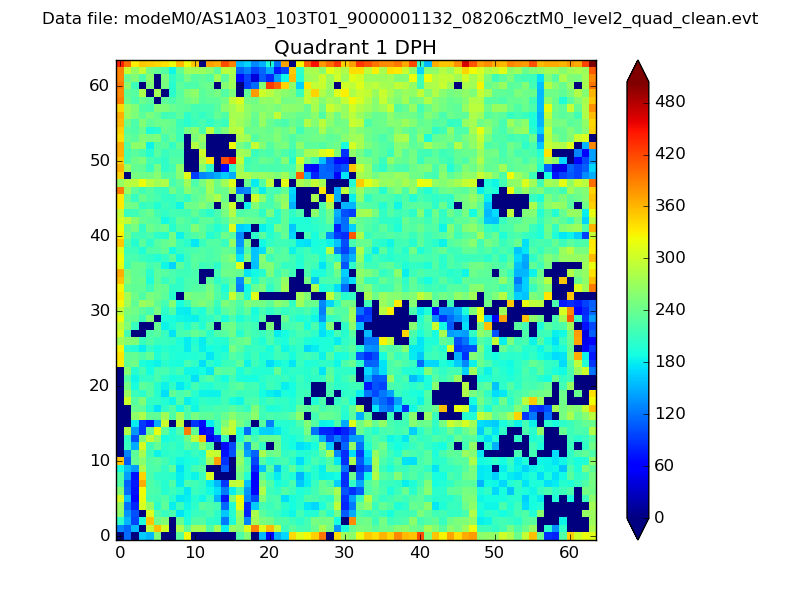 |
Quadrant B |
|---|---|---|---|
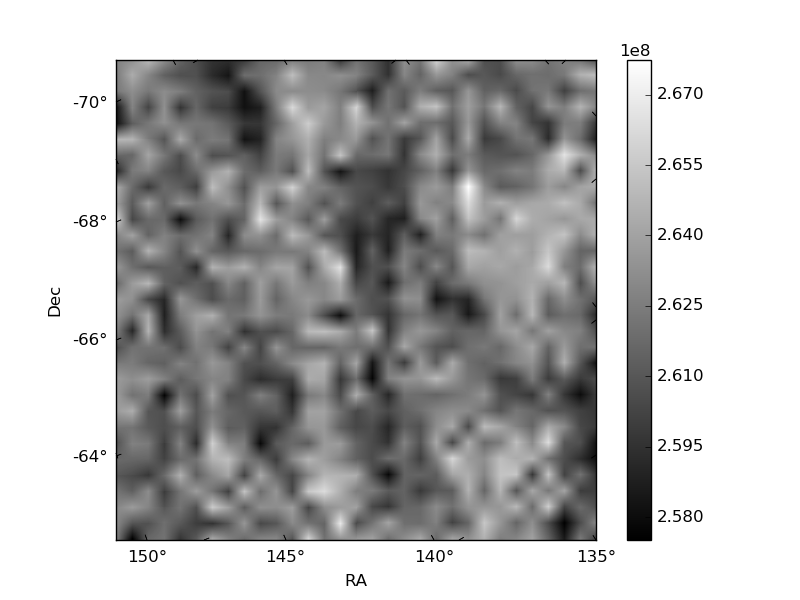
| Quadrant D | 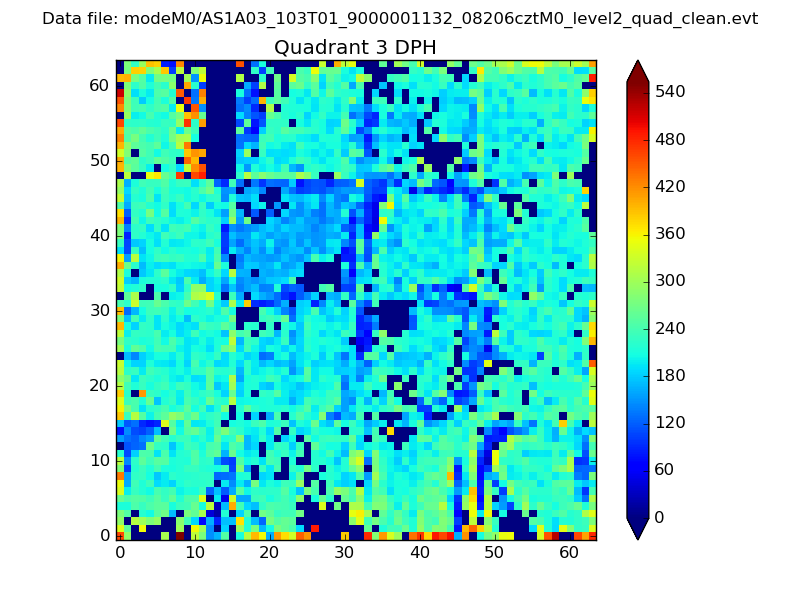 |
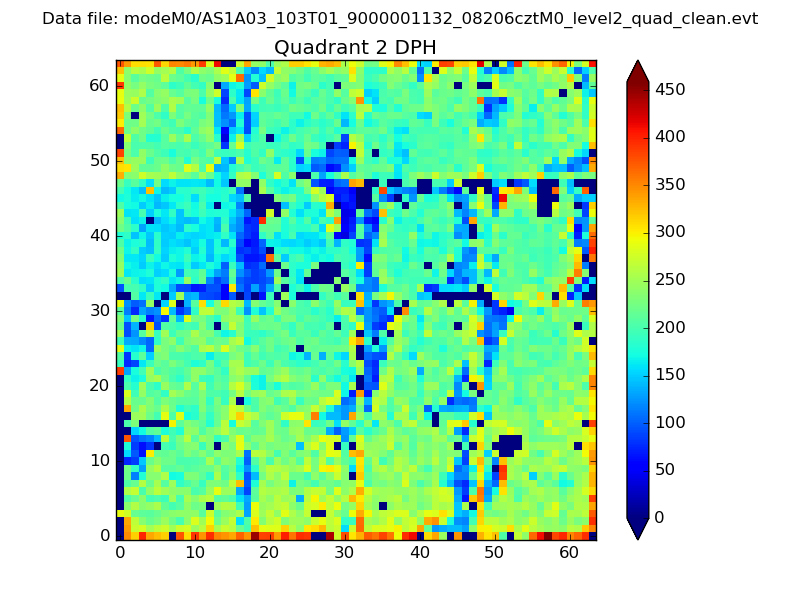 |
Quadrant C |
| Plot type | Count rate plots | Images |
|---|---|---|
| Comparison with Poisson distribution Blue bars denote a histogram of data divided into 1 sec bins. Red curve is a Poisson curve with rate = median count rate of data. |
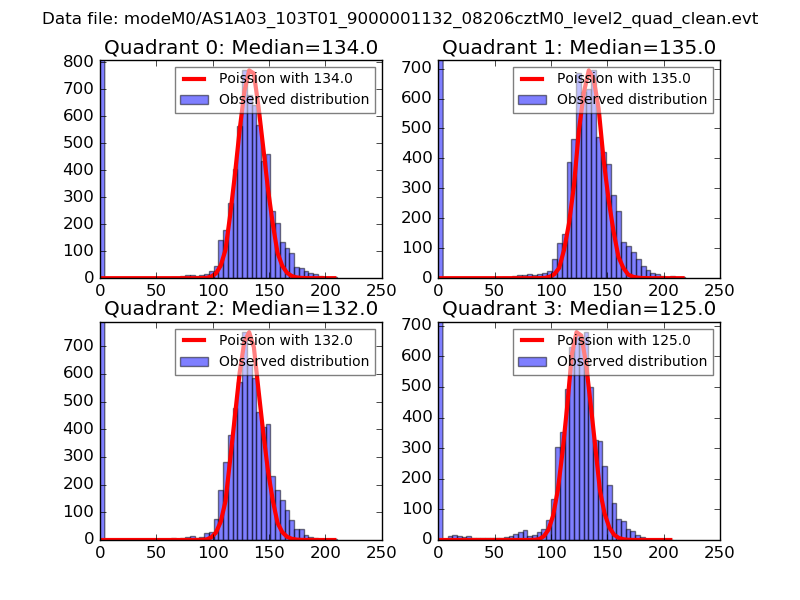 |
 |
| Quadrant-wise count rates Data is divided into 100 sec bins |
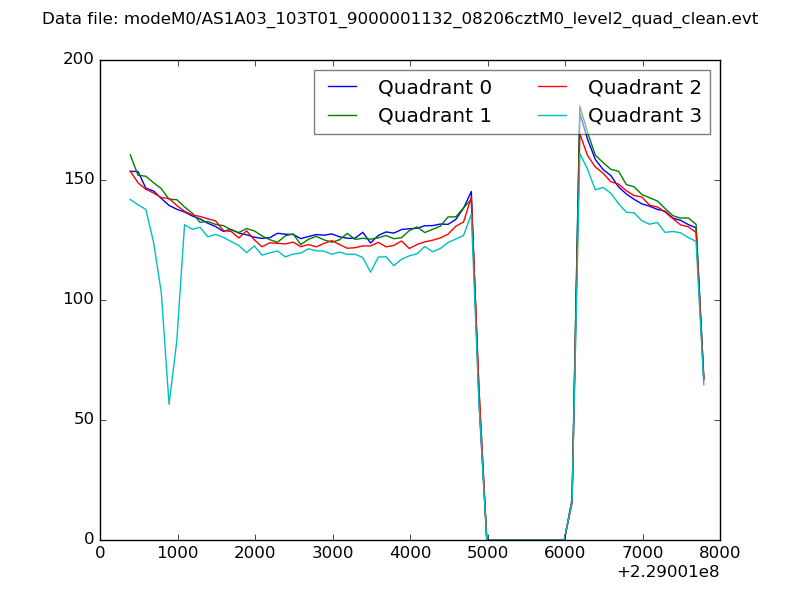 |
|
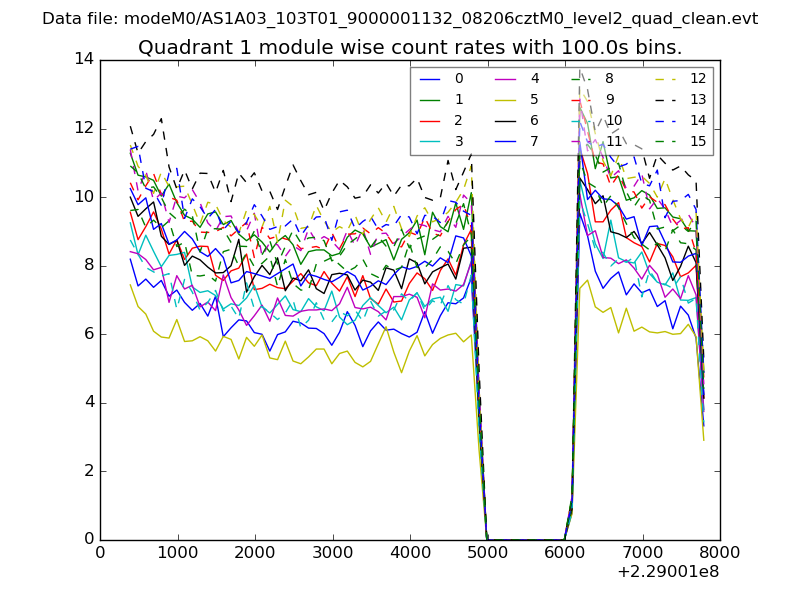
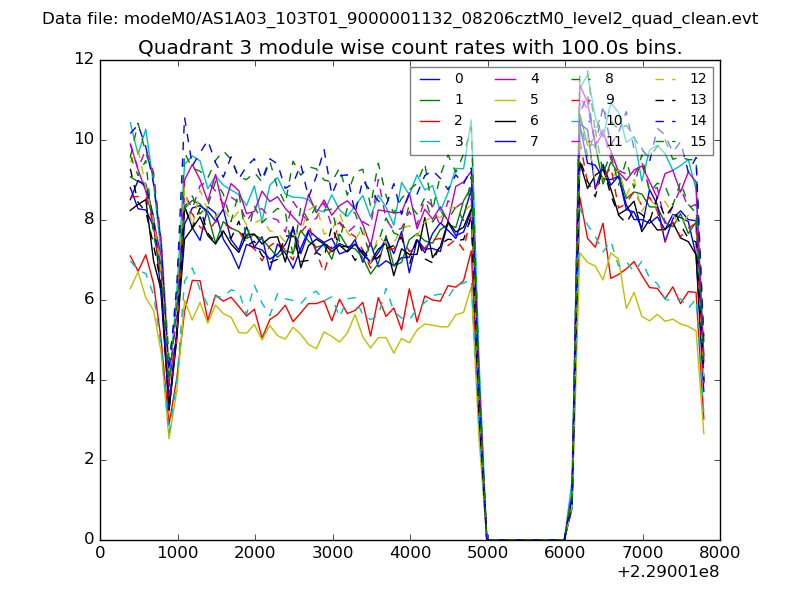
| Module-wise count rates for Quadrant A Data is divided into 100 sec bins |
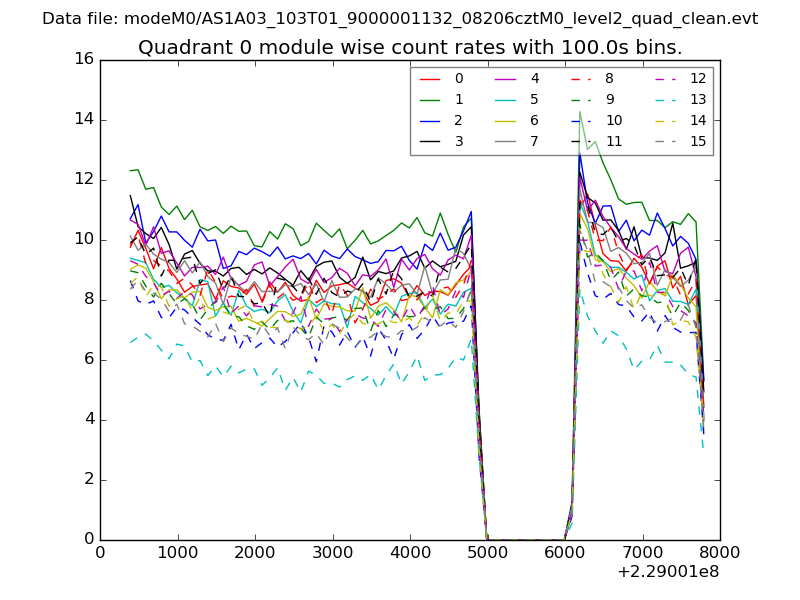 |
 |
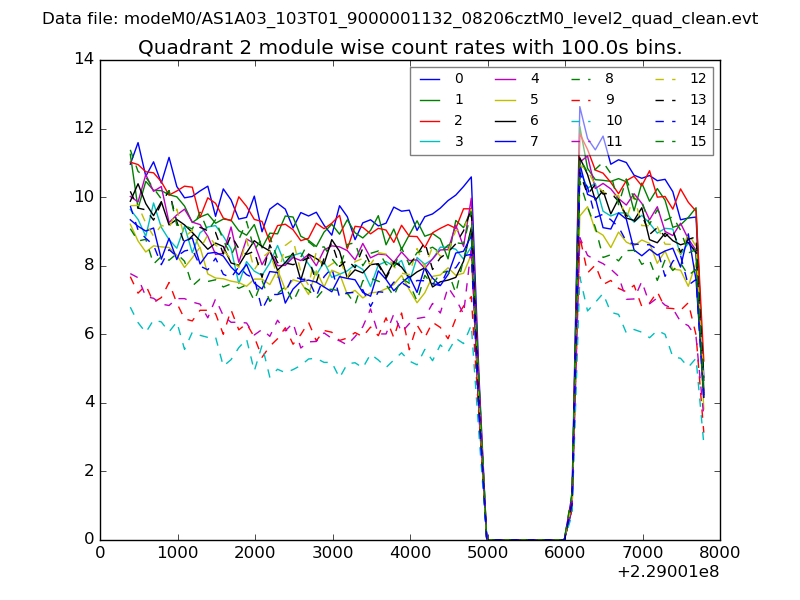
| Module-wise count rates for Quadrant B Data is divided into 100 sec bins |
 |
 |
| Module-wise count rates for Quadrant C Data is divided into 100 sec bins |
 |
 |
| Module-wise count rates for Quadrant D Data is divided into 100 sec bins |
 |
 |
| Parameter | Plot |
|---|---|
| CZT HV Monitor | 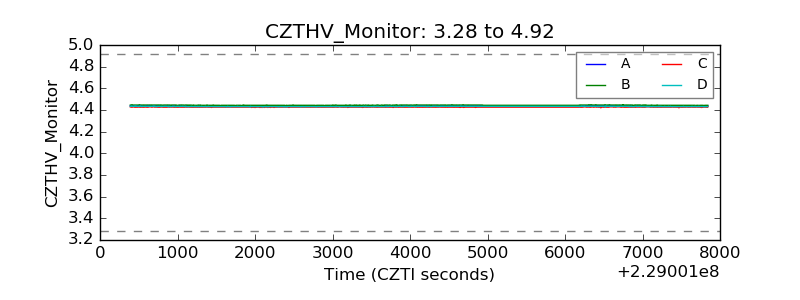 |
| D_VDD | 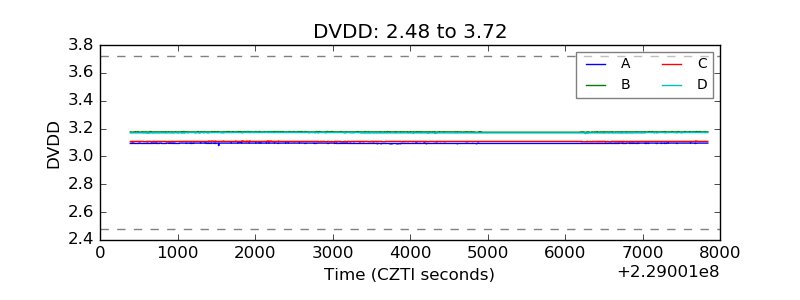 |
| Temperature 1 | 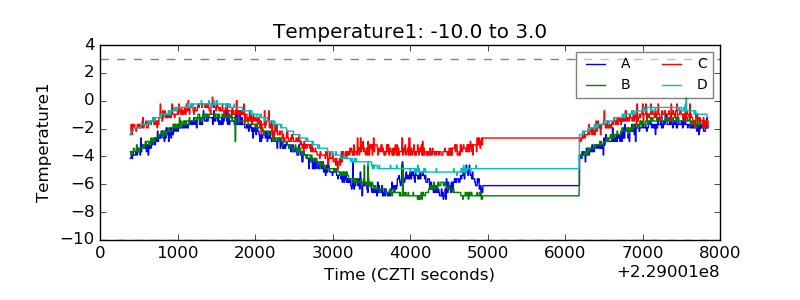 |
| Veto HV Monitor | 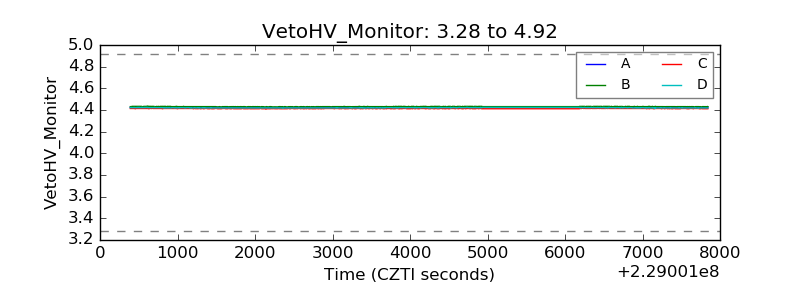 |
| Veto LLD | 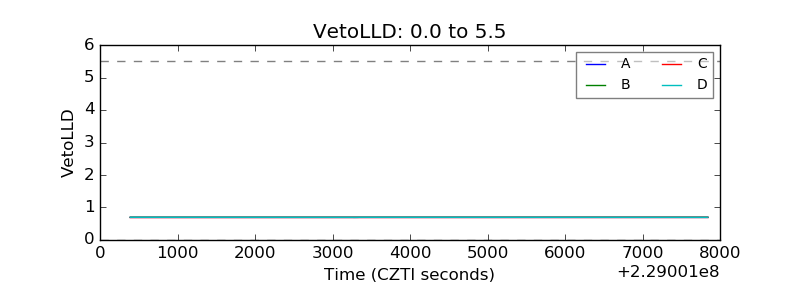 |
| Alpha Counter | 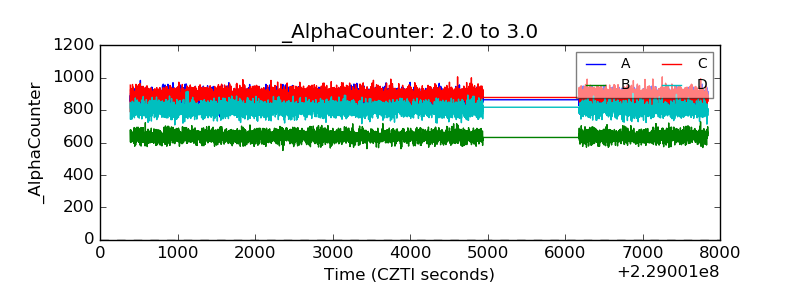 |
| _CPM_Rate | 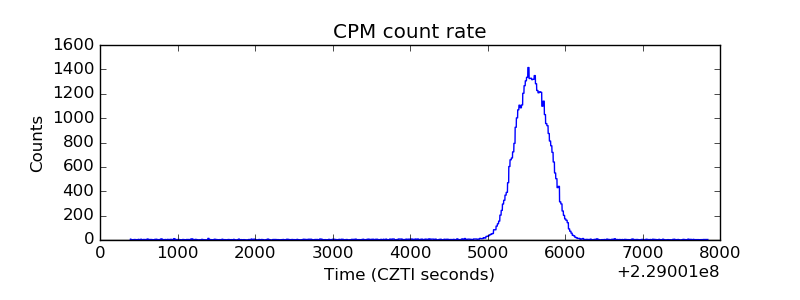 |
| CZT Counter | 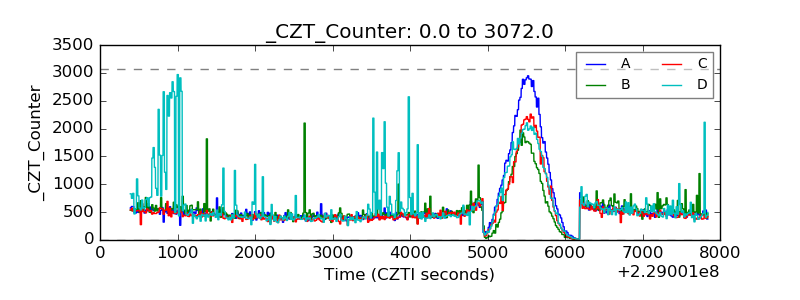 |
| +2.5 Volts monitor |  |
| +5 Volts monitor |  |
| _ROLL_ROT | 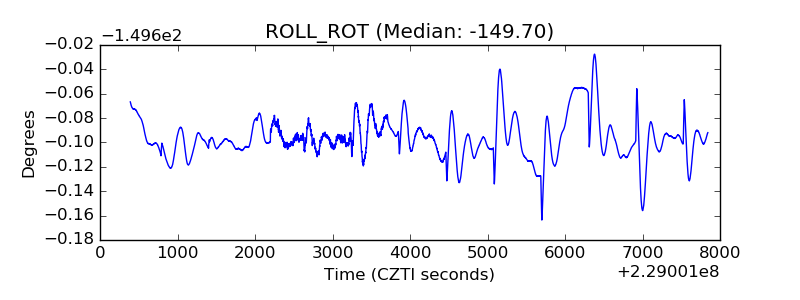 |
| _Roll_DEC | 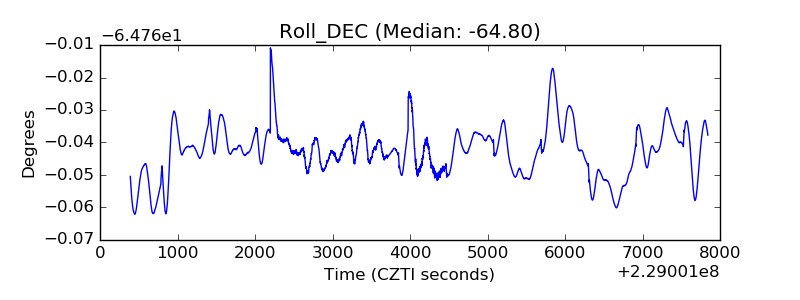 |
| _Roll_RA | 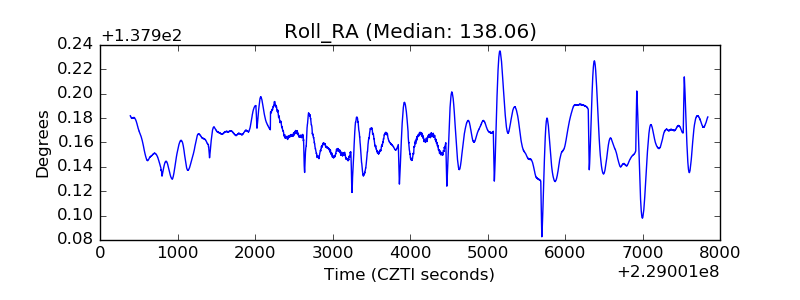 |
| Veto Counter | 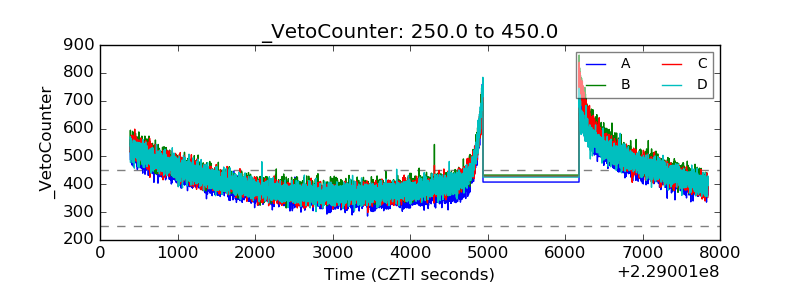 |