| Param | Original file | Final file |
|---|---|---|
| Filename | modeM0/AS1A03_103T01_9000001132_08208cztM0_level2.evt | modeM0/AS1A03_103T01_9000001132_08208cztM0_level2_quad_clean.evt |
| Size (bytes) | 379,333,440 | 110,885,760 |
| Size | 361.8 MB | 105.7 MB |
| Events in quadrant A | 2,876,534 | 748,946 |
| Events in quadrant B | 2,821,100 | 758,289 |
| Events in quadrant C | 2,540,241 | 733,869 |
| Events in quadrant D | 2,846,197 | 702,971 |
| Mode M9 | |||
|---|---|---|---|
| Quadrant | BADHDUFLAG | Total packets | Discarded packets |
| A | 0 | 11 | 0 |
| B | 0 | 11 | 0 |
| C | 0 | 11 | 0 |
| D | 0 | 11 | 0 |
| Mode M0 | |||
|---|---|---|---|
| Quadrant | BADHDUFLAG | Total packets | Discarded packets |
| A | 0 | 12779 | 2 |
| B | 0 | 12444 | 1 |
| C | 0 | 12047 | 1 |
| D | 0 | 12678 | 1 |
| Mode SS | |||
|---|---|---|---|
| Quadrant | BADHDUFLAG | Total packets | Discarded packets |
| A | 0 | 122 | 0 |
| B | 0 | 122 | 0 |
| C | 0 | 122 | 0 |
| D | 0 | 122 | 0 |
| Quadrant | Total seconds | Saturated seconds | Saturation percentage |
|---|---|---|---|
| A | 5928 | 78 | 1.315789% |
| B | 5928 | 50 | 0.843455% |
| C | 5928 | 11 | 0.185560% |
| D | 5928 | 45 | 0.759109% |
Noise dominated data is calculated using 1-second bins in cleaned event files. If a bin has >2000 counts, and if more than 50% of those come from <1% of pixels, then it is considered to be noise-dominated and hence unusable.
| Quadrant | # 1 sec bins | Bins with >0 counts | Bins with >2000 counts | High rate bins dominated by noise | Noise dominated (total time) | Noise dominated (detector-on time) | Marked lightcurve |
|---|---|---|---|---|---|---|---|
| A | 7057 | 5928 | 42 | 42 | 0.60% | 0.71% | 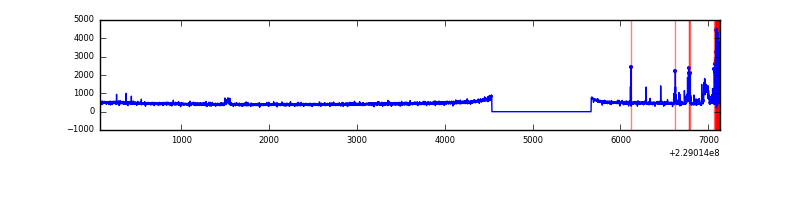 |
| B | 7058 | 5929 | 8 | 8 | 0.11% | 0.13% | 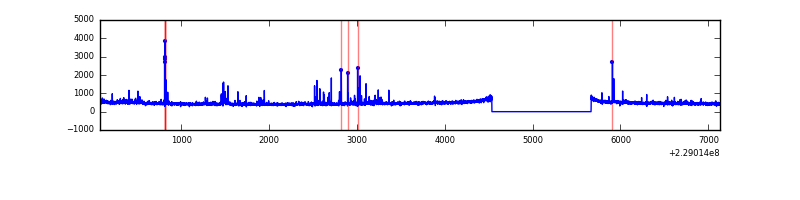 |
| C | 7058 | 5929 | 0 | 0 | 0.00% | 0.00% | 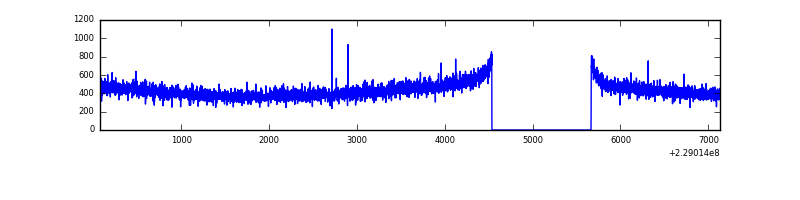 |
| D | 7058 | 5929 | 22 | 22 | 0.31% | 0.37% | 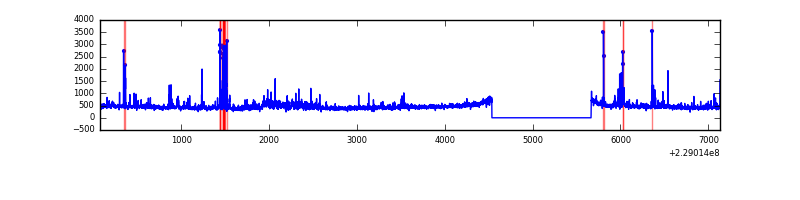 |
Top three noisy pixels from each quadrant. If the there are fewer than three noisy pixels in the level2.evt file, extra rows are filled as -1
| Pixel properties | Quadrant properties | ||||||
|---|---|---|---|---|---|---|---|
| Quadrant | DetID | PixID | Counts | Sigma | Mean | Median | Sigma |
| A | 4 | 2 | 249319 | 1800.97 | 680 | 667 | 138.1 |
| A | 0 | 226 | 6691 | 43.63 | 680 | 667 | 138.1 |
| A | 12 | 194 | 6123 | 39.52 | 680 | 667 | 138.1 |
| B | 10 | 16 | 48081 | 365.11 | 686 | 671 | 129.9 |
| B | 0 | 214 | 32782 | 247.29 | 686 | 671 | 129.9 |
| B | 0 | 213 | 23779 | 177.96 | 686 | 671 | 129.9 |
| C | 14 | 67 | 5015 | 29.26 | 650 | 653 | 149.1 |
| C | 13 | 61 | 5002 | 29.17 | 650 | 653 | 149.1 |
| C | 3 | 202 | 1727 | 7.2 | 650 | 653 | 149.1 |
| D | 2 | 152 | 152096 | 961.5 | 651 | 631 | 157.5 |
| D | 1 | 52 | 35191 | 219.39 | 651 | 631 | 157.5 |
| D | 2 | 14 | 34411 | 214.43 | 651 | 631 | 157.5 |
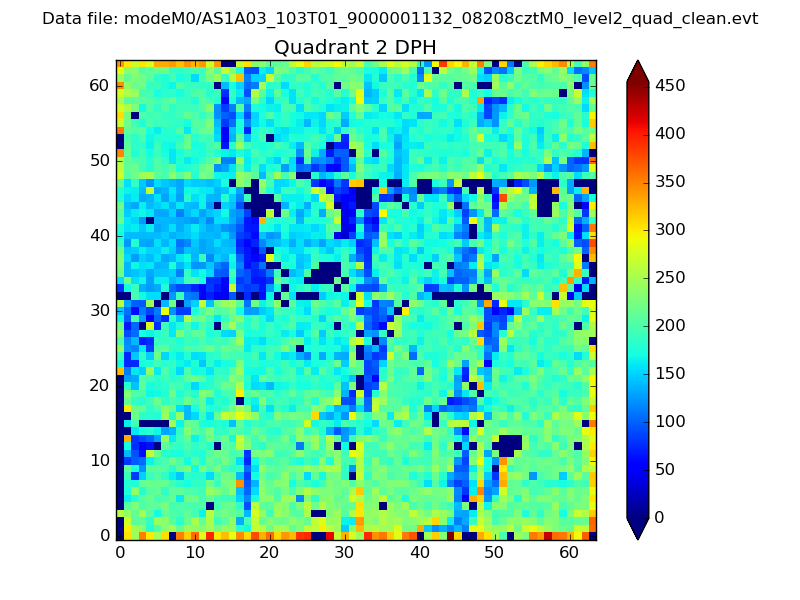
Histogram calculated using DETX and DETY for each event in the final _common_clean file
| Quadrant A | 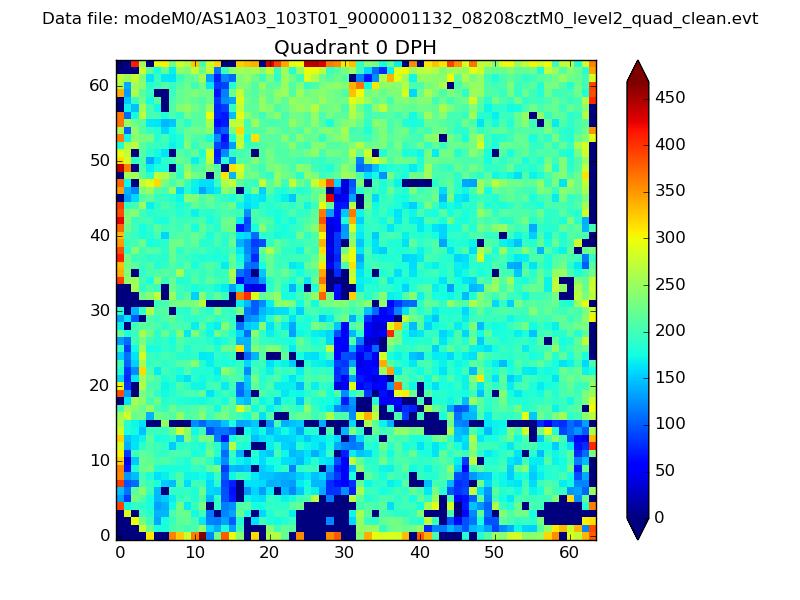 |
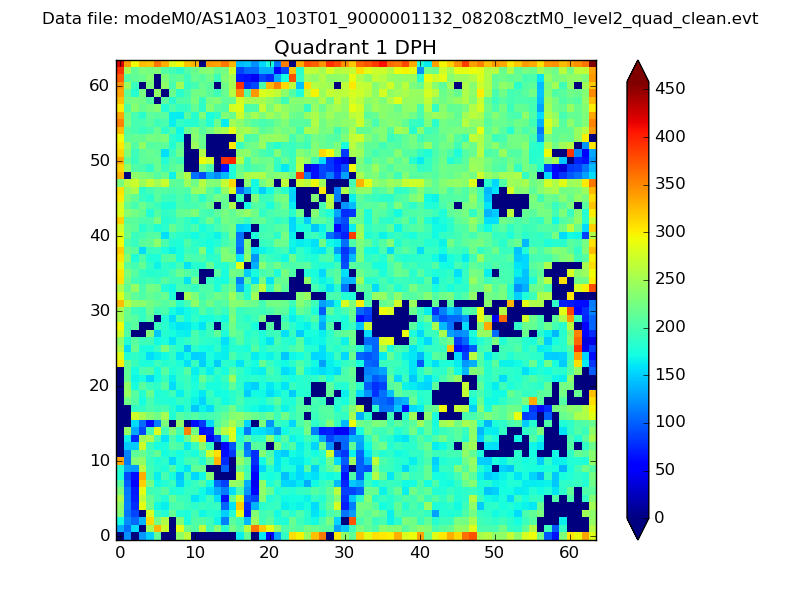 |
Quadrant B |
|---|---|---|---|
| Quadrant D | 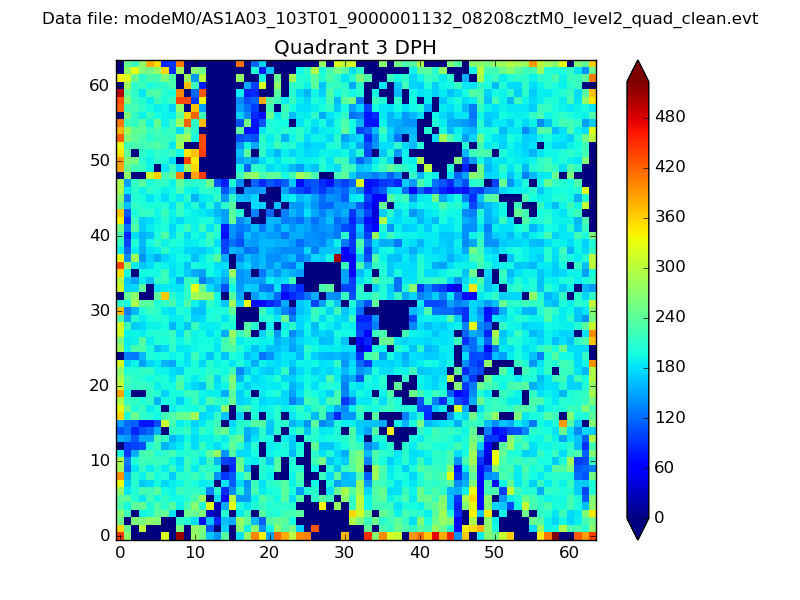 |
 |
Quadrant C |
| Plot type | Count rate plots | Images |
|---|---|---|
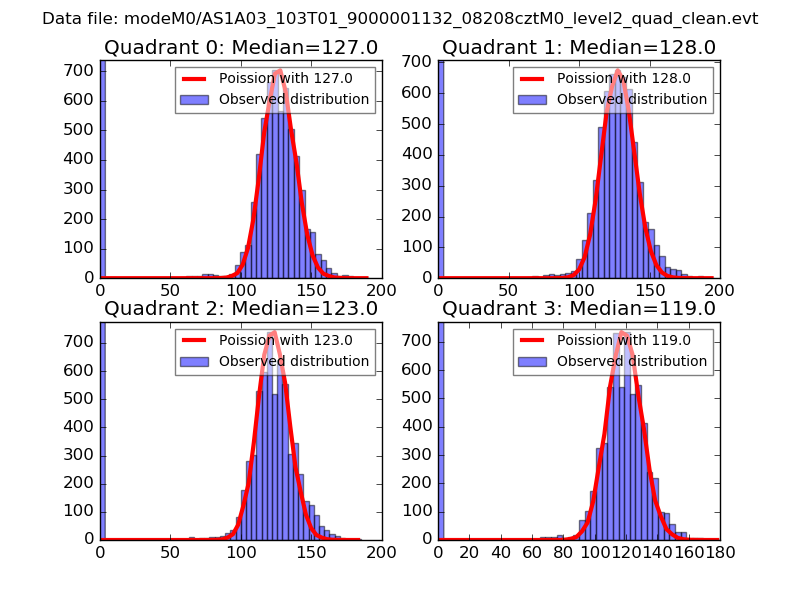
| Comparison with Poisson distribution Blue bars denote a histogram of data divided into 1 sec bins. Red curve is a Poisson curve with rate = median count rate of data. |
 |
 |
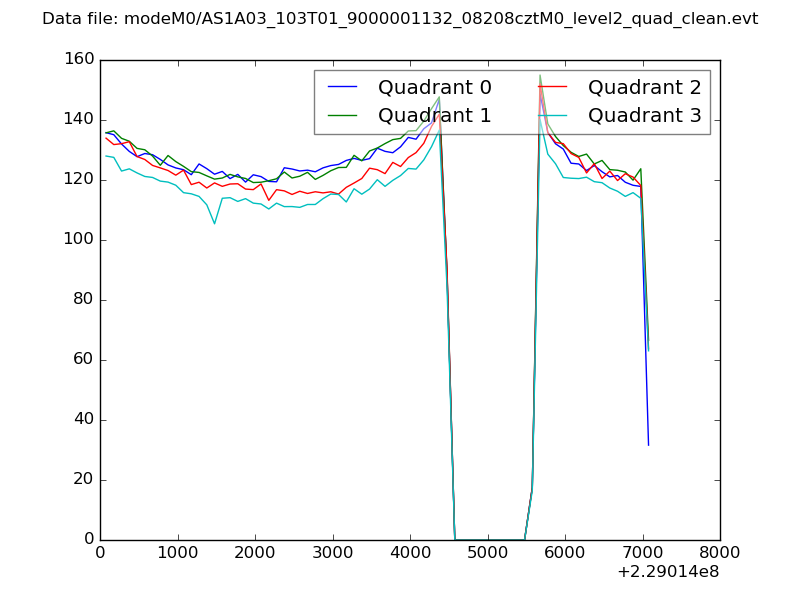
| Quadrant-wise count rates Data is divided into 100 sec bins |
 |
|
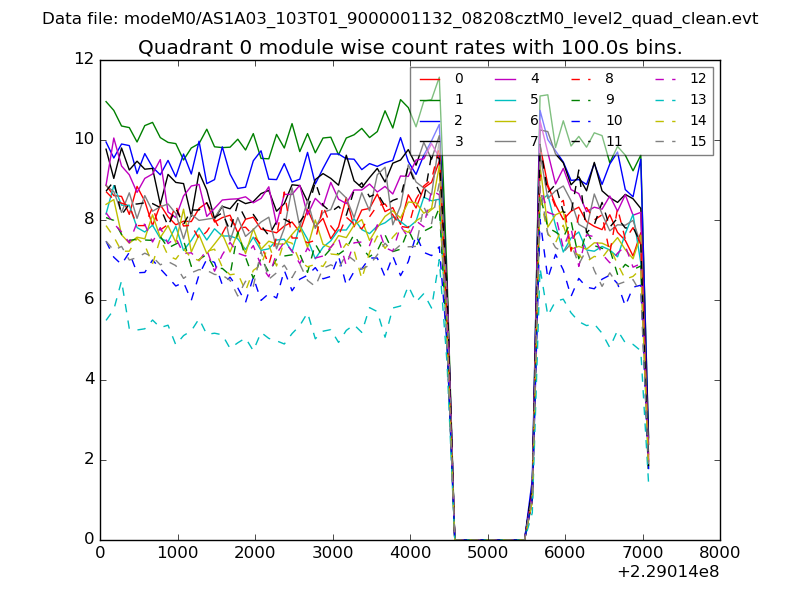
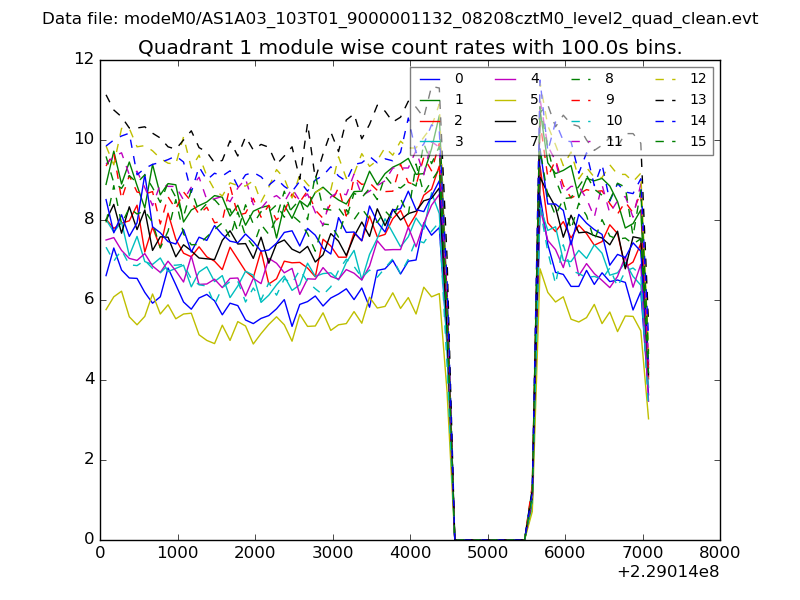
| Module-wise count rates for Quadrant A Data is divided into 100 sec bins |
 |
 |
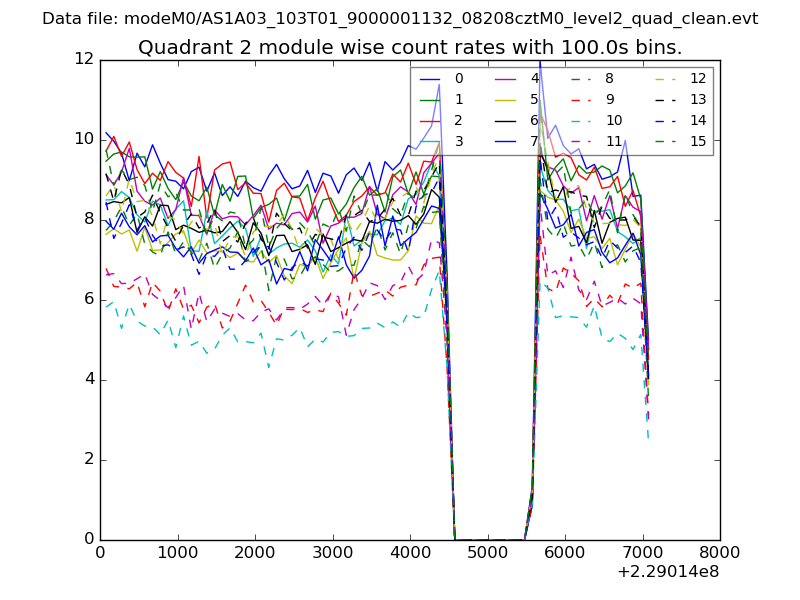
| Module-wise count rates for Quadrant B Data is divided into 100 sec bins |
 |
 |
| Module-wise count rates for Quadrant C Data is divided into 100 sec bins |
 |
 |
| Module-wise count rates for Quadrant D Data is divided into 100 sec bins |
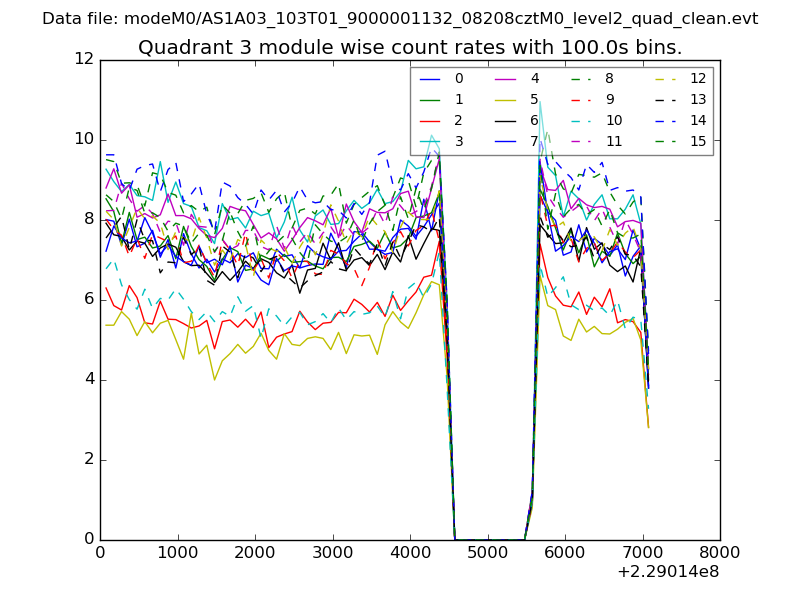 |
 |
| Parameter | Plot |
|---|---|
| CZT HV Monitor | 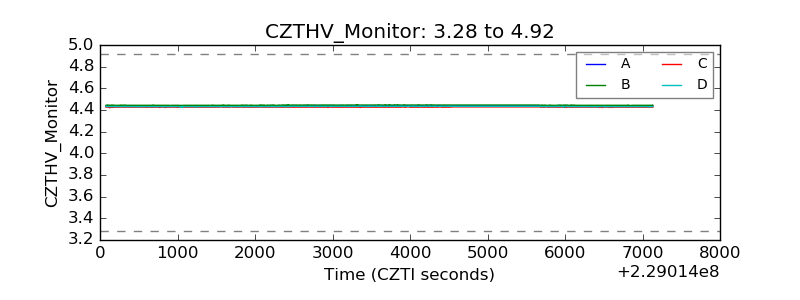 |
| D_VDD | 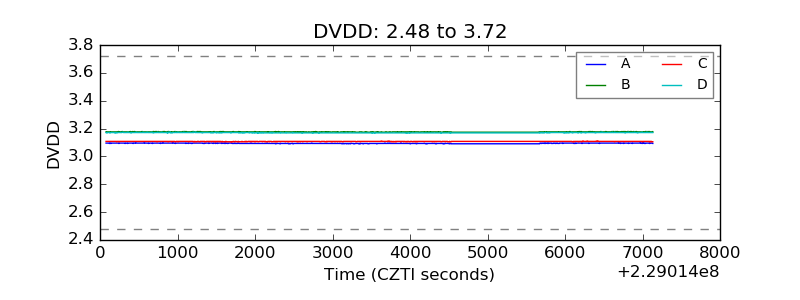 |
| Temperature 1 | 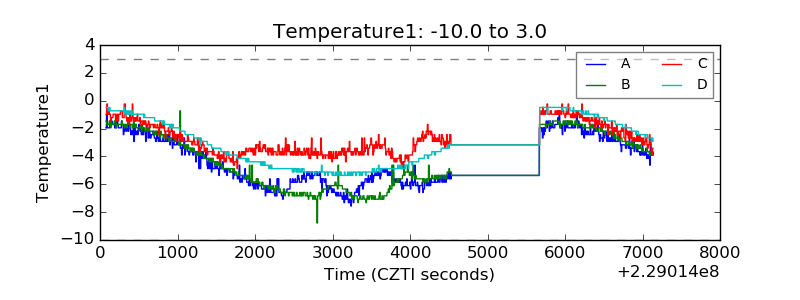 |
| Veto HV Monitor | 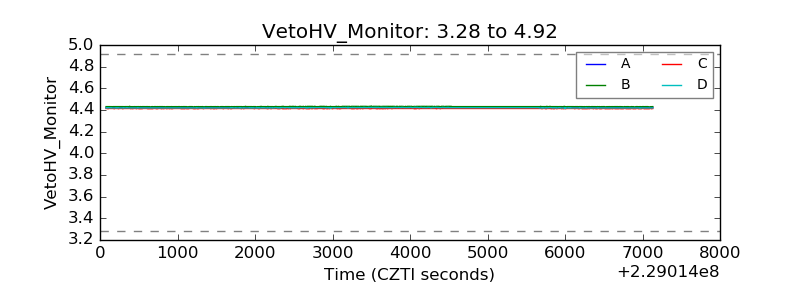 |
| Veto LLD | 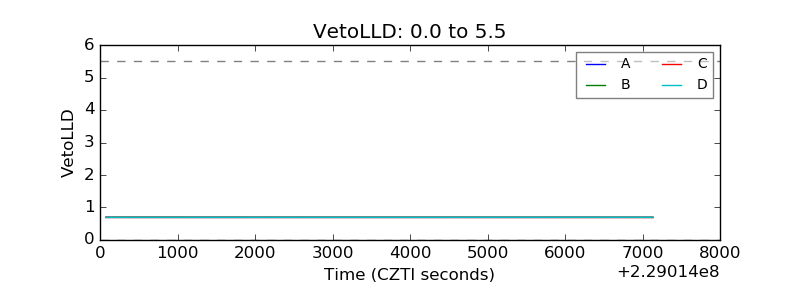 |
| Alpha Counter | 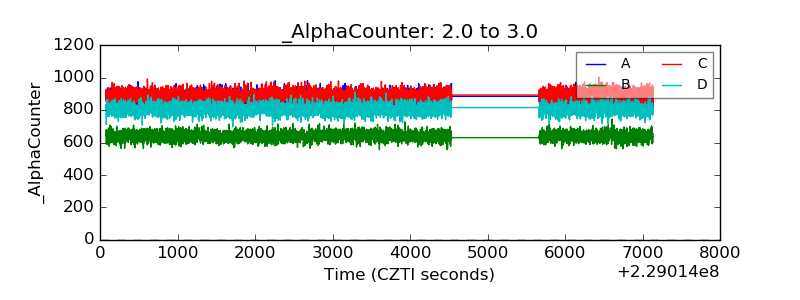 |
| _CPM_Rate | 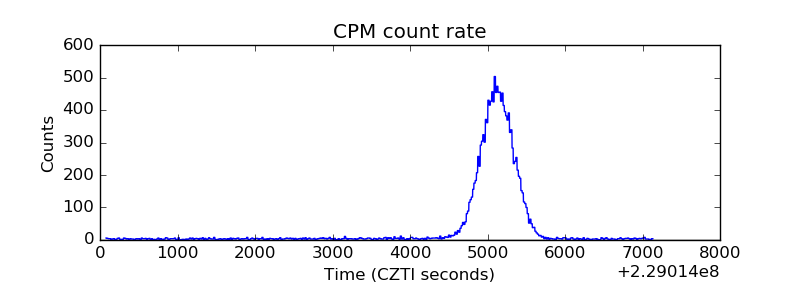 |
| CZT Counter | 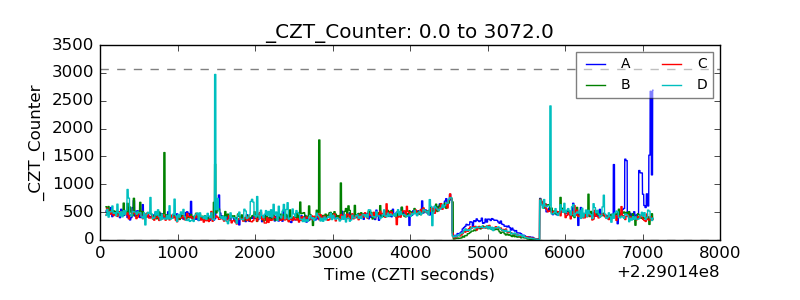 |
| +2.5 Volts monitor |  |
| +5 Volts monitor |  |
| _ROLL_ROT | 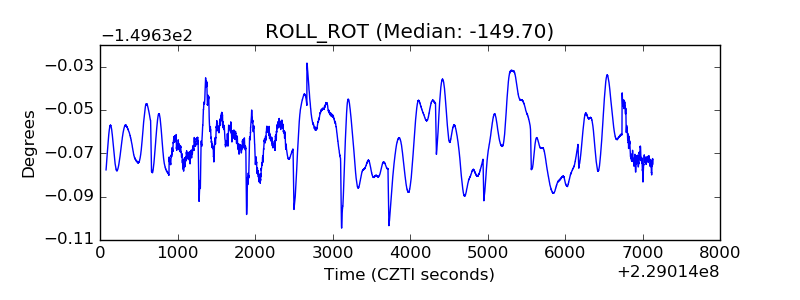 |
| _Roll_DEC | 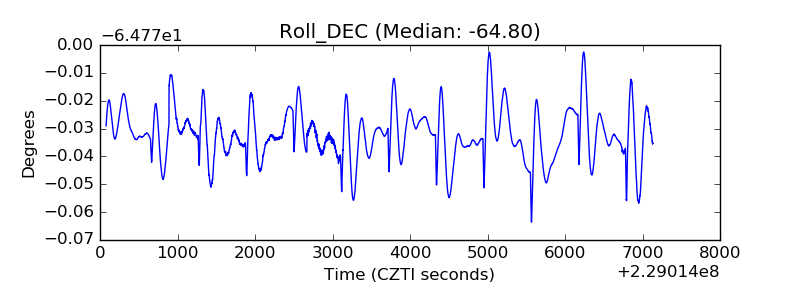 |
| _Roll_RA | 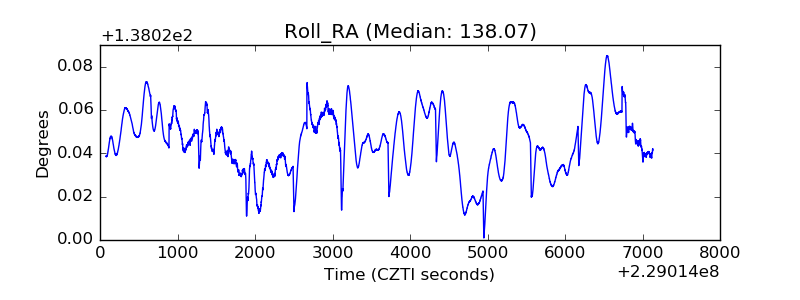 |
| Veto Counter | 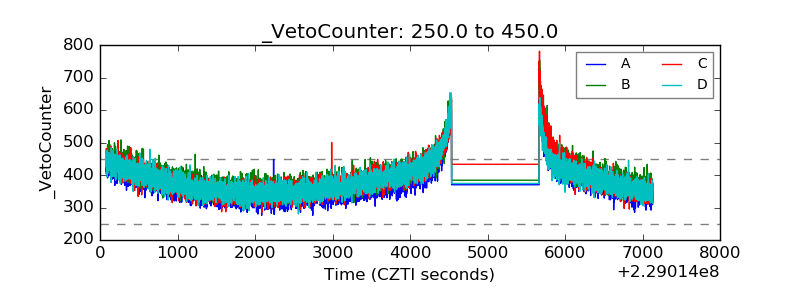 |