| Param | Original file | Final file |
|---|---|---|
| Filename | modeM0/AS1A03_103T01_9000001132_08209cztM0_level2.evt | modeM0/AS1A03_103T01_9000001132_08209cztM0_level2_quad_clean.evt |
| Size (bytes) | 139,671,360 | 38,177,280 |
| Size | 133.2 MB | 36.4 MB |
| Events in quadrant A | 1,246,907 | 249,149 |
| Events in quadrant B | 955,774 | 259,610 |
| Events in quadrant C | 867,048 | 253,825 |
| Events in quadrant D | 1,017,279 | 243,418 |
| Mode M0 | |||
|---|---|---|---|
| Quadrant | BADHDUFLAG | Total packets | Discarded packets |
| A | 0 | 5136 | 1 |
| B | 0 | 4262 | 1 |
| C | 0 | 4180 | 1 |
| D | 0 | 4503 | 1 |
| Mode SS | |||
|---|---|---|---|
| Quadrant | BADHDUFLAG | Total packets | Discarded packets |
| A | 0 | 42 | 0 |
| B | 0 | 42 | 0 |
| C | 0 | 42 | 0 |
| D | 0 | 42 | 0 |
| Quadrant | Total seconds | Saturated seconds | Saturation percentage |
|---|---|---|---|
| A | 2061 | 73 | 3.541970% |
| B | 2061 | 10 | 0.485201% |
| C | 2061 | 4 | 0.194081% |
| D | 2062 | 16 | 0.775946% |
Noise dominated data is calculated using 1-second bins in cleaned event files. If a bin has >2000 counts, and if more than 50% of those come from <1% of pixels, then it is considered to be noise-dominated and hence unusable.
| Quadrant | # 1 sec bins | Bins with >0 counts | Bins with >2000 counts | High rate bins dominated by noise | Noise dominated (total time) | Noise dominated (detector-on time) | Marked lightcurve |
|---|---|---|---|---|---|---|---|
| A | 2061 | 2061 | 61 | 61 | 2.96% | 2.96% | 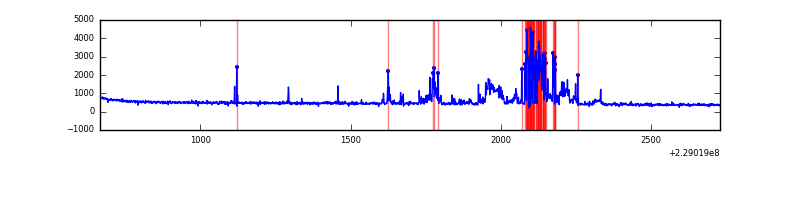 |
| B | 2061 | 2061 | 1 | 1 | 0.05% | 0.05% | 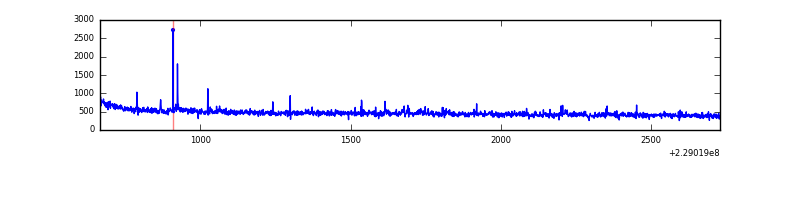 |
| C | 2061 | 2061 | 0 | 0 | 0.00% | 0.00% | 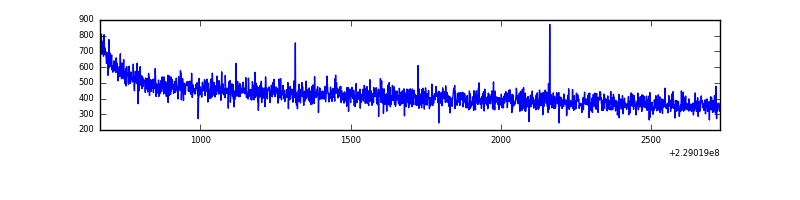 |
| D | 2062 | 2062 | 12 | 12 | 0.58% | 0.58% | 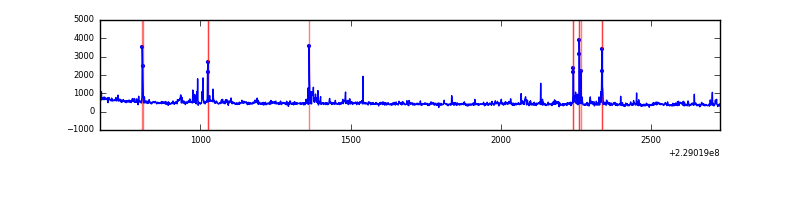 |
Top three noisy pixels from each quadrant. If the there are fewer than three noisy pixels in the level2.evt file, extra rows are filled as -1
| Pixel properties | Quadrant properties | ||||||
|---|---|---|---|---|---|---|---|
| Quadrant | DetID | PixID | Counts | Sigma | Mean | Median | Sigma |
| A | 4 | 2 | 345790 | 7013.05 | 234 | 228 | 49.3 |
| A | 0 | 226 | 2362 | 43.31 | 234 | 228 | 49.3 |
| A | 12 | 194 | 2176 | 39.53 | 234 | 228 | 49.3 |
| B | 0 | 245 | 11847 | 249.51 | 238 | 233 | 46.5 |
| B | 15 | 204 | 7944 | 165.66 | 238 | 233 | 46.5 |
| B | 0 | 219 | 4337 | 88.17 | 238 | 233 | 46.5 |
| C | 13 | 61 | 1794 | 29.85 | 221 | 222 | 52.7 |
| C | 14 | 67 | 1393 | 22.23 | 221 | 222 | 52.7 |
| C | 7 | 159 | 722 | 9.49 | 221 | 222 | 52.7 |
| D | 2 | 152 | 55163 | 989.05 | 223 | 216 | 55.6 |
| D | 13 | 105 | 48503 | 869.17 | 223 | 216 | 55.6 |
| D | 2 | 136 | 19152 | 340.85 | 223 | 216 | 55.6 |
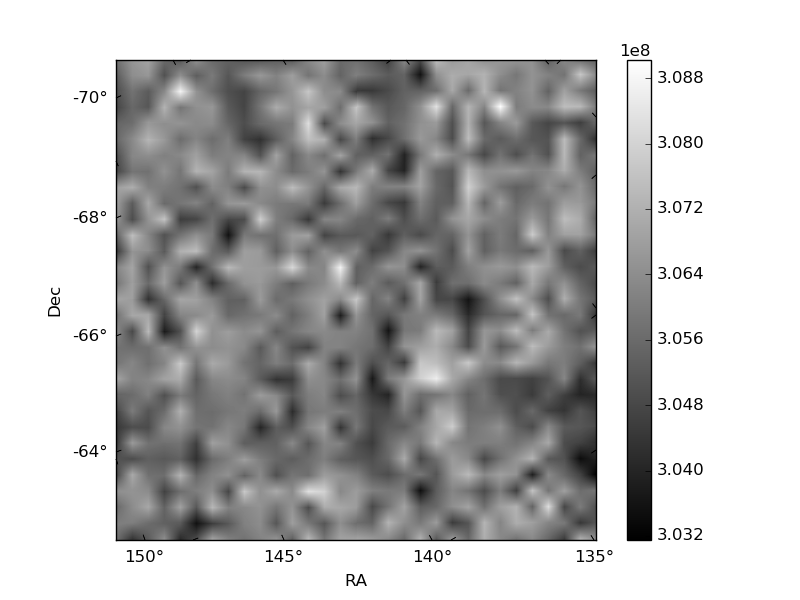
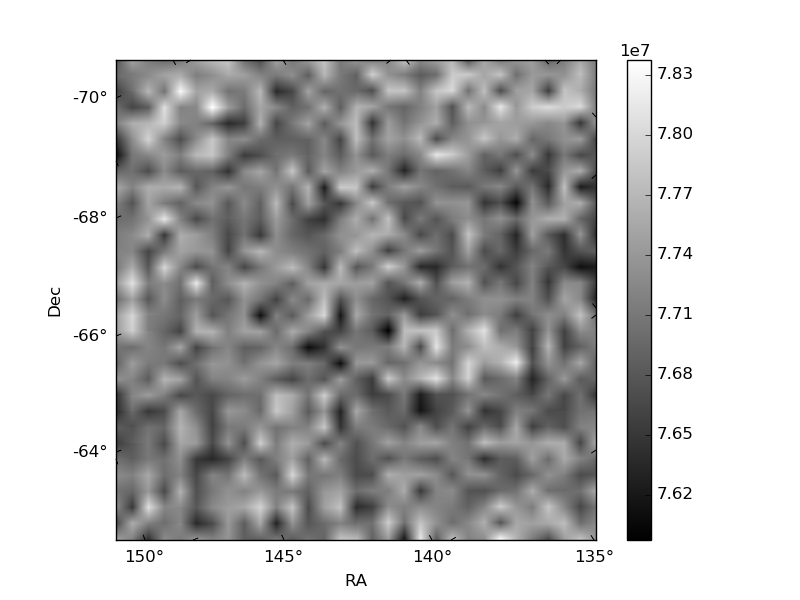
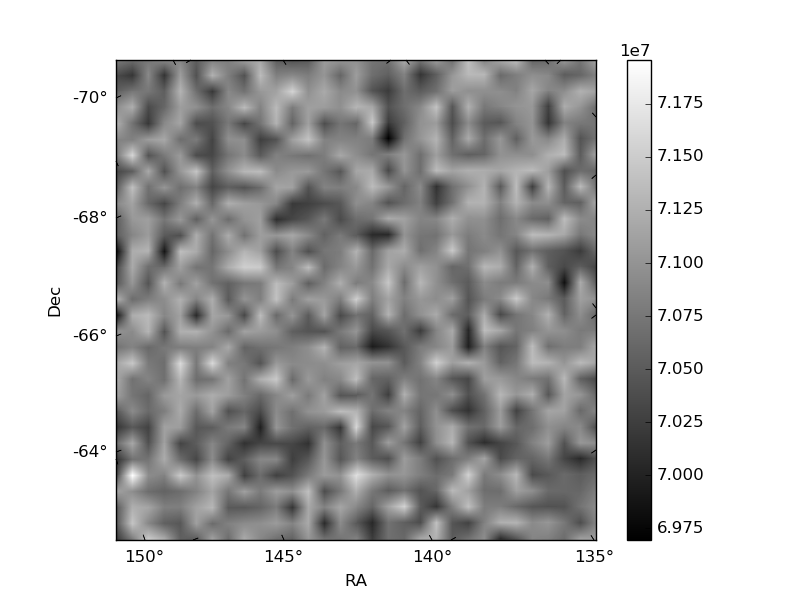
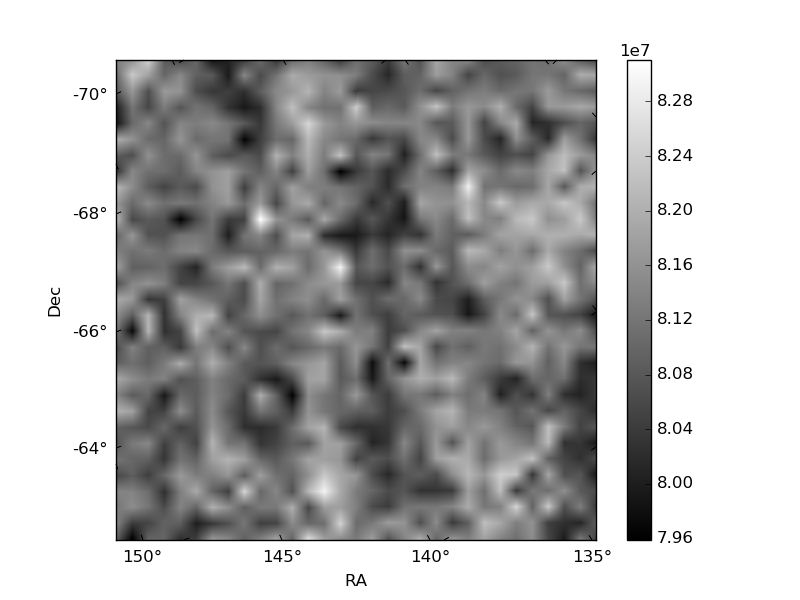
Histogram calculated using DETX and DETY for each event in the final _common_clean file
| Quadrant A | 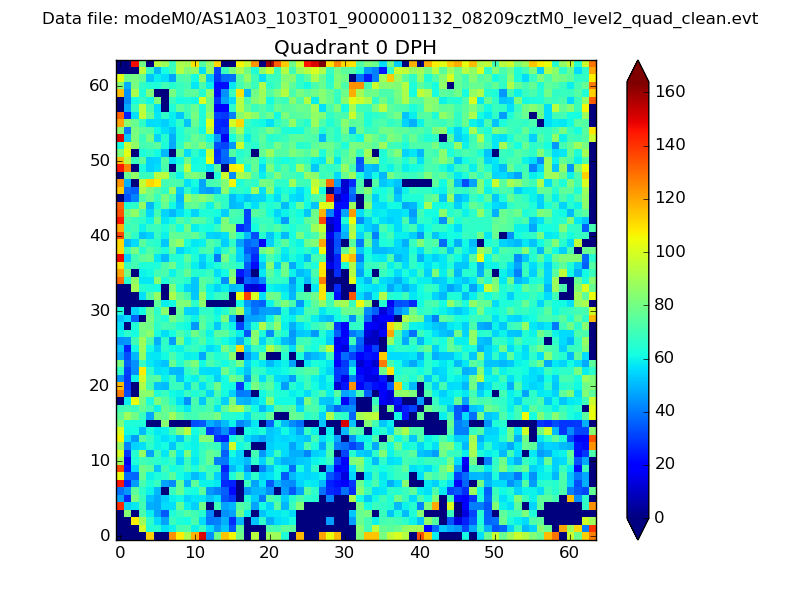 |
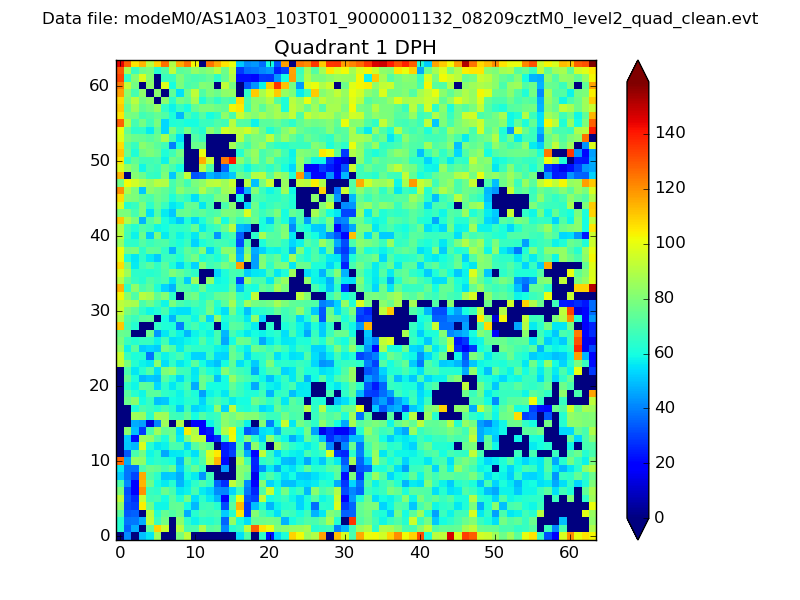 |
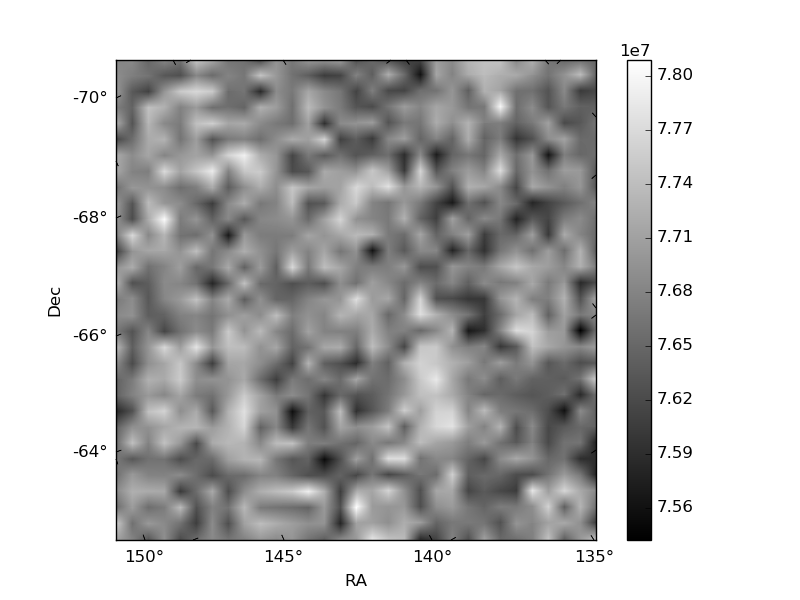
Quadrant B |
|---|---|---|---|
| Quadrant D | 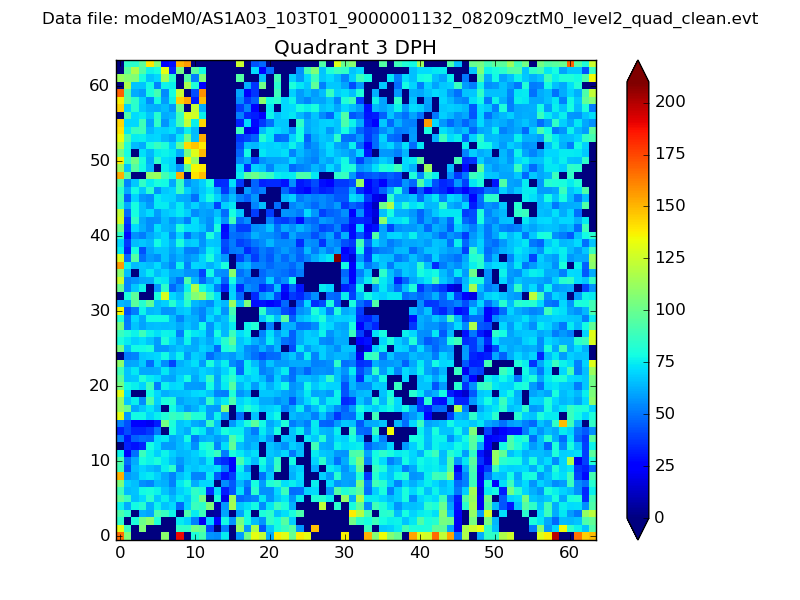 |
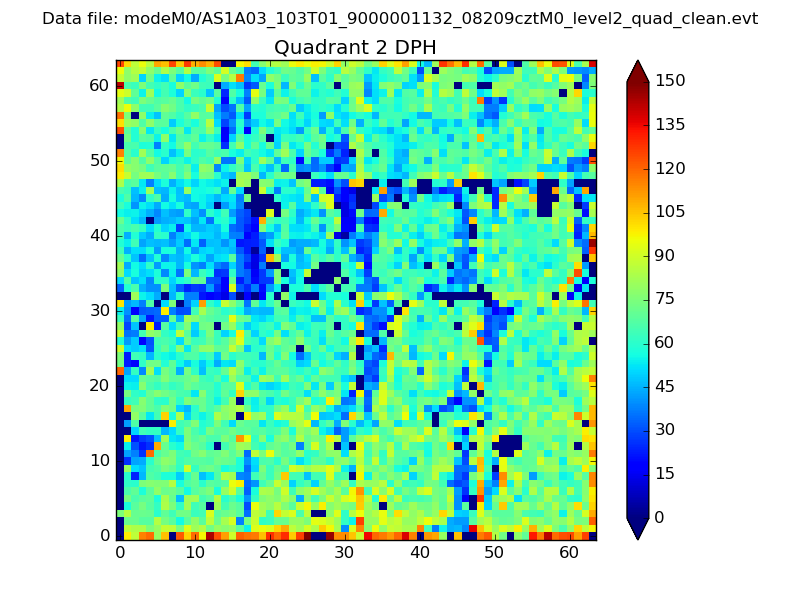 |
Quadrant C |
| Plot type | Count rate plots | Images |
|---|---|---|
| Comparison with Poisson distribution Blue bars denote a histogram of data divided into 1 sec bins. Red curve is a Poisson curve with rate = median count rate of data. |
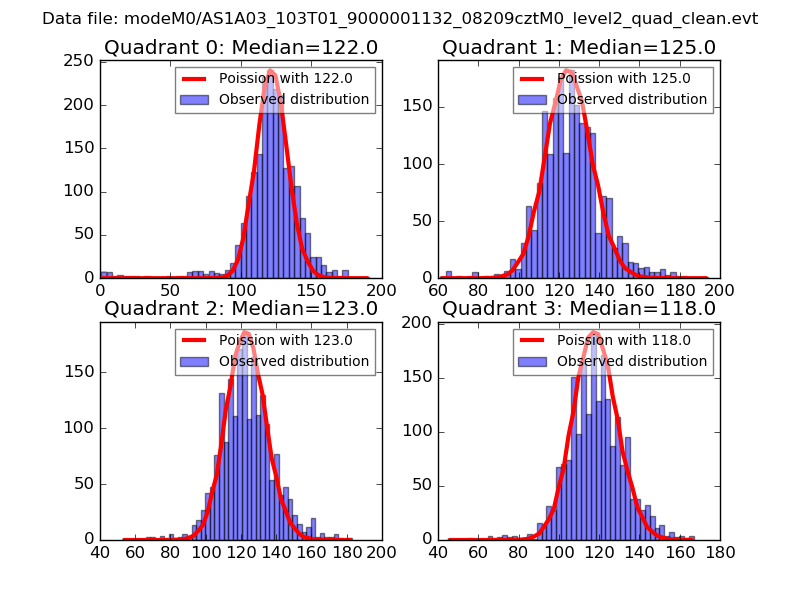 |
 |
| Quadrant-wise count rates Data is divided into 100 sec bins |
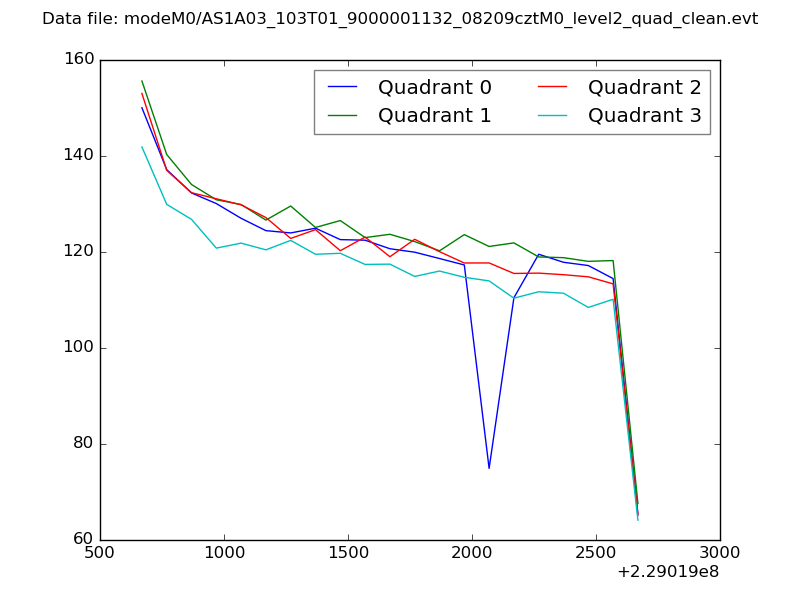 |
|
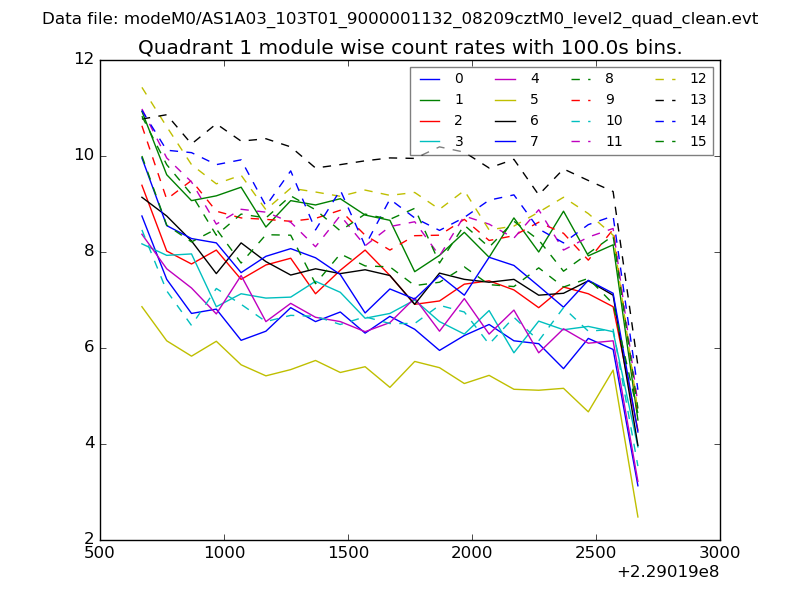
| Module-wise count rates for Quadrant A Data is divided into 100 sec bins |
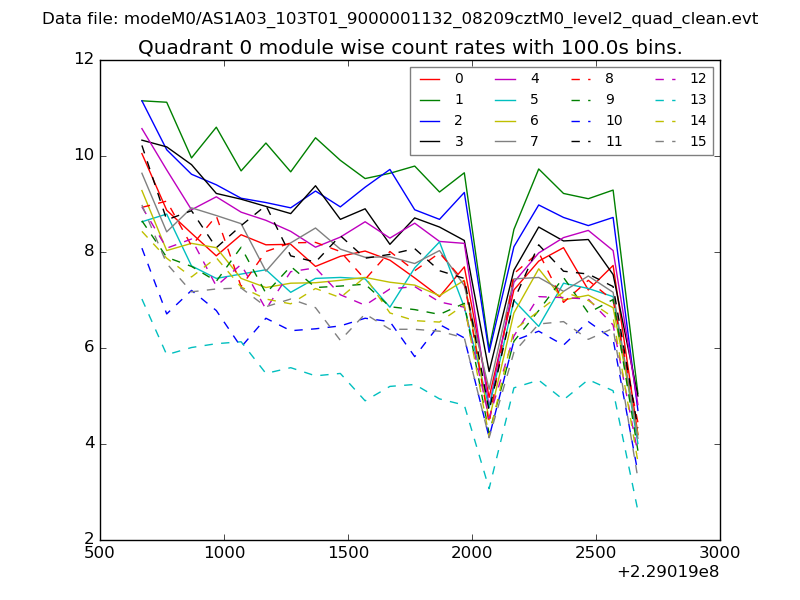 |
 |
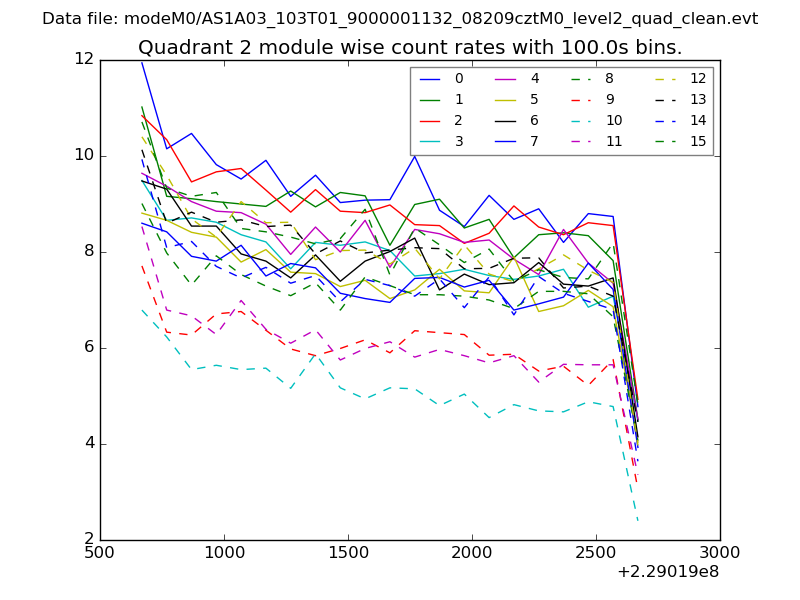
| Module-wise count rates for Quadrant B Data is divided into 100 sec bins |
 |
 |
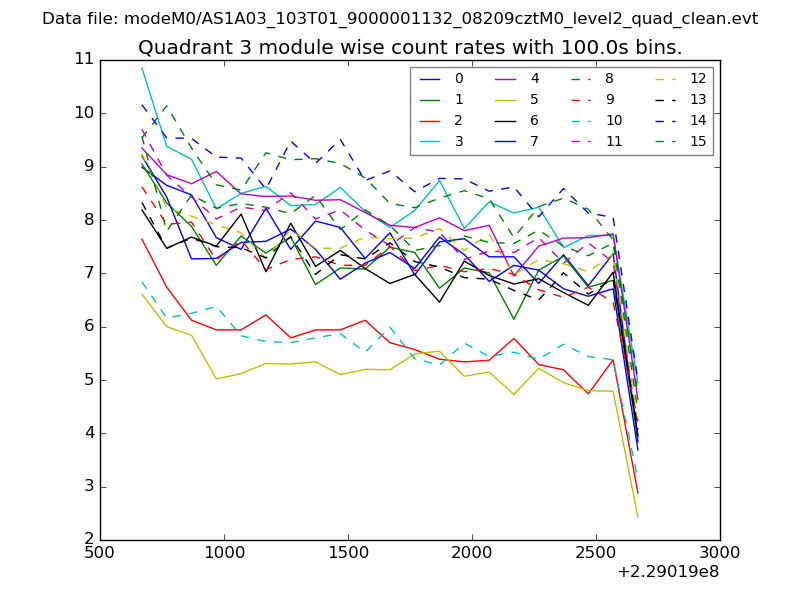
| Module-wise count rates for Quadrant C Data is divided into 100 sec bins |
 |
 |
| Module-wise count rates for Quadrant D Data is divided into 100 sec bins |
 |
 |
| Parameter | Plot |
|---|---|
| CZT HV Monitor | 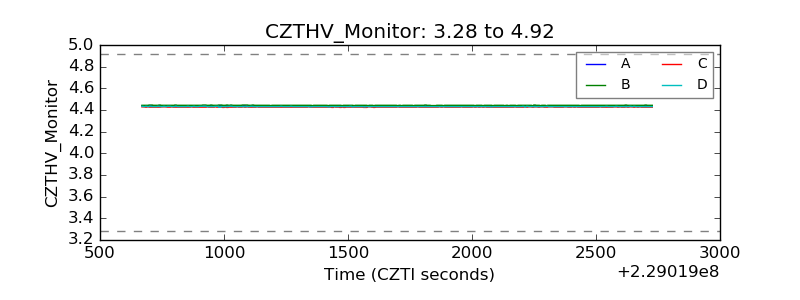 |
| D_VDD |  |
| Temperature 1 | 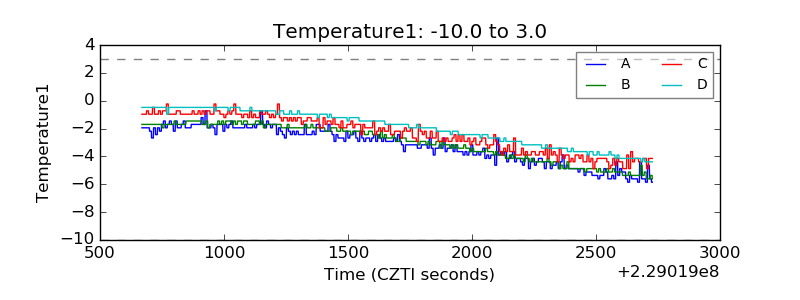 |
| Veto HV Monitor | 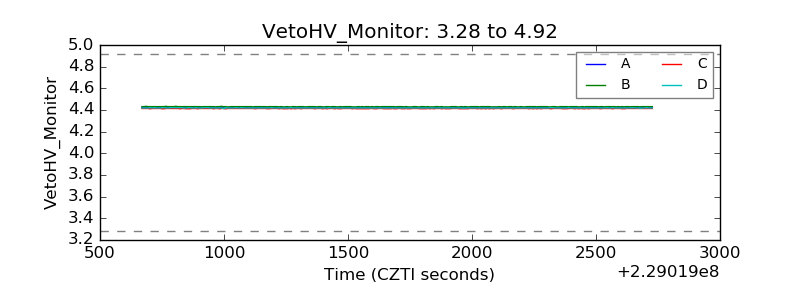 |
| Veto LLD | 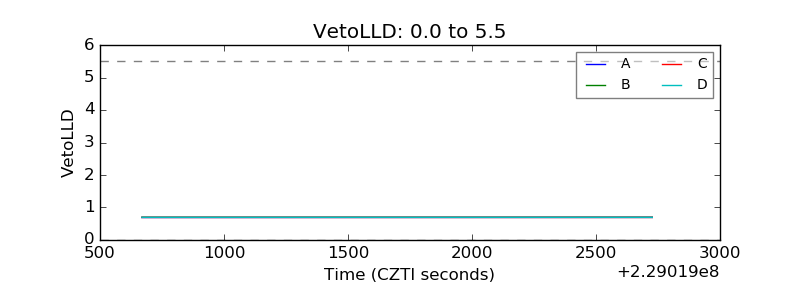 |
| Alpha Counter | 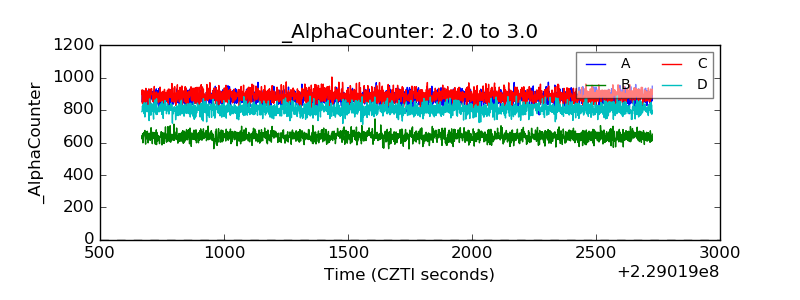 |
| _CPM_Rate | 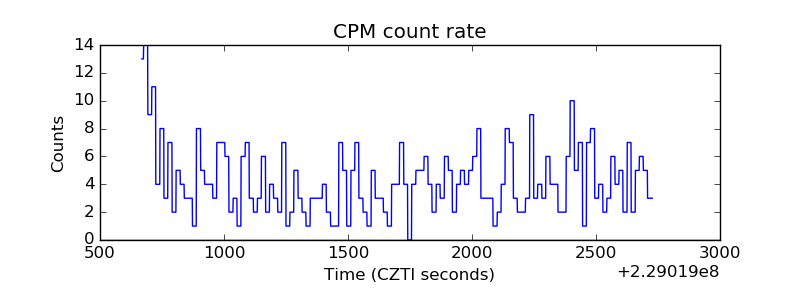 |
| CZT Counter | 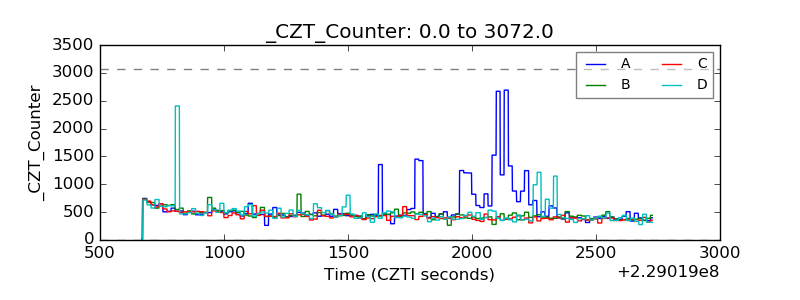 |
| +2.5 Volts monitor |  |
| +5 Volts monitor |  |
| _ROLL_ROT | 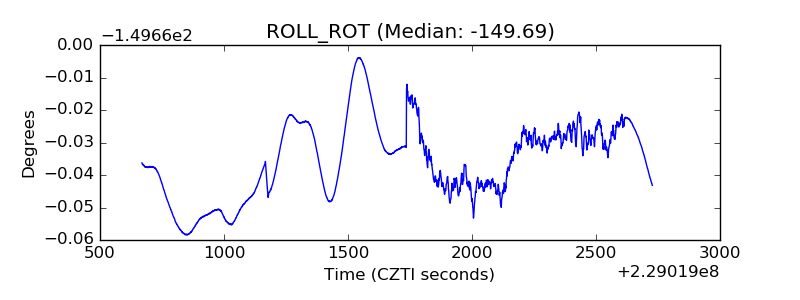 |
| _Roll_DEC | 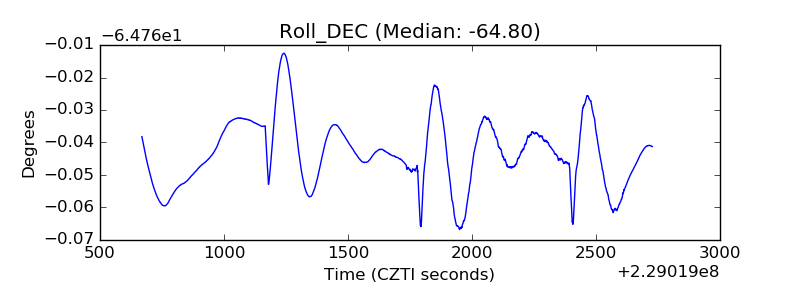 |
| _Roll_RA | 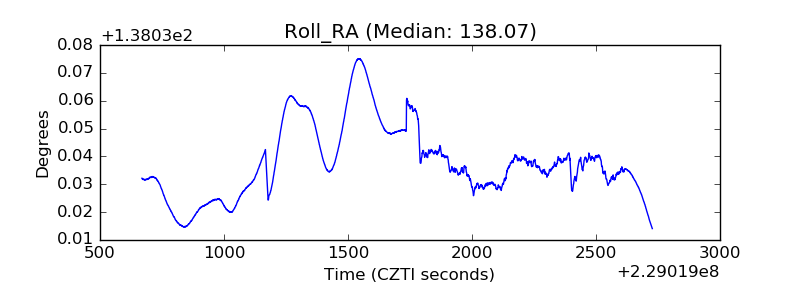 |
| Veto Counter | 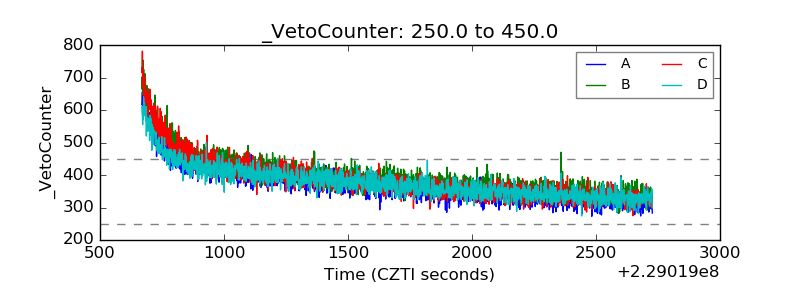 |