| Param | Original file | Final file |
|---|---|---|
| Filename | modeM0/AS1C02_041T01_9000001136cztM0_level2.fits | modeM0/AS1C02_041T01_9000001136cztM0_level2_quad_clean.evt |
| Size (bytes) | 837,446,400 | 839,793,600 |
| Size | 798.7 MB | 800.9 MB |
| Events in quadrant A | 5,070,650 | 5,050,714 |
| Events in quadrant B | 4,858,198 | 5,004,468 |
| Events in quadrant C | 4,930,920 | 4,758,910 |
| Events in quadrant D | 4,325,862 | 4,443,795 |
| Mode M9 | |||
|---|---|---|---|
| Quadrant | BADHDUFLAG | Total packets | Discarded packets |
| A | 0 | 122 | 0 |
| B | 0 | 122 | 0 |
| C | 0 | 122 | 0 |
| D | 0 | 122 | 0 |
| Mode SS | |||
|---|---|---|---|
| Quadrant | BADHDUFLAG | Total packets | Discarded packets |
| A | 0 | 1838 | 0 |
| B | 0 | 1838 | 0 |
| C | 0 | 1838 | 0 |
| D | 0 | 1838 | 0 |
| Mode M0 | |||
|---|---|---|---|
| Quadrant | BADHDUFLAG | Total packets | Discarded packets |
| A | 0 | 191215 | 0 |
| B | 0 | 195299 | 0 |
| C | 0 | 189651 | 0 |
| D | 0 | 199339 | 0 |
| Quadrant | Total seconds | Saturated seconds | Saturation percentage |
|---|---|---|---|
| A | 90086 | 1091 | 1.211065% |
| B | 90085 | 1359 | 1.508575% |
| C | 90086 | 602 | 0.668250% |
| D | 90085 | 1295 | 1.437531% |
Noise dominated data is calculated using 1-second bins in cleaned event files. If a bin has >2000 counts, and if more than 50% of those come from <1% of pixels, then it is considered to be noise-dominated and hence unusable.
| Quadrant | # 1 sec bins | Bins with >0 counts | Bins with >2000 counts | High rate bins dominated by noise | Noise dominated (total time) | Noise dominated (detector-on time) | Marked lightcurve |
|---|---|---|---|---|---|---|---|
| A | 102462 | 90073 | 0 | 0 | 0.00% | 0.00% |  |
| B | 102462 | 90077 | 0 | 0 | 0.00% | 0.00% | 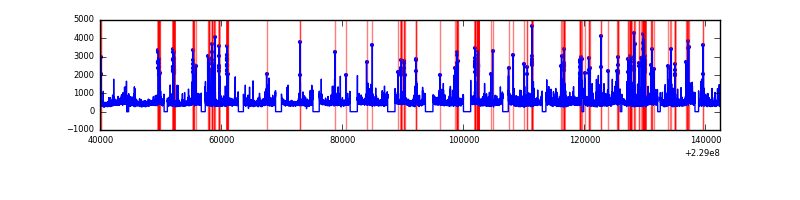 |
| C | 102462 | 90083 | 0 | 0 | 0.00% | 0.00% | 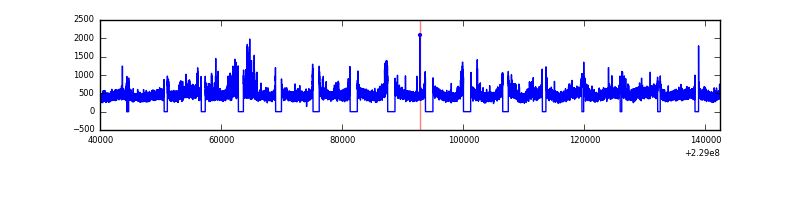 |
| D | 102462 | 90078 | 0 | 0 | 0.00% | 0.00% |  |
Top three noisy pixels from each quadrant. If the there are fewer than three noisy pixels in the level2.evt file, extra rows are filled as -1
| Pixel properties | Quadrant properties | ||||||
|---|---|---|---|---|---|---|---|
| Quadrant | DetID | PixID | Counts | Sigma | Mean | Median | Sigma |
| A | 14 | 188 | 5084 | 11.64 | 1313 | 1223 | 331.7 |
| A | 0 | 29 | 4820 | 10.84 | 1313 | 1223 | 331.7 |
| A | 14 | 204 | 4373 | 9.49 | 1313 | 1223 | 331.7 |
| B | 2 | 9 | 4174 | 11.63 | 1279 | 1214 | 254.4 |
| B | 12 | 226 | 3246 | 7.99 | 1279 | 1214 | 254.4 |
| B | 14 | 254 | 3223 | 7.89 | 1279 | 1214 | 254.4 |
| C | 1 | 80 | 3596 | 6.92 | 1302 | 1201 | 346.1 |
| C | 1 | 81 | 3555 | 6.8 | 1302 | 1201 | 346.1 |
| C | 3 | 158 | 3447 | 6.49 | 1302 | 1201 | 346.1 |
| D | 3 | 14 | 3245 | 6.39 | 1232 | 1121 | 332.5 |
| D | 6 | 231 | 3165 | 6.15 | 1232 | 1121 | 332.5 |
| D | 7 | 5 | 3138 | 6.07 | 1232 | 1121 | 332.5 |
Histogram calculated using DETX and DETY for each event in the final _common_clean file
| Quadrant A | 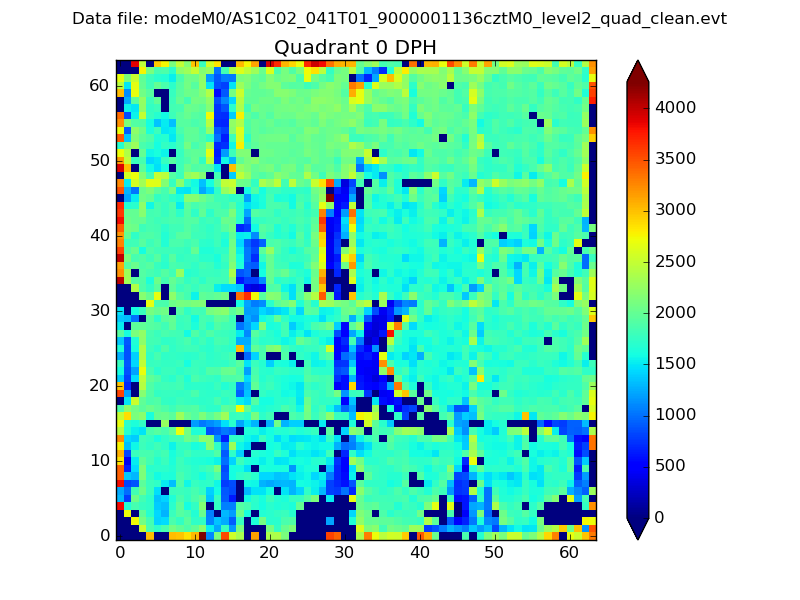 |
 |
Quadrant B |
|---|---|---|---|
| Quadrant D | 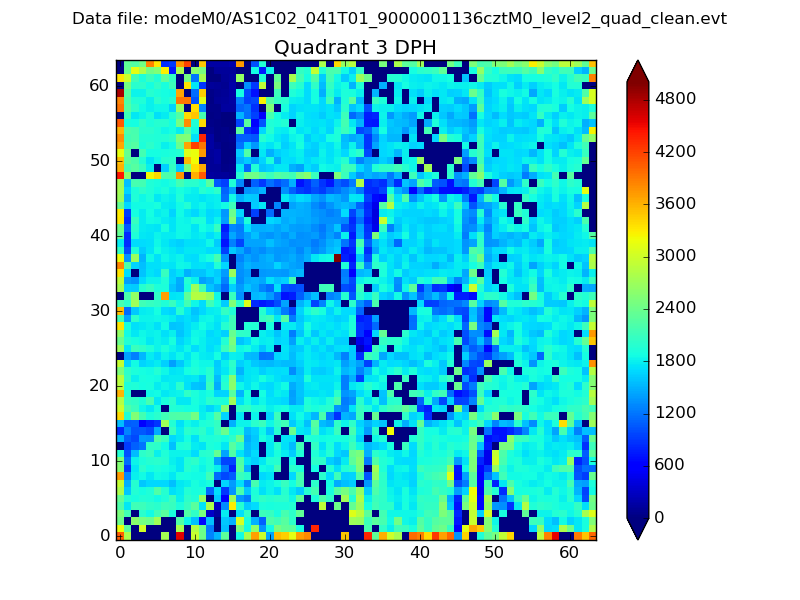 |
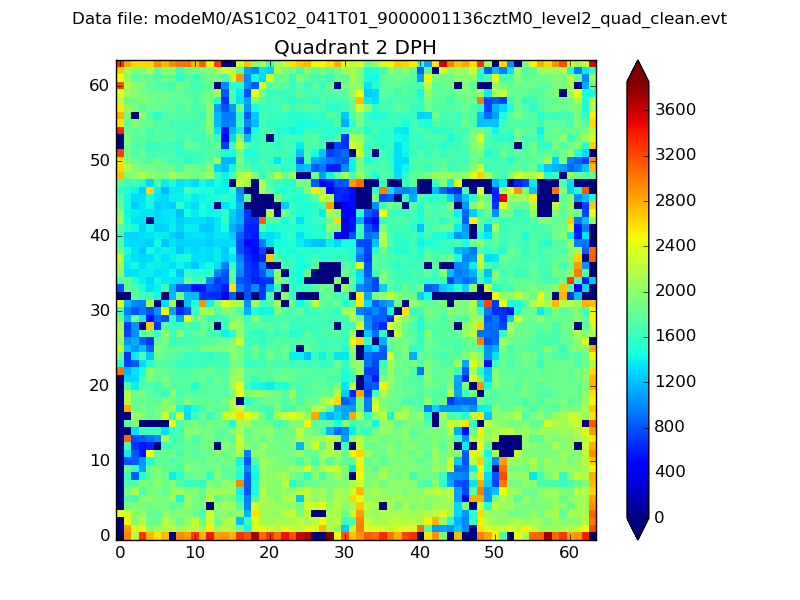 |
Quadrant C |
| Plot type | Count rate plots | Images |
|---|---|---|
| Comparison with Poisson distribution Blue bars denote a histogram of data divided into 1 sec bins. Red curve is a Poisson curve with rate = median count rate of data. |
 |
 |
| Quadrant-wise count rates Data is divided into 100 sec bins |
 |
|
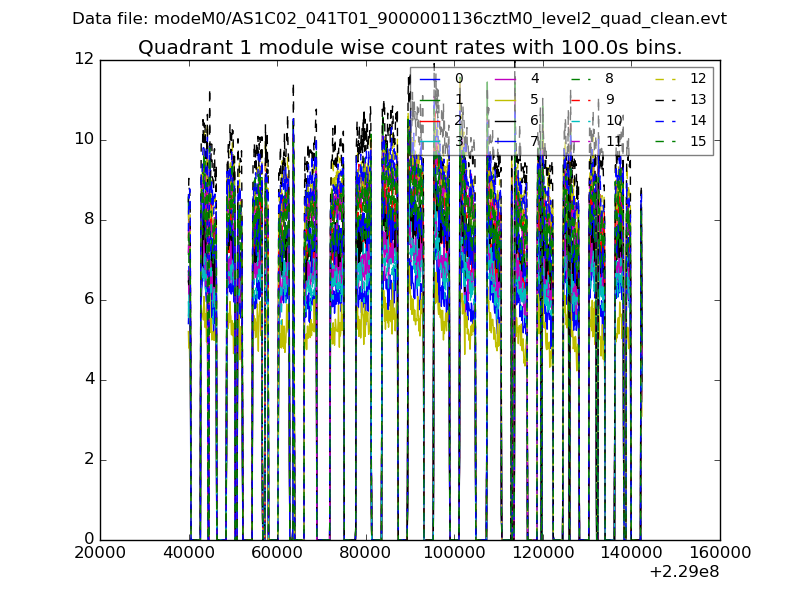
| Module-wise count rates for Quadrant A Data is divided into 100 sec bins |
 |
 |
| Module-wise count rates for Quadrant B Data is divided into 100 sec bins |
 |
 |
| Module-wise count rates for Quadrant C Data is divided into 100 sec bins |
 |
 |
| Module-wise count rates for Quadrant D Data is divided into 100 sec bins |
 |
 |
| Parameter | Plot |
|---|---|
| CZT HV Monitor |  |
| D_VDD | 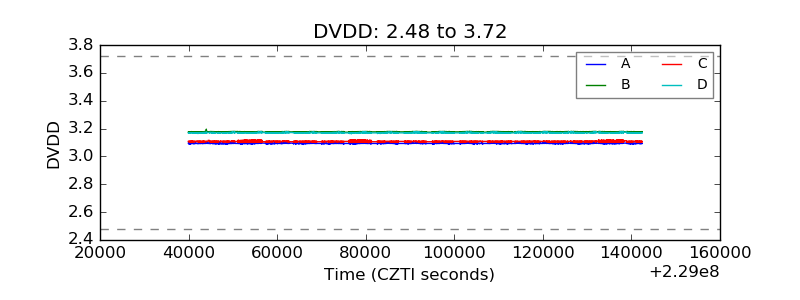 |
| Temperature 1 |  |
| Veto HV Monitor |  |
| Veto LLD |  |
| Alpha Counter |  |
| _CPM_Rate |  |
| CZT Counter |  |
| +2.5 Volts monitor | 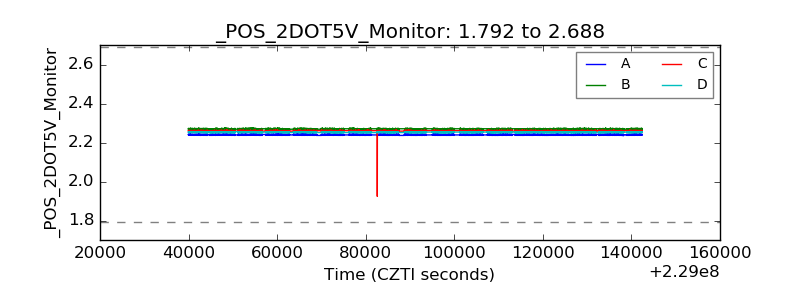 |
| +5 Volts monitor | 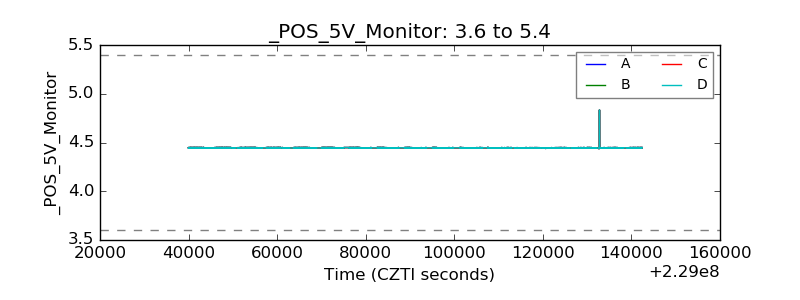 |
| _ROLL_ROT |  |
| _Roll_DEC | 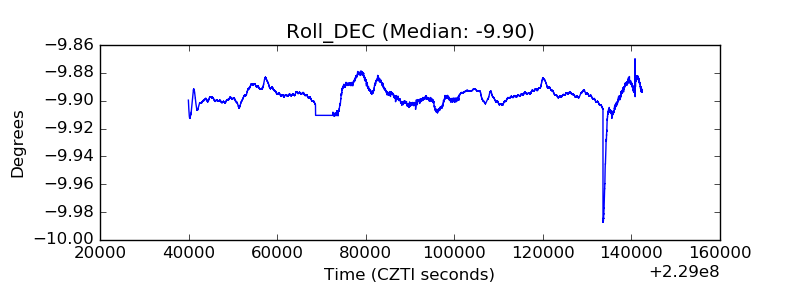 |
| _Roll_RA |  |
| Veto Counter |  |