| Param | Original file | Final file |
|---|---|---|
| Filename | modeM0/AS1C02_041T01_9000001136_08212cztM0_level2.evt | modeM0/AS1C02_041T01_9000001136_08212cztM0_level2_quad_clean.evt |
| Size (bytes) | 376,528,320 | 72,921,600 |
| Size | 359.1 MB | 69.5 MB |
| Events in quadrant A | 2,758,688 | 453,429 |
| Events in quadrant B | 2,840,675 | 454,908 |
| Events in quadrant C | 2,617,235 | 445,206 |
| Events in quadrant D | 2,778,321 | 435,713 |
| Mode M9 | |||
|---|---|---|---|
| Quadrant | BADHDUFLAG | Total packets | Discarded packets |
| A | 0 | 2 | 0 |
| B | 0 | 2 | 0 |
| C | 0 | 2 | 0 |
| D | 0 | 2 | 0 |
| Mode SS | |||
|---|---|---|---|
| Quadrant | BADHDUFLAG | Total packets | Discarded packets |
| A | 0 | 124 | 0 |
| B | 0 | 124 | 0 |
| C | 0 | 124 | 0 |
| D | 0 | 124 | 0 |
| Mode M0 | |||
|---|---|---|---|
| Quadrant | BADHDUFLAG | Total packets | Discarded packets |
| A | 0 | 12431 | 3 |
| B | 0 | 12637 | 2 |
| C | 0 | 12170 | 2 |
| D | 0 | 12587 | 2 |
| Quadrant | Total seconds | Saturated seconds | Saturation percentage |
|---|---|---|---|
| A | 5988 | 52 | 0.868403% |
| B | 5988 | 49 | 0.818303% |
| C | 5988 | 23 | 0.384102% |
| D | 5988 | 25 | 0.417502% |
Noise dominated data is calculated using 1-second bins in cleaned event files. If a bin has >2000 counts, and if more than 50% of those come from <1% of pixels, then it is considered to be noise-dominated and hence unusable.
| Quadrant | # 1 sec bins | Bins with >0 counts | Bins with >2000 counts | High rate bins dominated by noise | Noise dominated (total time) | Noise dominated (detector-on time) | Marked lightcurve |
|---|---|---|---|---|---|---|---|
| A | 6293 | 5990 | 18 | 18 | 0.29% | 0.30% |  |
| B | 6293 | 5990 | 2 | 2 | 0.03% | 0.03% | 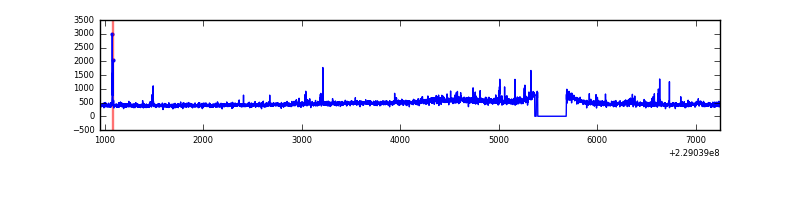 |
| C | 6293 | 5990 | 0 | 0 | 0.00% | 0.00% | 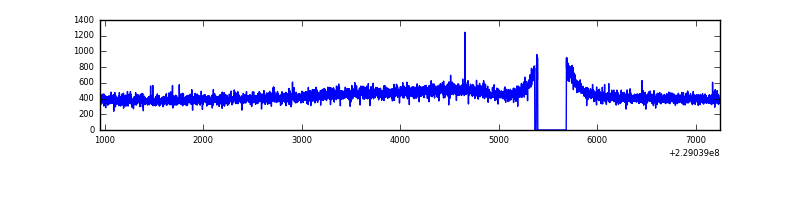 |
| D | 6293 | 5990 | 3 | 3 | 0.05% | 0.05% | 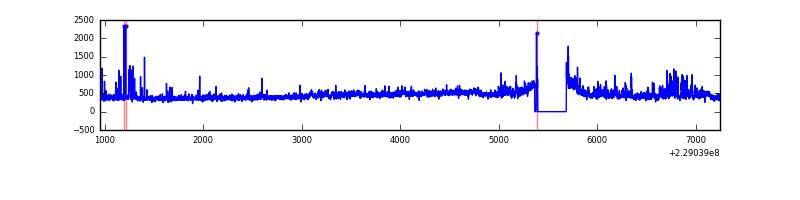 |
Top three noisy pixels from each quadrant. If the there are fewer than three noisy pixels in the level2.evt file, extra rows are filled as -1
| Pixel properties | Quadrant properties | ||||||
|---|---|---|---|---|---|---|---|
| Quadrant | DetID | PixID | Counts | Sigma | Mean | Median | Sigma |
| A | 5 | 16 | 72207 | 499.13 | 693 | 678 | 143.3 |
| A | 8 | 15 | 17856 | 119.87 | 693 | 678 | 143.3 |
| A | 0 | 226 | 6581 | 41.19 | 693 | 678 | 143.3 |
| B | 0 | 214 | 72962 | 532.83 | 697 | 680 | 135.7 |
| B | 0 | 213 | 21547 | 153.82 | 697 | 680 | 135.7 |
| B | 4 | 81 | 18657 | 132.52 | 697 | 680 | 135.7 |
| C | 13 | 61 | 5278 | 29.25 | 670 | 671 | 157.5 |
| C | 9 | 68 | 3704 | 19.26 | 670 | 671 | 157.5 |
| C | 1 | 16 | 1795 | 7.14 | 670 | 671 | 157.5 |
| D | 2 | 152 | 127646 | 740.69 | 668 | 650 | 171.5 |
| D | 1 | 52 | 63330 | 365.58 | 668 | 650 | 171.5 |
| D | 2 | 234 | 21162 | 119.63 | 668 | 650 | 171.5 |
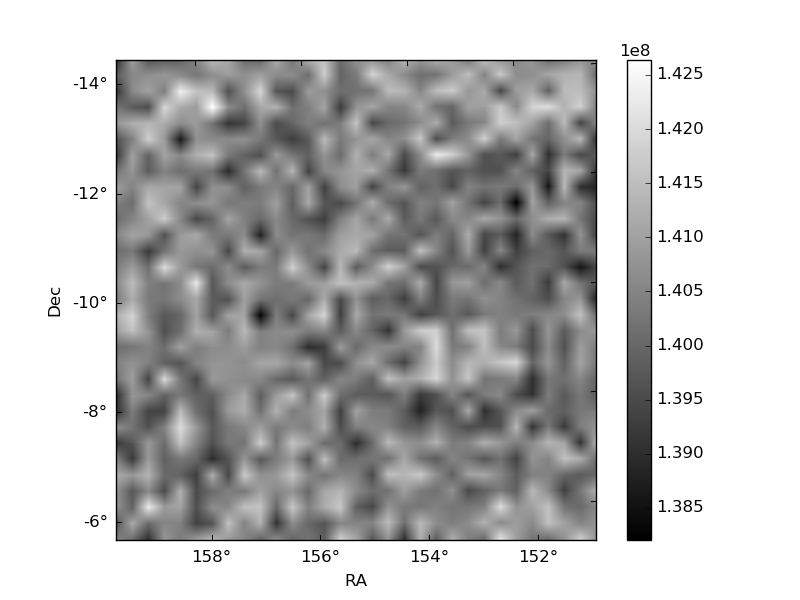
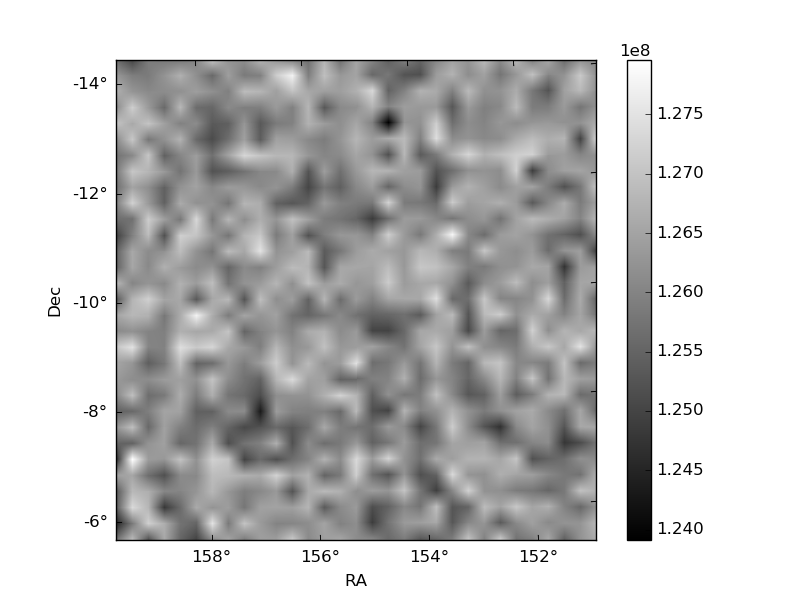
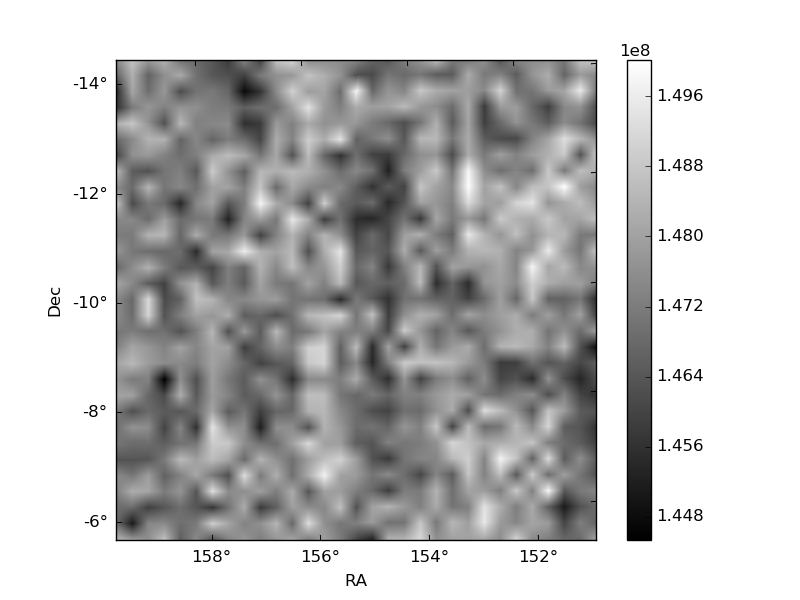
Histogram calculated using DETX and DETY for each event in the final _common_clean file
| Quadrant A | 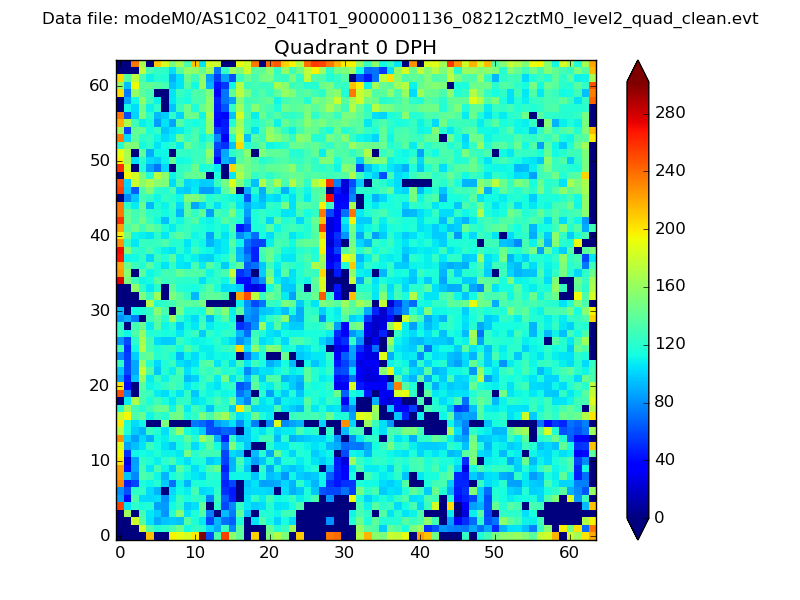 |
 |
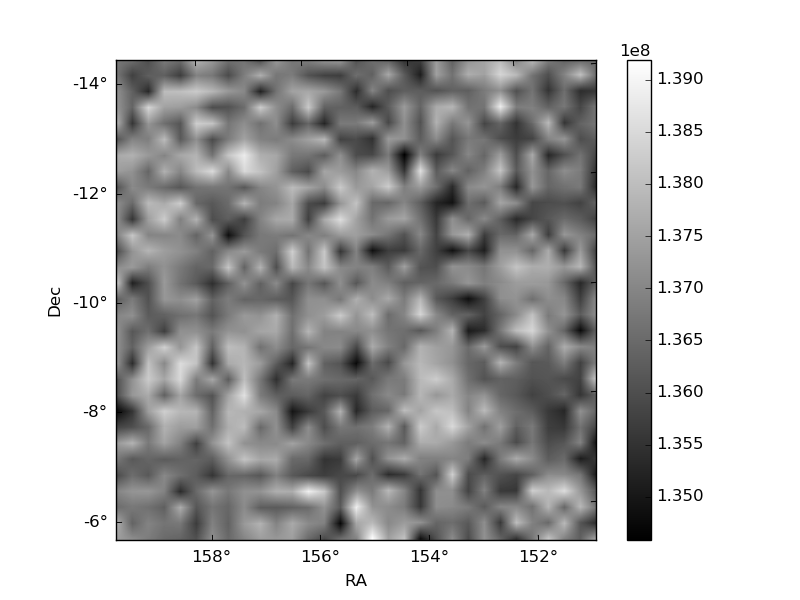
Quadrant B |
|---|---|---|---|
| Quadrant D | 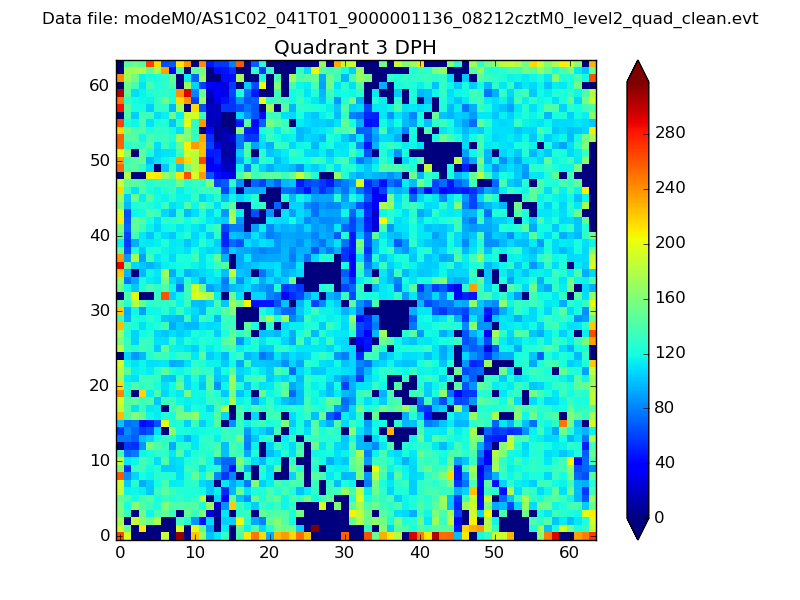 |
 |
Quadrant C |
| Plot type | Count rate plots | Images |
|---|---|---|
| Comparison with Poisson distribution Blue bars denote a histogram of data divided into 1 sec bins. Red curve is a Poisson curve with rate = median count rate of data. |
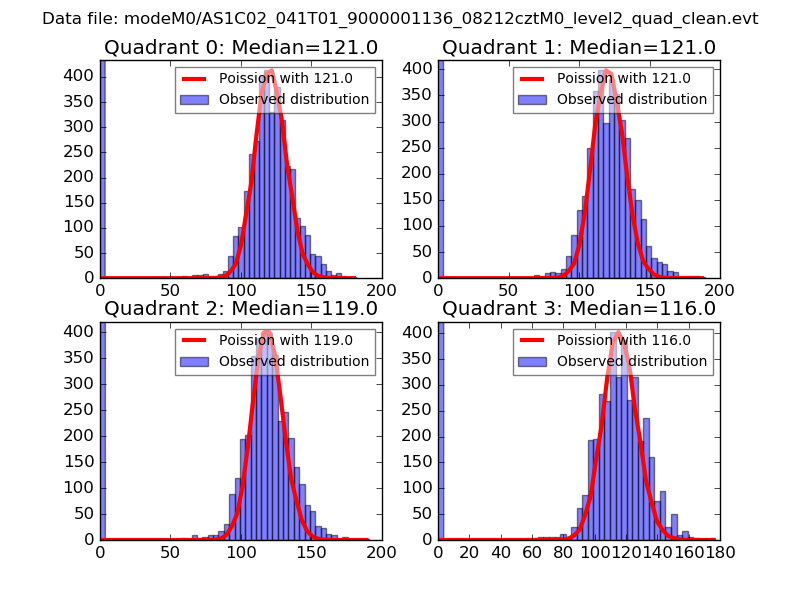 |
 |
| Quadrant-wise count rates Data is divided into 100 sec bins |
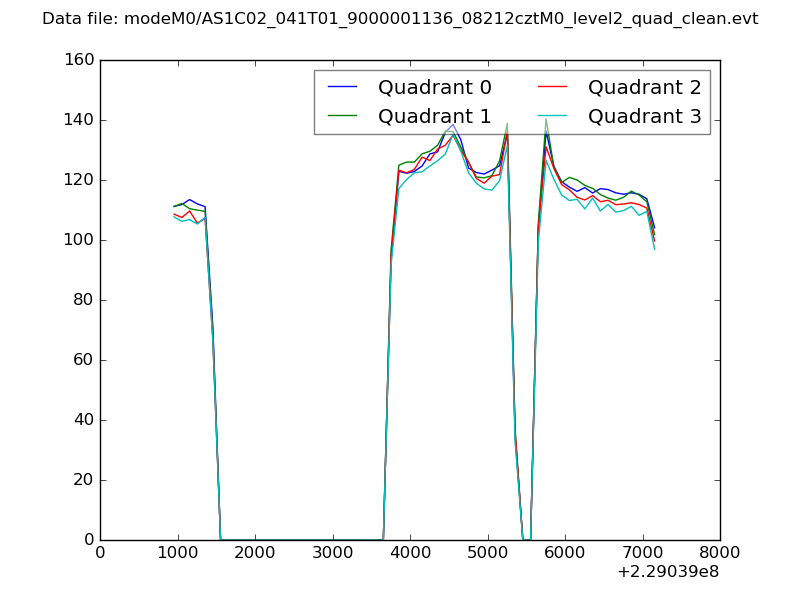 |
|
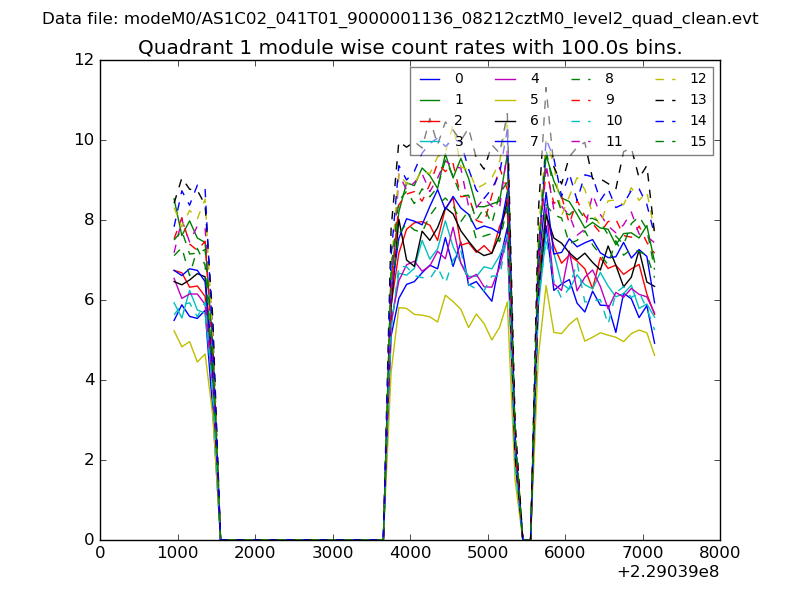
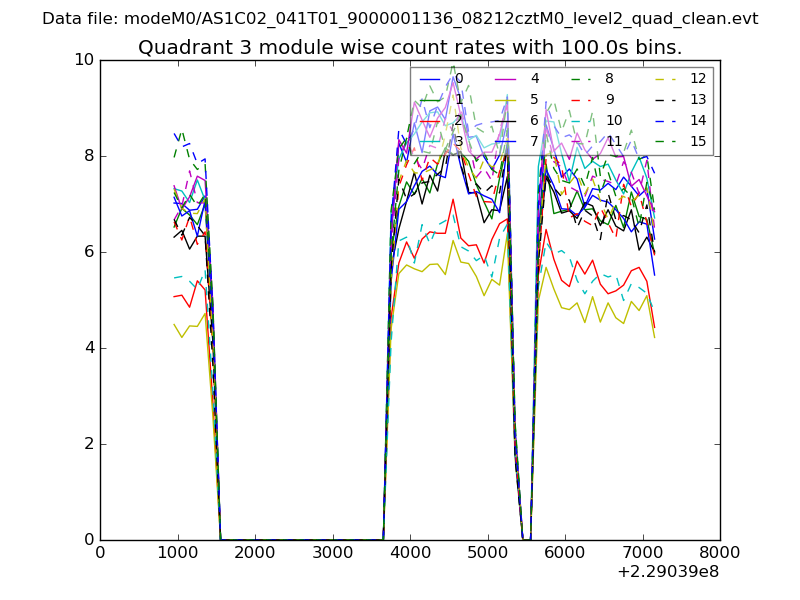
| Module-wise count rates for Quadrant A Data is divided into 100 sec bins |
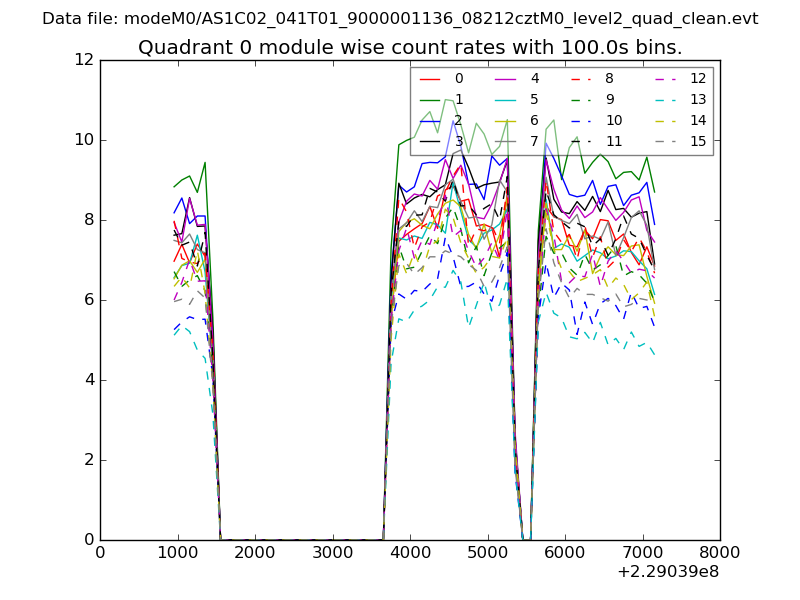 |
 |
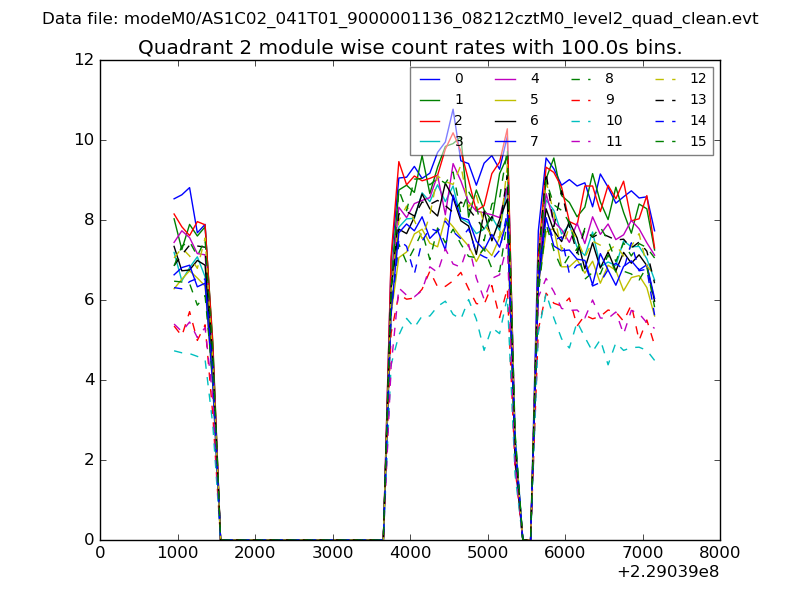
| Module-wise count rates for Quadrant B Data is divided into 100 sec bins |
 |
 |
| Module-wise count rates for Quadrant C Data is divided into 100 sec bins |
 |
 |
| Module-wise count rates for Quadrant D Data is divided into 100 sec bins |
 |
 |
| Parameter | Plot |
|---|---|
| CZT HV Monitor | 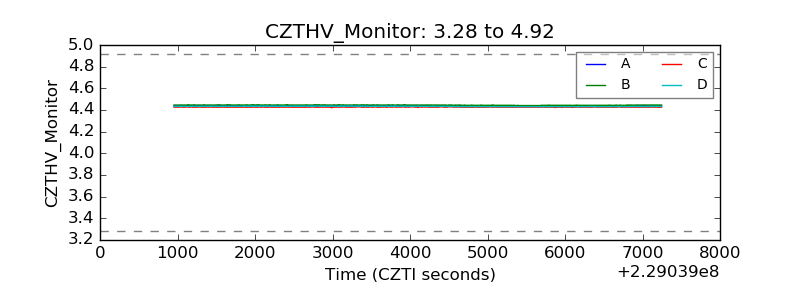 |
| D_VDD | 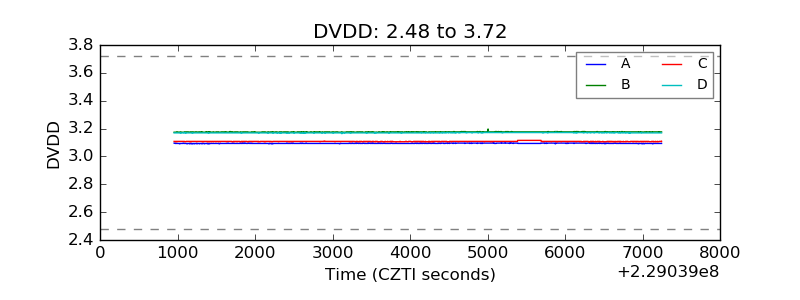 |
| Temperature 1 | 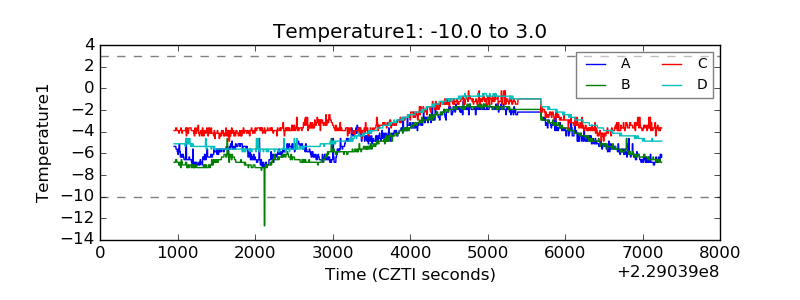 |
| Veto HV Monitor | 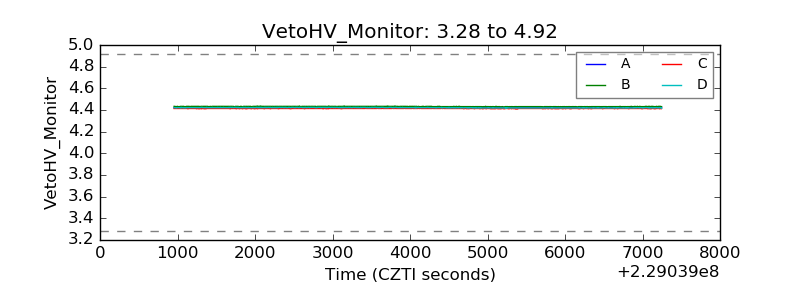 |
| Veto LLD | 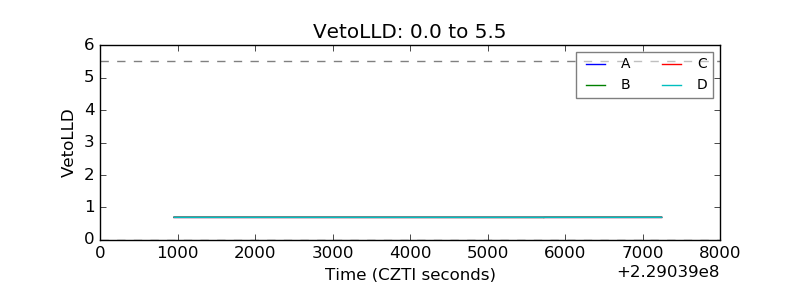 |
| Alpha Counter |  |
| _CPM_Rate | 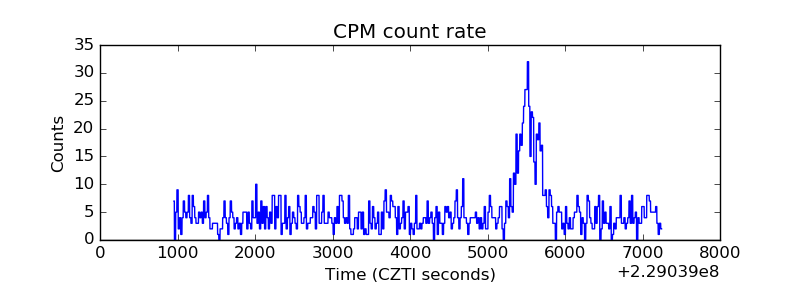 |
| CZT Counter | 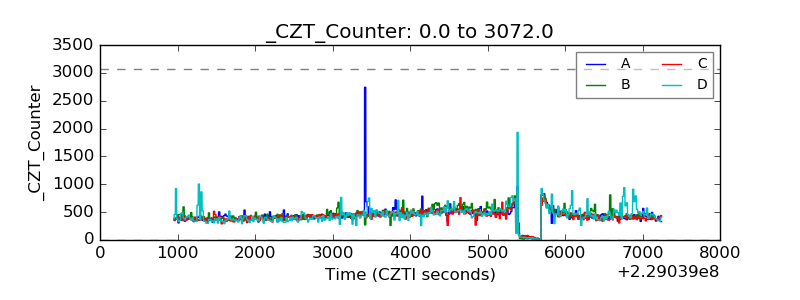 |
| +2.5 Volts monitor |  |
| +5 Volts monitor |  |
| _ROLL_ROT | 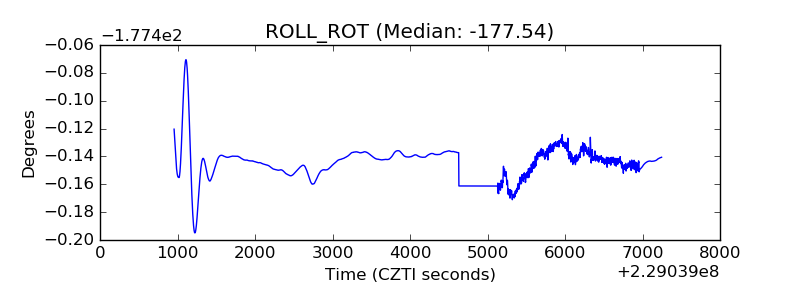 |
| _Roll_DEC | 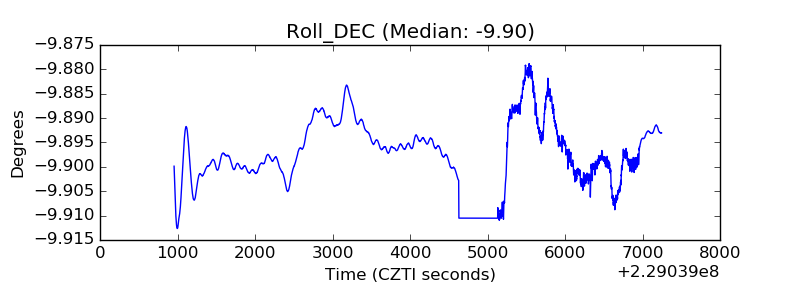 |
| _Roll_RA | 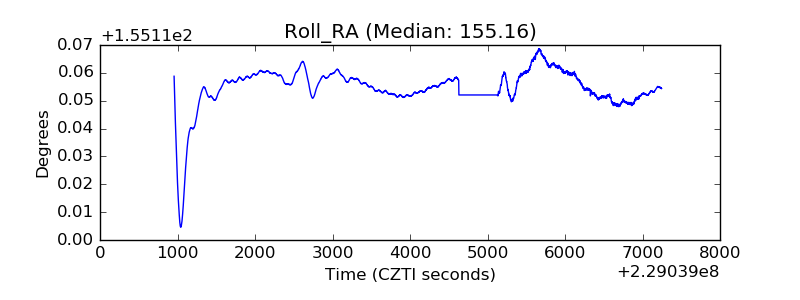 |
| Veto Counter | 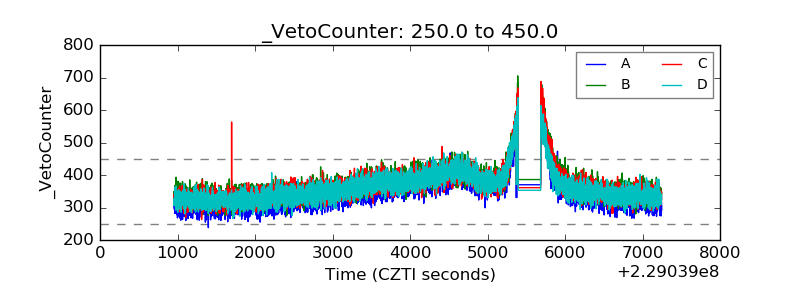 |