| Param | Original file | Final file |
|---|---|---|
| Filename | modeM0/AS1C02_041T01_9000001136_08215cztM0_level2.evt | modeM0/AS1C02_041T01_9000001136_08215cztM0_level2_quad_clean.evt |
| Size (bytes) | 1,243,025,280 | 211,536,000 |
| Size | 1.2 GB | 201.7 MB |
| Events in quadrant A | 8,784,234 | 1,297,983 |
| Events in quadrant B | 9,261,778 | 1,299,607 |
| Events in quadrant C | 9,276,548 | 1,275,138 |
| Events in quadrant D | 9,056,949 | 1,244,517 |
| Mode M9 | |||
|---|---|---|---|
| Quadrant | BADHDUFLAG | Total packets | Discarded packets |
| A | 0 | 22 | 0 |
| B | 0 | 22 | 0 |
| C | 0 | 22 | 0 |
| D | 0 | 22 | 0 |
| Mode SS | |||
|---|---|---|---|
| Quadrant | BADHDUFLAG | Total packets | Discarded packets |
| A | 0 | 384 | 0 |
| B | 0 | 384 | 0 |
| C | 0 | 384 | 0 |
| D | 0 | 384 | 0 |
| Mode M0 | |||
|---|---|---|---|
| Quadrant | BADHDUFLAG | Total packets | Discarded packets |
| A | 0 | 39163 | 8 |
| B | 0 | 40170 | 7 |
| C | 0 | 40524 | 5 |
| D | 0 | 40302 | 9 |
| Quadrant | Total seconds | Saturated seconds | Saturation percentage |
|---|---|---|---|
| A | 18706 | 160 | 0.855341% |
| B | 18706 | 242 | 1.293703% |
| C | 18707 | 65 | 0.347464% |
| D | 18705 | 149 | 0.796578% |
Noise dominated data is calculated using 1-second bins in cleaned event files. If a bin has >2000 counts, and if more than 50% of those come from <1% of pixels, then it is considered to be noise-dominated and hence unusable.
| Quadrant | # 1 sec bins | Bins with >0 counts | Bins with >2000 counts | High rate bins dominated by noise | Noise dominated (total time) | Noise dominated (detector-on time) | Marked lightcurve |
|---|---|---|---|---|---|---|---|
| A | 21062 | 18712 | 58 | 58 | 0.28% | 0.31% | 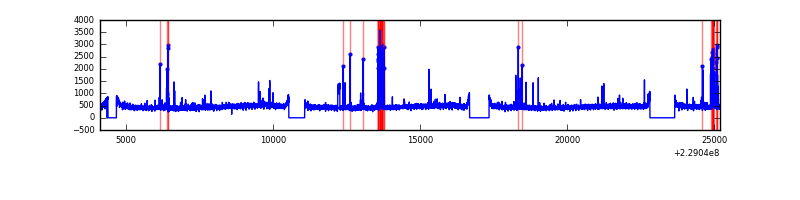 |
| B | 21062 | 18712 | 88 | 88 | 0.42% | 0.47% | 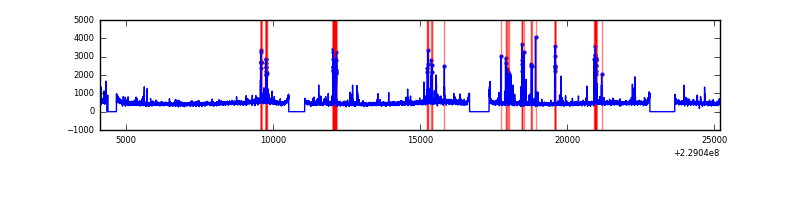 |
| C | 21062 | 18712 | 0 | 0 | 0.00% | 0.00% | 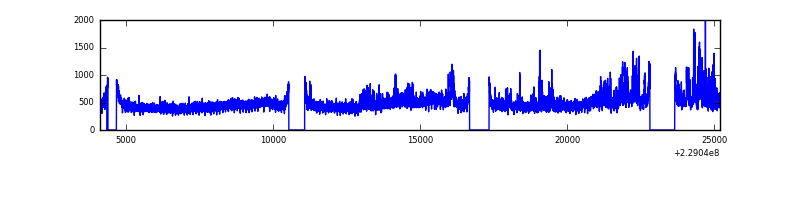 |
| D | 21062 | 18712 | 85 | 85 | 0.40% | 0.45% | 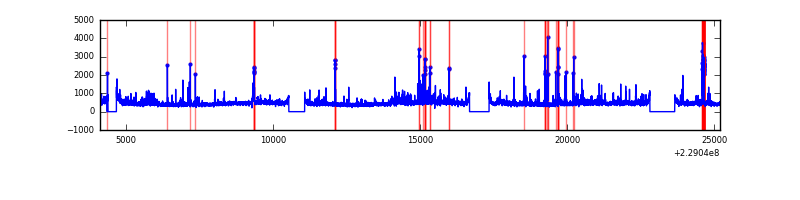 |
Top three noisy pixels from each quadrant. If the there are fewer than three noisy pixels in the level2.evt file, extra rows are filled as -1
| Pixel properties | Quadrant properties | ||||||
|---|---|---|---|---|---|---|---|
| Quadrant | DetID | PixID | Counts | Sigma | Mean | Median | Sigma |
| A | 5 | 16 | 358305 | 810.0 | 2164 | 2121 | 439.7 |
| A | 15 | 79 | 71029 | 156.7 | 2164 | 2121 | 439.7 |
| A | 8 | 15 | 20939 | 42.79 | 2164 | 2121 | 439.7 |
| B | 10 | 16 | 459145 | 1098.92 | 2173 | 2122 | 415.9 |
| B | 0 | 214 | 202254 | 481.22 | 2173 | 2122 | 415.9 |
| B | 4 | 81 | 89527 | 210.17 | 2173 | 2122 | 415.9 |
| C | 9 | 68 | 1096430 | 2238.62 | 2091 | 2100 | 488.8 |
| C | 13 | 61 | 16159 | 28.76 | 2091 | 2100 | 488.8 |
| C | 8 | 128 | 15549 | 27.51 | 2091 | 2100 | 488.8 |
| D | 1 | 52 | 448346 | 790.86 | 2075 | 2028 | 564.3 |
| D | 2 | 152 | 194201 | 340.52 | 2075 | 2028 | 564.3 |
| D | 1 | 7 | 185874 | 325.77 | 2075 | 2028 | 564.3 |
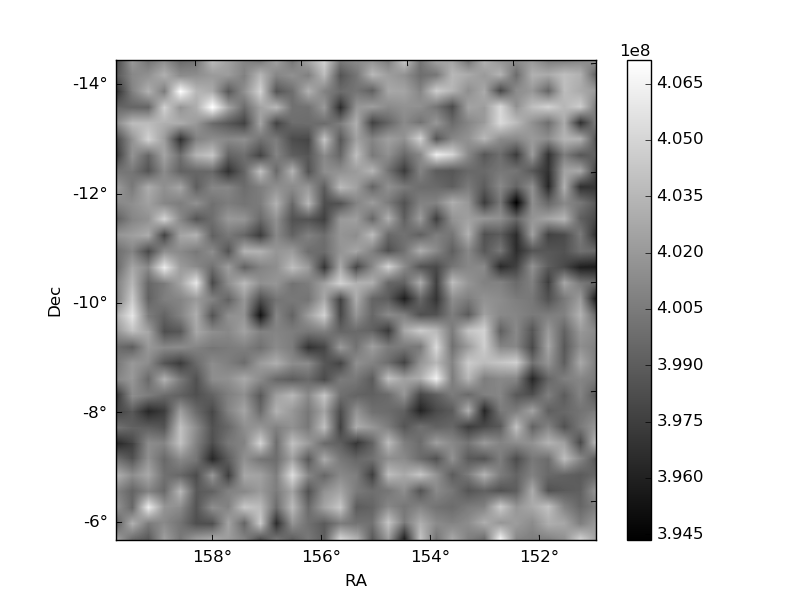
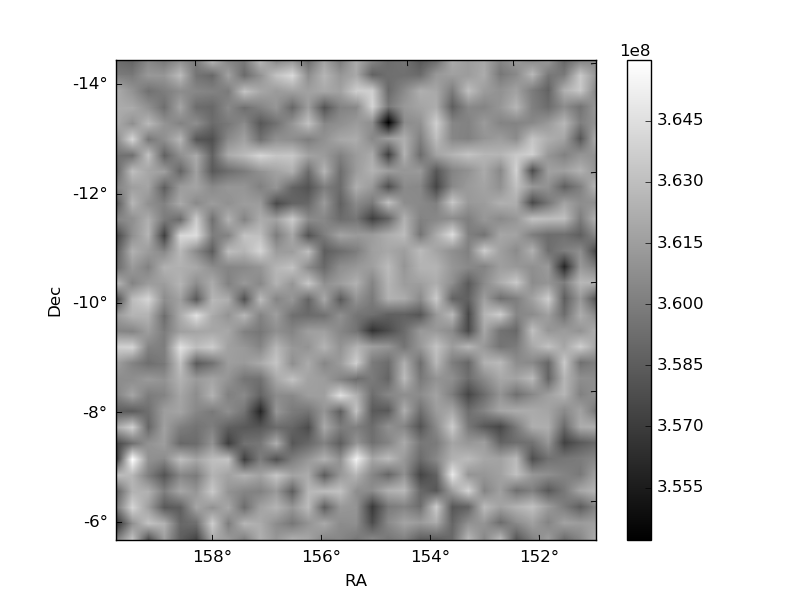
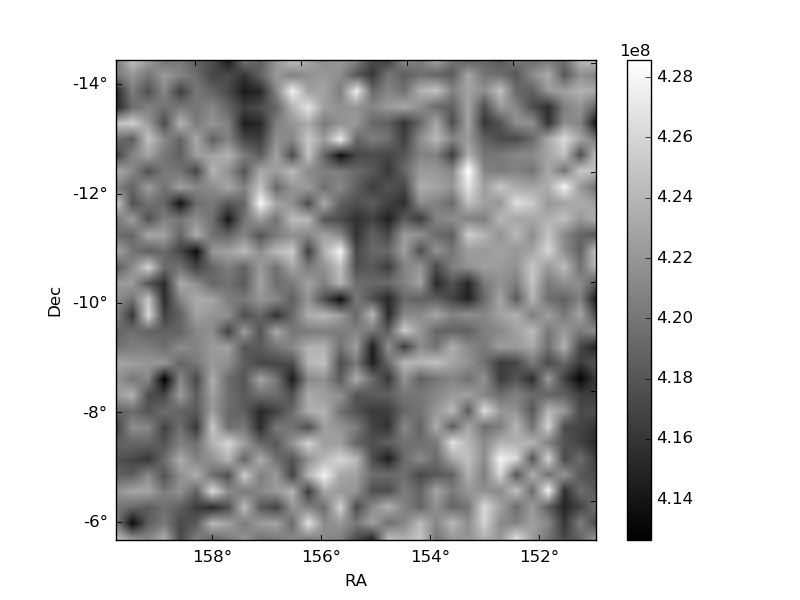
Histogram calculated using DETX and DETY for each event in the final _common_clean file
| Quadrant A | 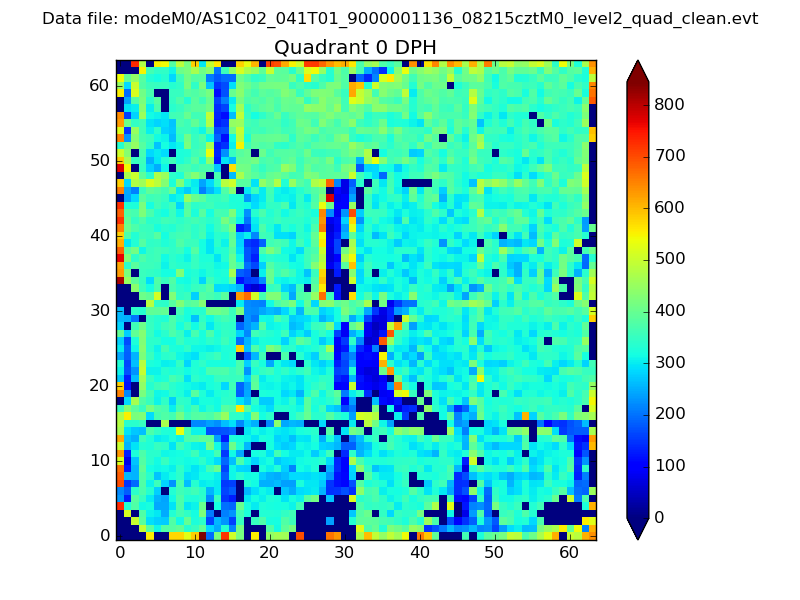 |
 |
Quadrant B |
|---|---|---|---|
| Quadrant D | 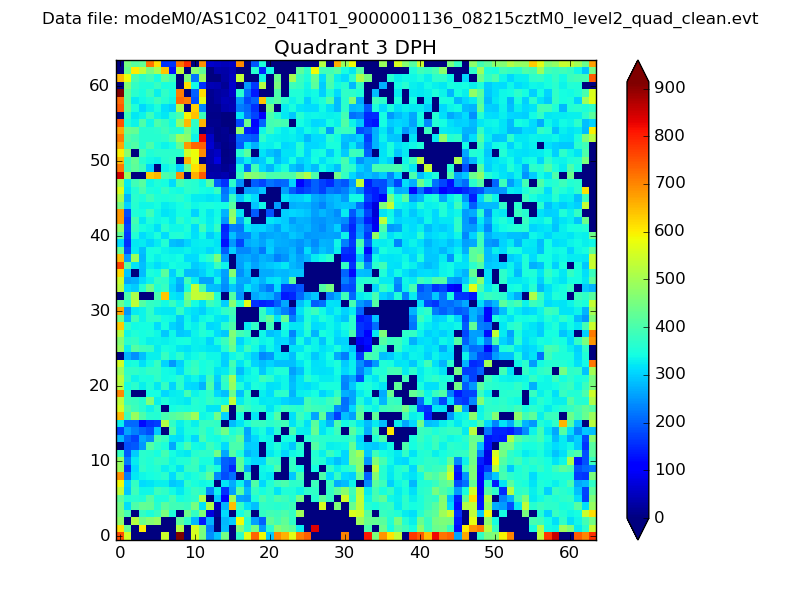 |
 |
Quadrant C |
| Plot type | Count rate plots | Images |
|---|---|---|
| Comparison with Poisson distribution Blue bars denote a histogram of data divided into 1 sec bins. Red curve is a Poisson curve with rate = median count rate of data. |
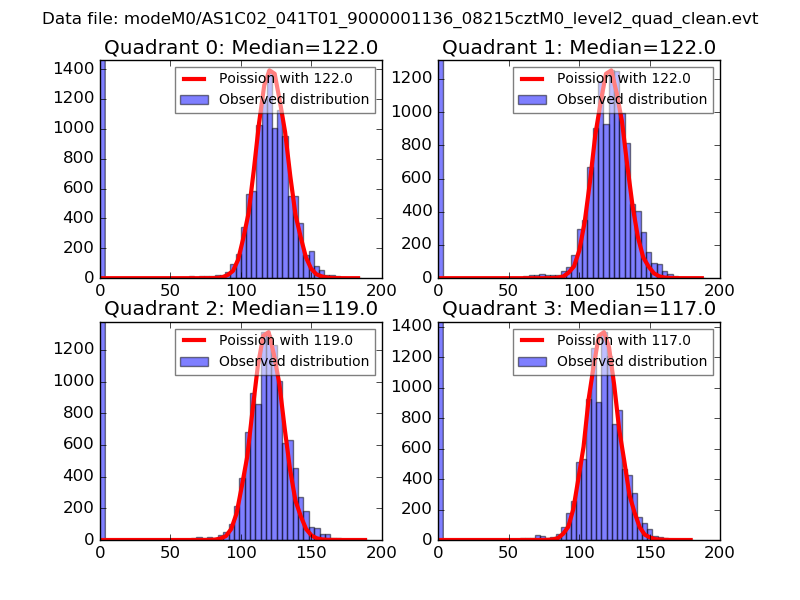 |
 |
| Quadrant-wise count rates Data is divided into 100 sec bins |
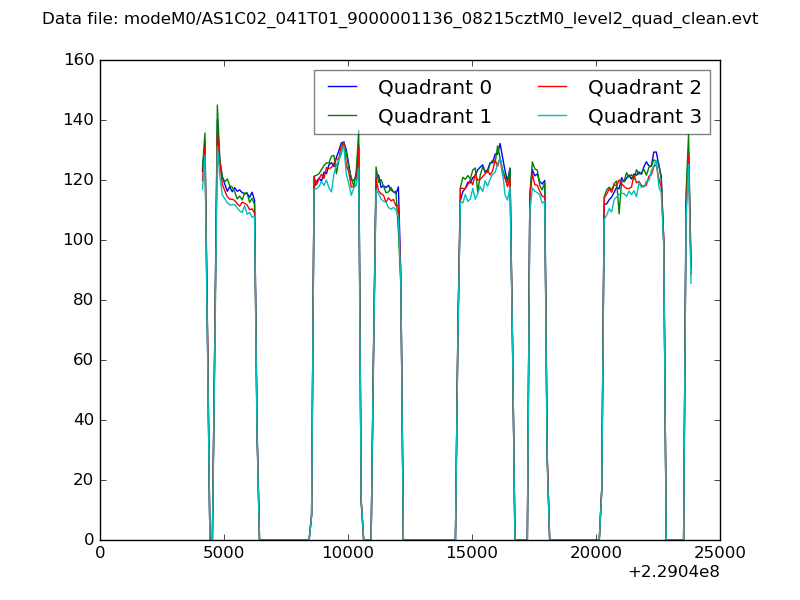 |
|
| Module-wise count rates for Quadrant A Data is divided into 100 sec bins |
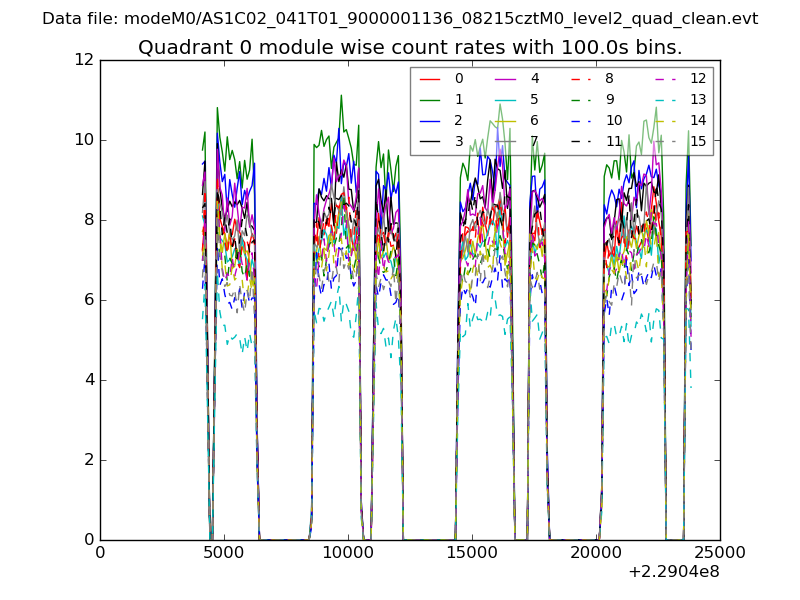 |
 |
| Module-wise count rates for Quadrant B Data is divided into 100 sec bins |
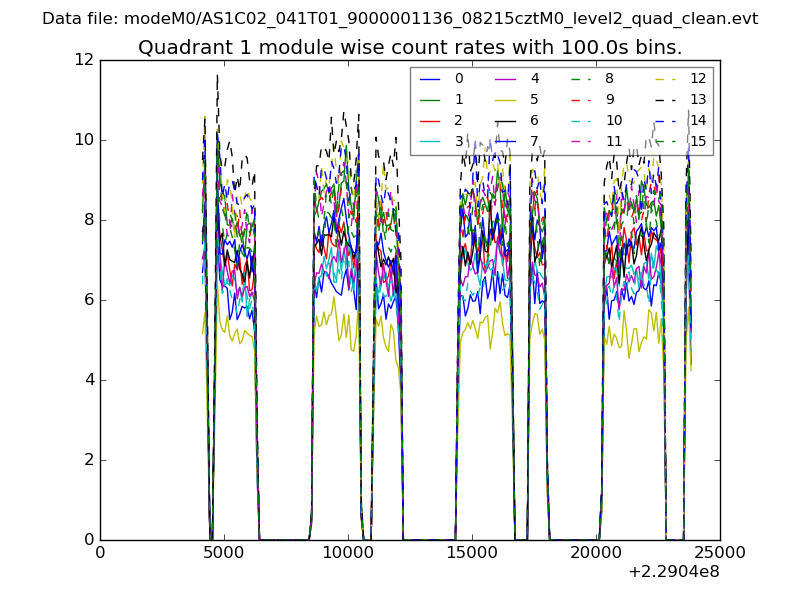 |
 |
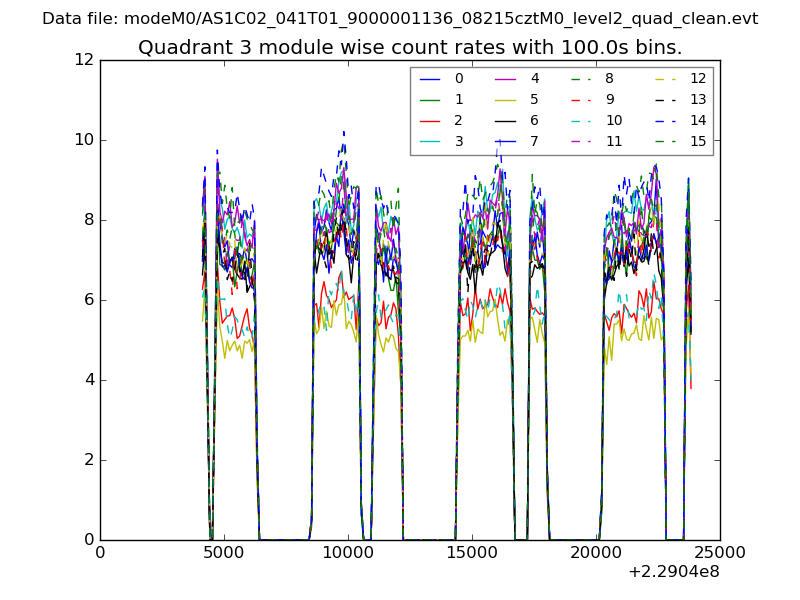
| Module-wise count rates for Quadrant C Data is divided into 100 sec bins |
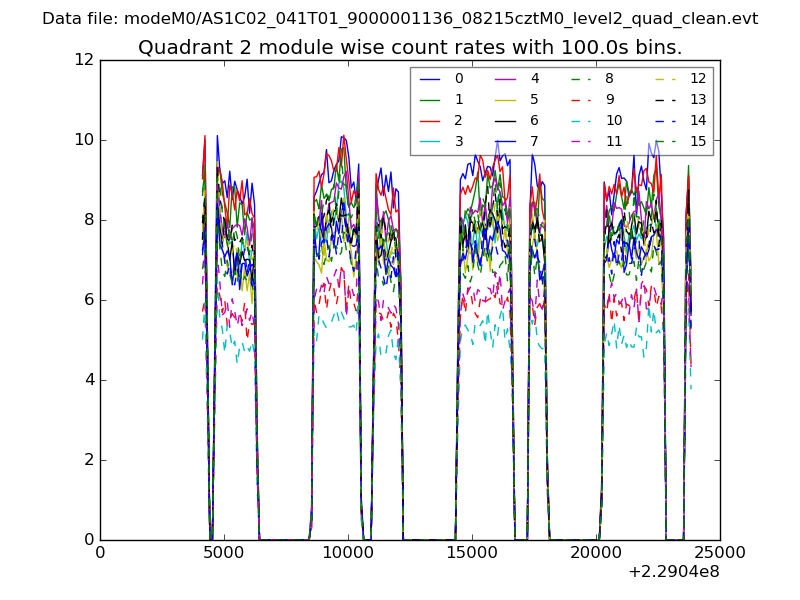 |
 |
| Module-wise count rates for Quadrant D Data is divided into 100 sec bins |
 |
 |
| Parameter | Plot |
|---|---|
| CZT HV Monitor | 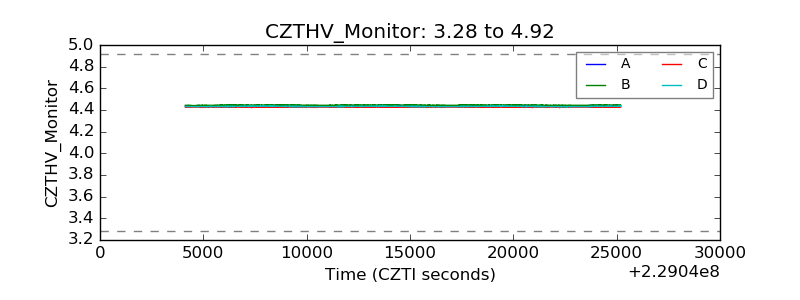 |
| D_VDD | 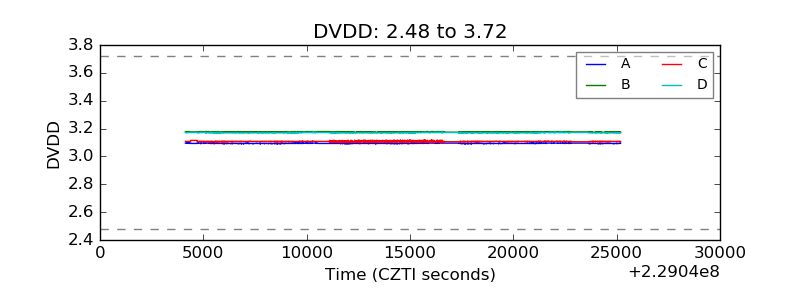 |
| Temperature 1 | 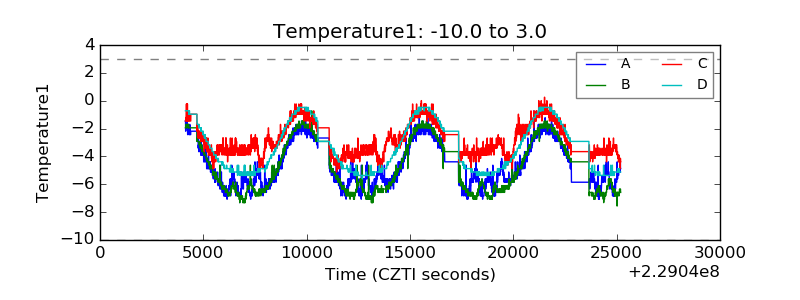 |
| Veto HV Monitor | 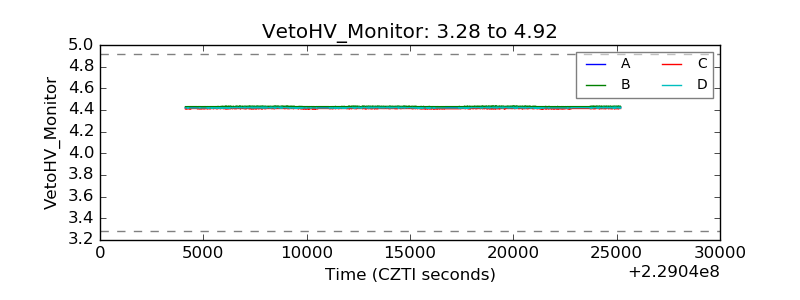 |
| Veto LLD | 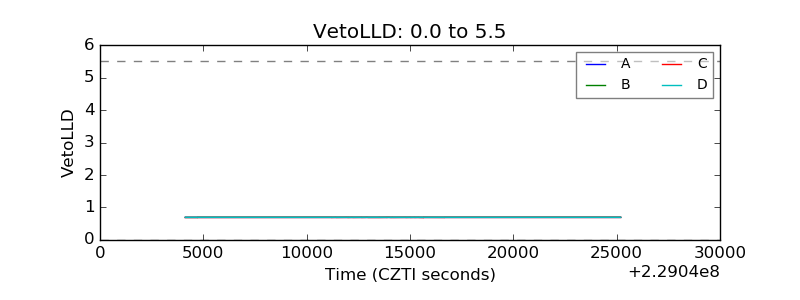 |
| Alpha Counter |  |
| _CPM_Rate | 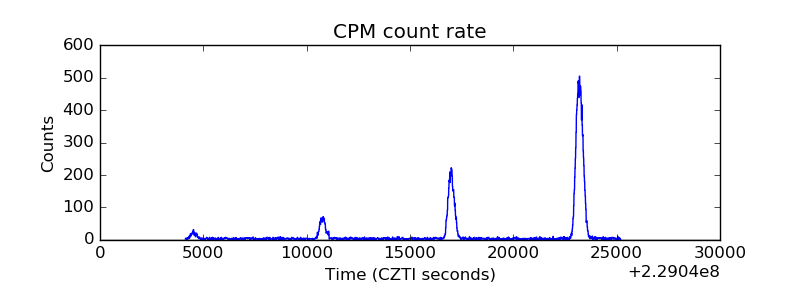 |
| CZT Counter | 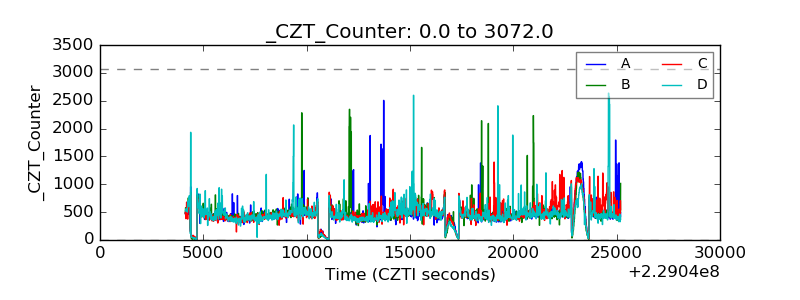 |
| +2.5 Volts monitor |  |
| +5 Volts monitor |  |
| _ROLL_ROT | 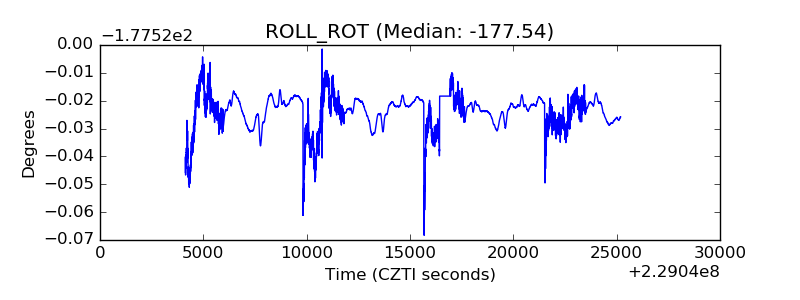 |
| _Roll_DEC | 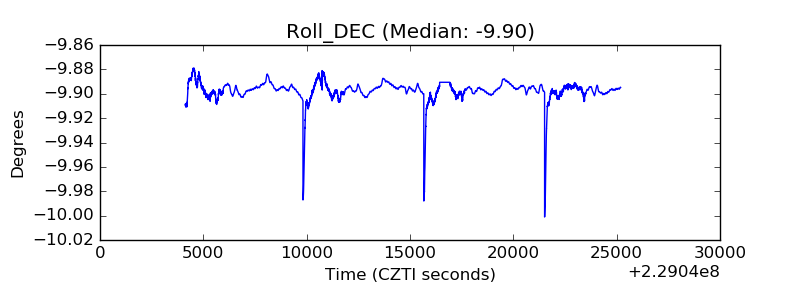 |
| _Roll_RA | 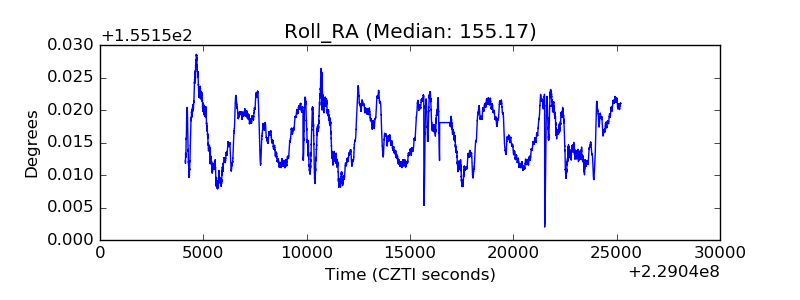 |
| Veto Counter | 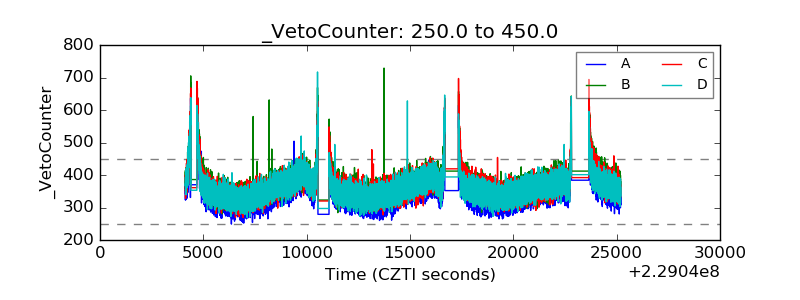 |