| Param | Original file | Final file |
|---|---|---|
| Filename | modeM0/AS1C02_041T01_9000001136_08216cztM0_level2.evt | modeM0/AS1C02_041T01_9000001136_08216cztM0_level2_quad_clean.evt |
| Size (bytes) | 471,565,440 | 67,305,600 |
| Size | 449.7 MB | 64.2 MB |
| Events in quadrant A | 3,415,174 | 391,287 |
| Events in quadrant B | 3,373,151 | 395,493 |
| Events in quadrant C | 3,579,832 | 389,130 |
| Events in quadrant D | 3,440,919 | 377,579 |
| Mode M9 | |||
|---|---|---|---|
| Quadrant | BADHDUFLAG | Total packets | Discarded packets |
| A | 0 | 18 | 0 |
| B | 0 | 18 | 0 |
| C | 0 | 18 | 0 |
| D | 0 | 18 | 0 |
| Mode SS | |||
|---|---|---|---|
| Quadrant | BADHDUFLAG | Total packets | Discarded packets |
| A | 0 | 144 | 0 |
| B | 0 | 144 | 0 |
| C | 0 | 144 | 0 |
| D | 0 | 144 | 0 |
| Mode M0 | |||
|---|---|---|---|
| Quadrant | BADHDUFLAG | Total packets | Discarded packets |
| A | 0 | 14875 | 3 |
| B | 0 | 14506 | 2 |
| C | 0 | 15438 | 2 |
| D | 0 | 15106 | 2 |
| Quadrant | Total seconds | Saturated seconds | Saturation percentage |
|---|---|---|---|
| A | 6949 | 97 | 1.395884% |
| B | 6949 | 53 | 0.762700% |
| C | 6949 | 36 | 0.518060% |
| D | 6949 | 92 | 1.323932% |
Noise dominated data is calculated using 1-second bins in cleaned event files. If a bin has >2000 counts, and if more than 50% of those come from <1% of pixels, then it is considered to be noise-dominated and hence unusable.
| Quadrant | # 1 sec bins | Bins with >0 counts | Bins with >2000 counts | High rate bins dominated by noise | Noise dominated (total time) | Noise dominated (detector-on time) | Marked lightcurve |
|---|---|---|---|---|---|---|---|
| A | 8779 | 6951 | 37 | 37 | 0.42% | 0.53% | 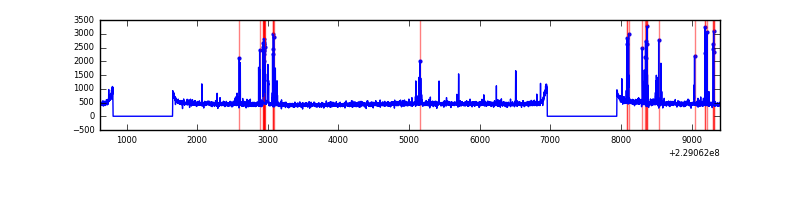 |
| B | 8779 | 6951 | 1 | 1 | 0.01% | 0.01% | 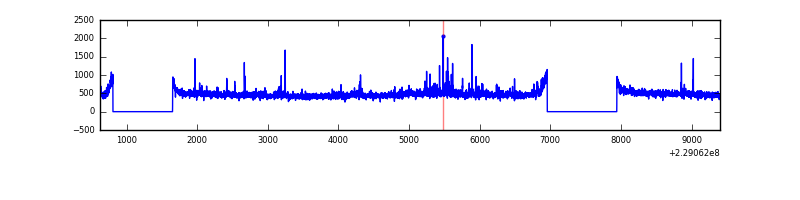 |
| C | 8779 | 6951 | 0 | 0 | 0.00% | 0.00% | 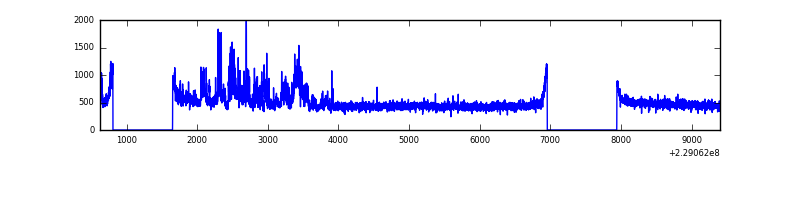 |
| D | 8779 | 6951 | 60 | 60 | 0.68% | 0.86% | 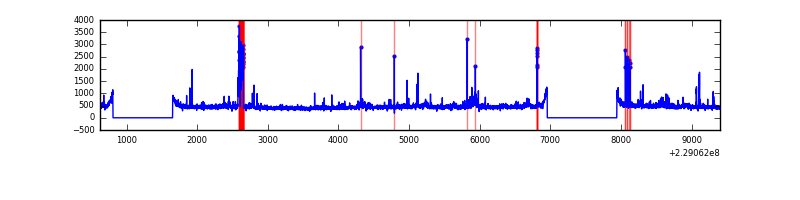 |
Top three noisy pixels from each quadrant. If the there are fewer than three noisy pixels in the level2.evt file, extra rows are filled as -1
| Pixel properties | Quadrant properties | ||||||
|---|---|---|---|---|---|---|---|
| Quadrant | DetID | PixID | Counts | Sigma | Mean | Median | Sigma |
| A | 5 | 16 | 219205 | 1285.52 | 823 | 806 | 169.9 |
| A | 15 | 79 | 16183 | 90.51 | 823 | 806 | 169.9 |
| A | 8 | 15 | 9483 | 51.07 | 823 | 806 | 169.9 |
| B | 0 | 214 | 70374 | 434.67 | 831 | 812 | 160.0 |
| B | 4 | 81 | 38267 | 234.05 | 831 | 812 | 160.0 |
| B | 0 | 213 | 19746 | 118.31 | 831 | 812 | 160.0 |
| C | 9 | 68 | 466694 | 2496.83 | 797 | 800 | 186.6 |
| C | 13 | 61 | 6012 | 27.93 | 797 | 800 | 186.6 |
| C | 14 | 67 | 4305 | 18.78 | 797 | 800 | 186.6 |
| D | 1 | 52 | 217809 | 1045.42 | 792 | 771 | 207.6 |
| D | 13 | 122 | 60236 | 286.43 | 792 | 771 | 207.6 |
| D | 2 | 14 | 40811 | 192.86 | 792 | 771 | 207.6 |
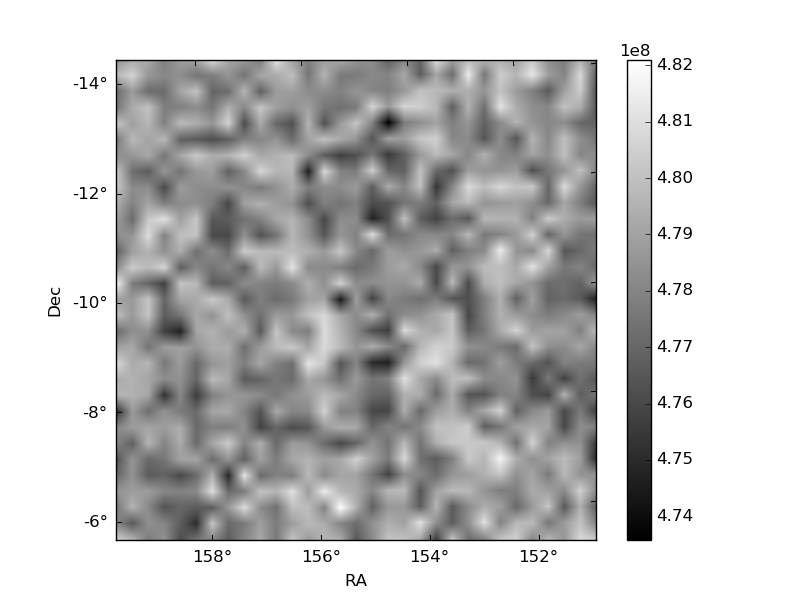
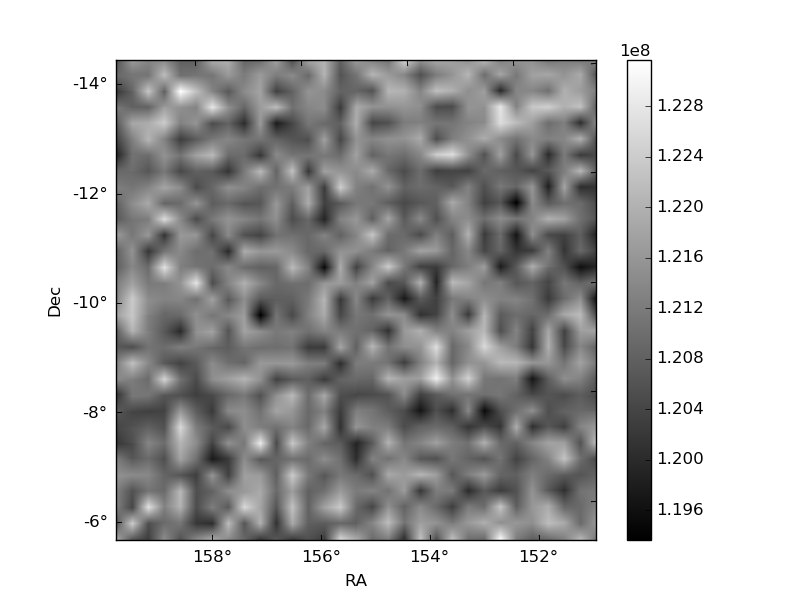
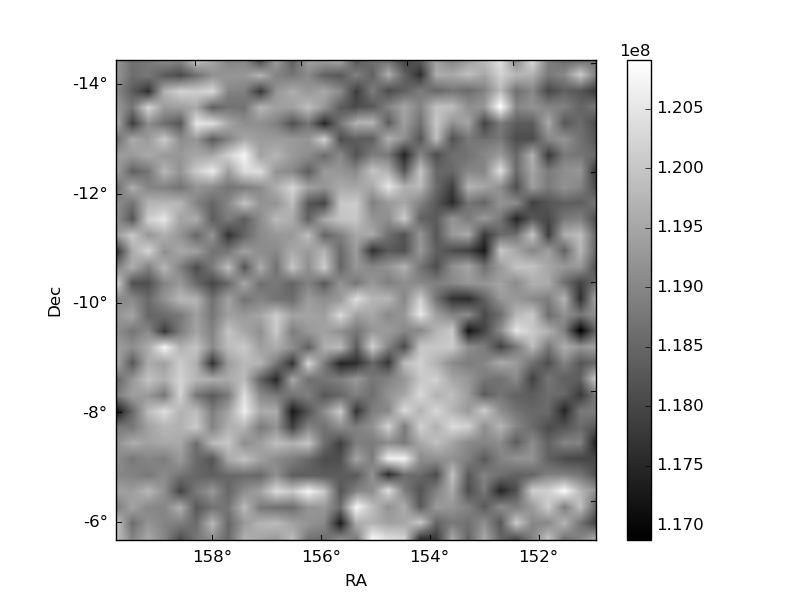
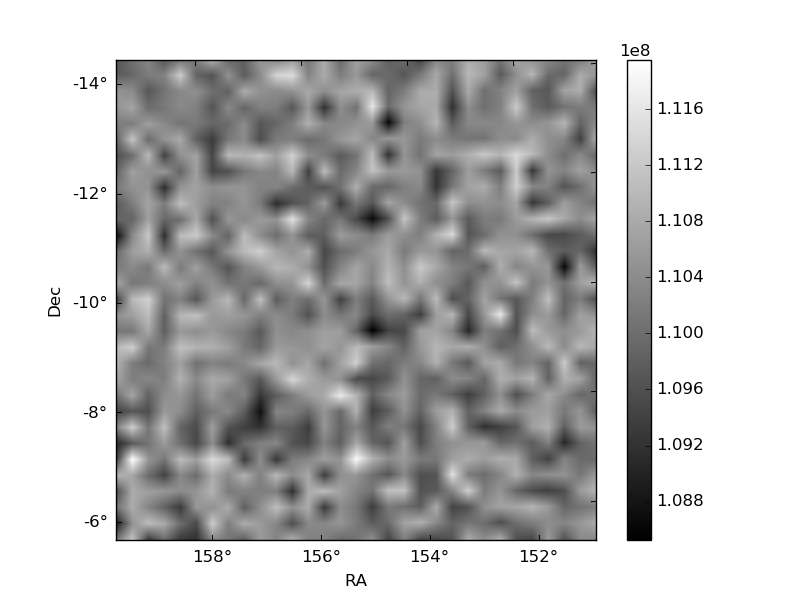
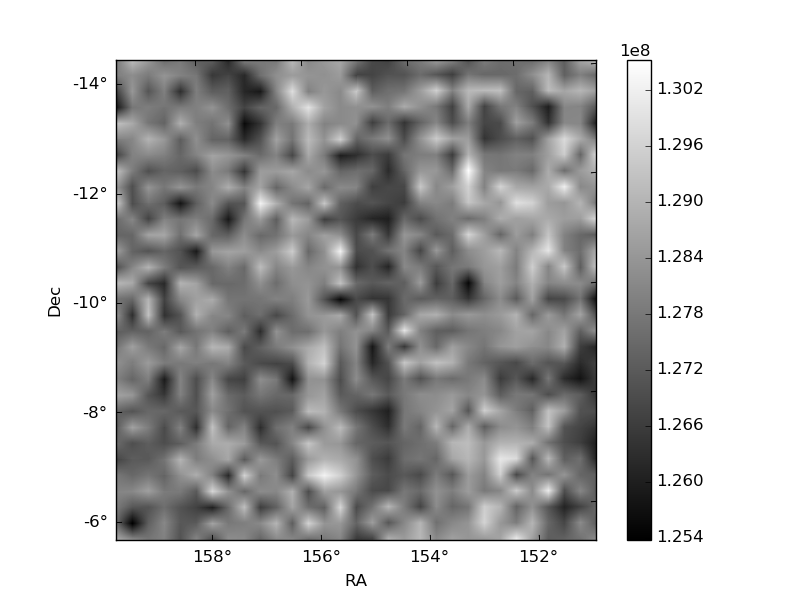
Histogram calculated using DETX and DETY for each event in the final _common_clean file
| Quadrant A | 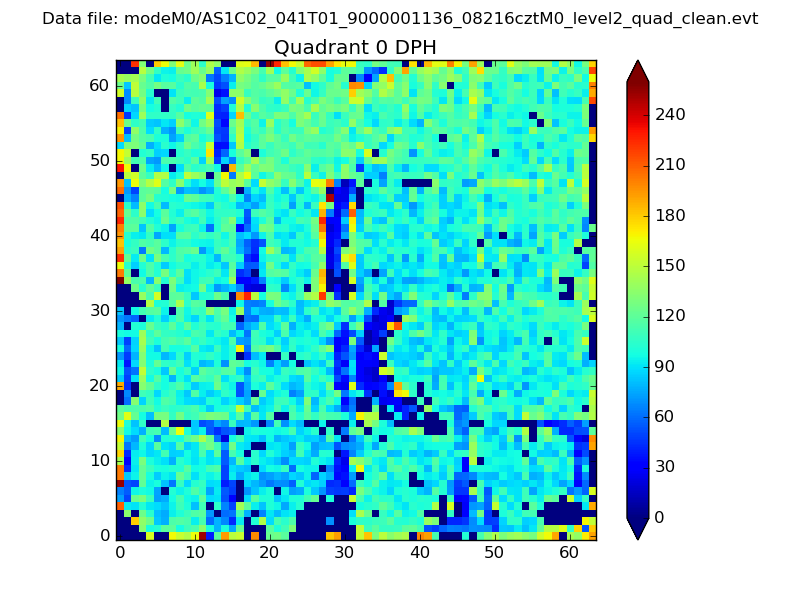 |
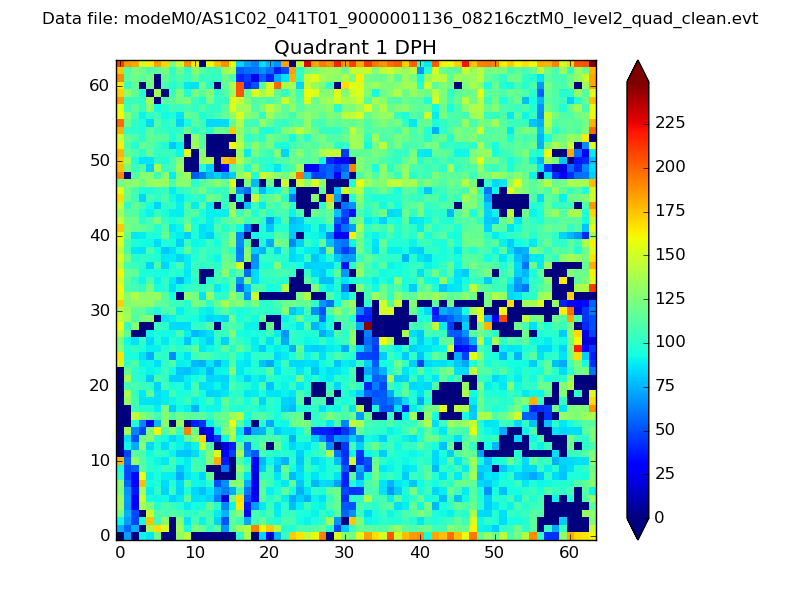 |
Quadrant B |
|---|---|---|---|
| Quadrant D | 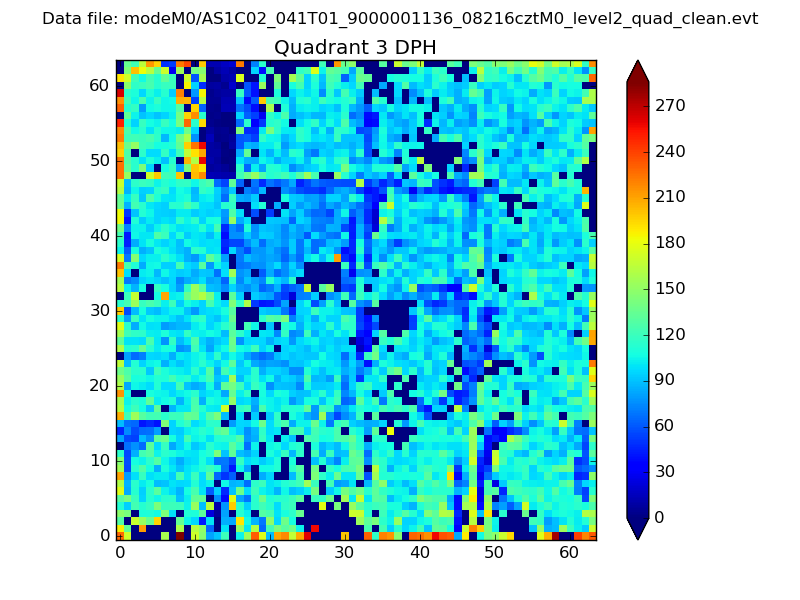 |
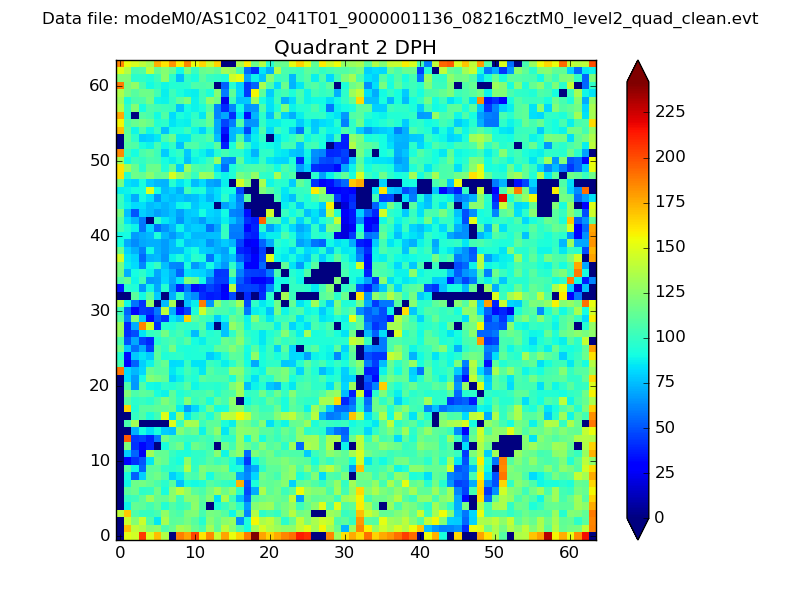 |
Quadrant C |
| Plot type | Count rate plots | Images |
|---|---|---|
| Comparison with Poisson distribution Blue bars denote a histogram of data divided into 1 sec bins. Red curve is a Poisson curve with rate = median count rate of data. |
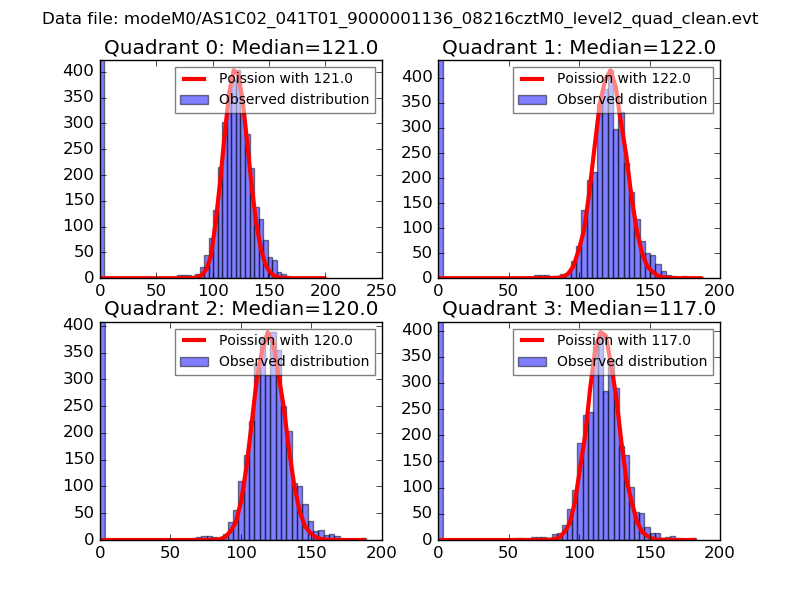 |
 |
| Quadrant-wise count rates Data is divided into 100 sec bins |
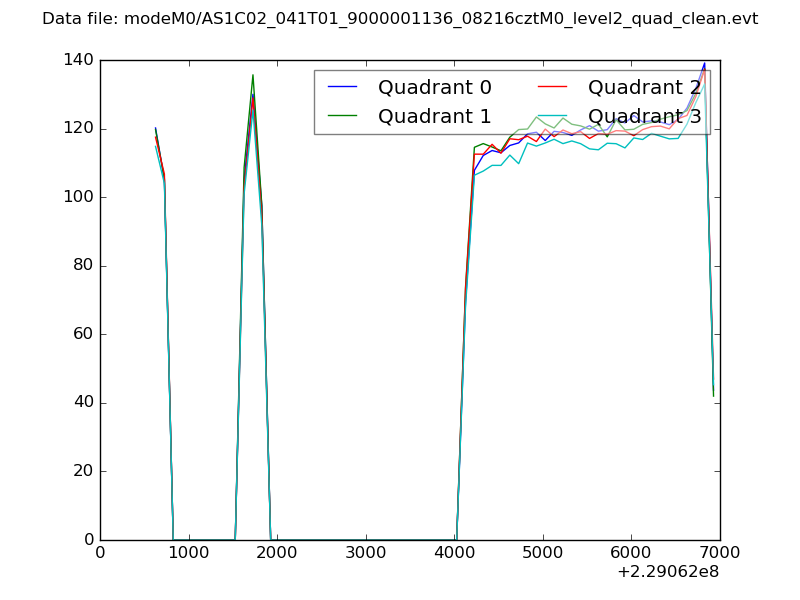 |
|
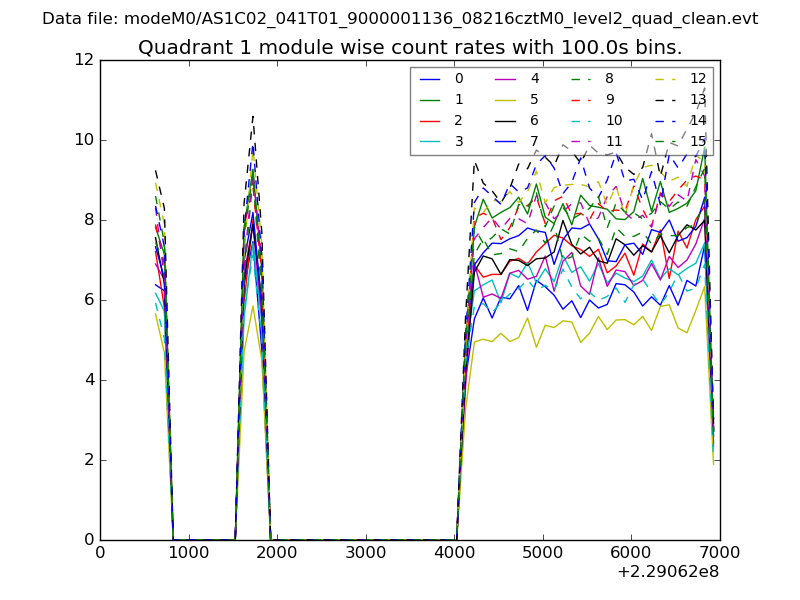
| Module-wise count rates for Quadrant A Data is divided into 100 sec bins |
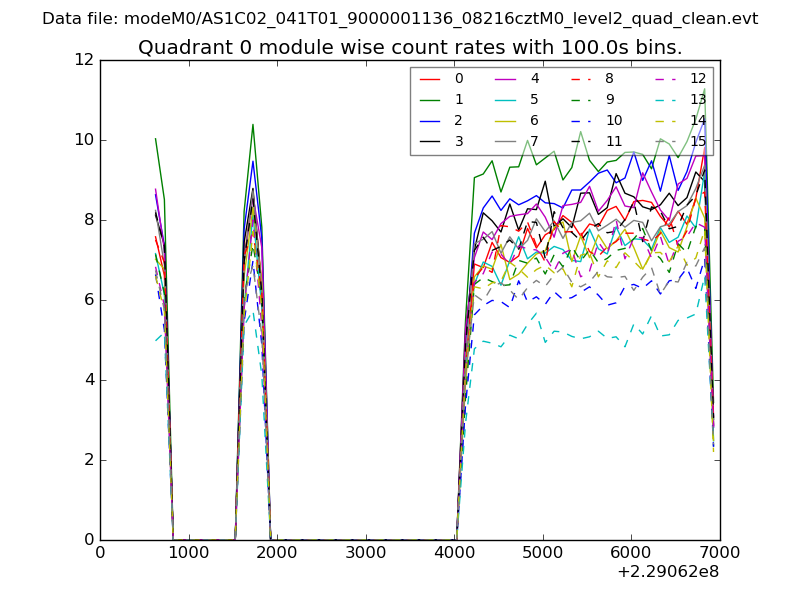 |
 |
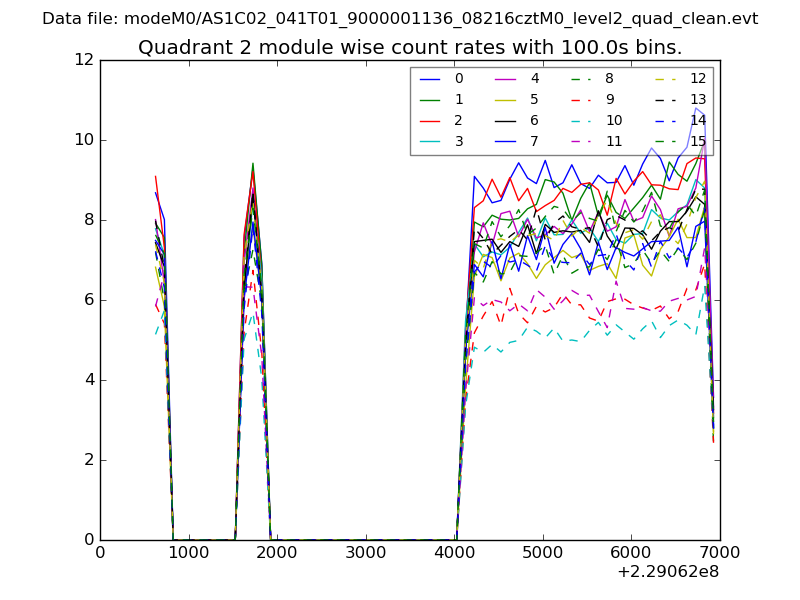
| Module-wise count rates for Quadrant B Data is divided into 100 sec bins |
 |
 |
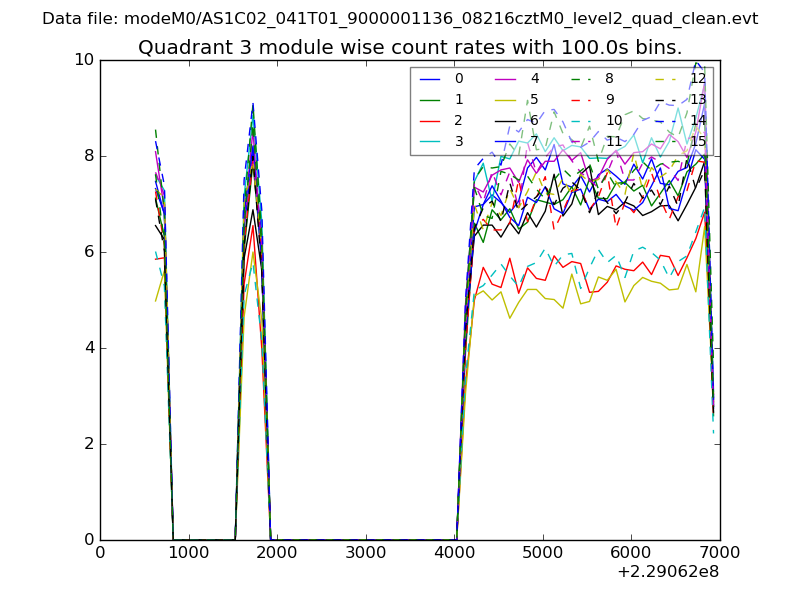
| Module-wise count rates for Quadrant C Data is divided into 100 sec bins |
 |
 |
| Module-wise count rates for Quadrant D Data is divided into 100 sec bins |
 |
 |
| Parameter | Plot |
|---|---|
| CZT HV Monitor | 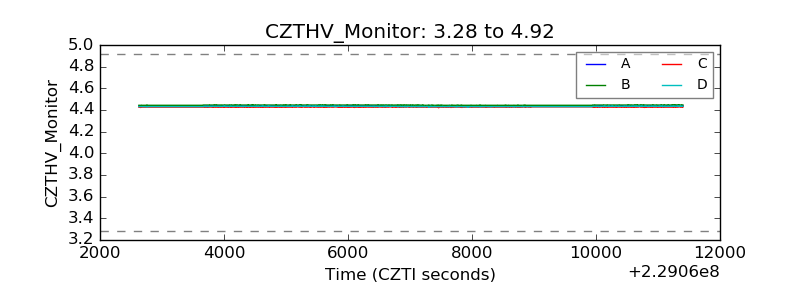 |
| D_VDD | 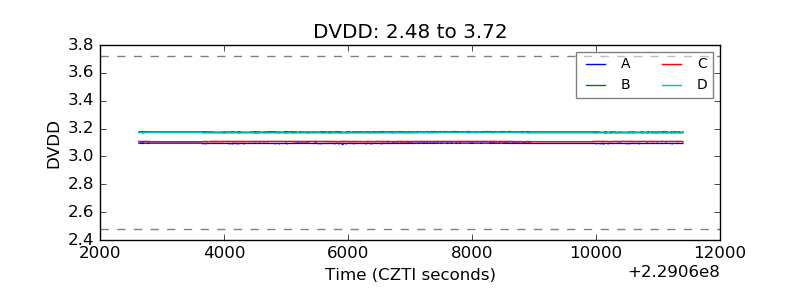 |
| Temperature 1 | 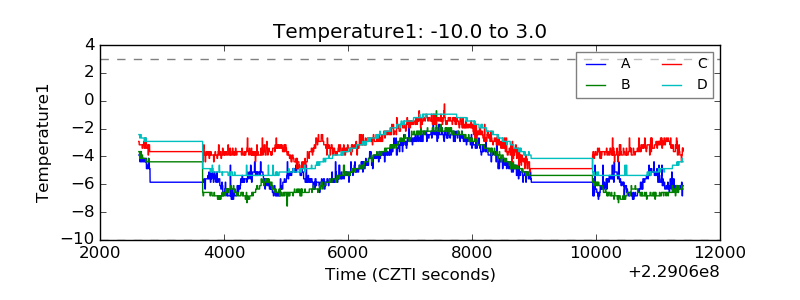 |
| Veto HV Monitor | 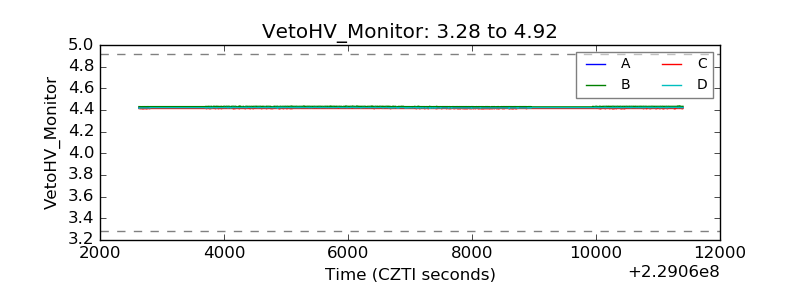 |
| Veto LLD |  |
| Alpha Counter | 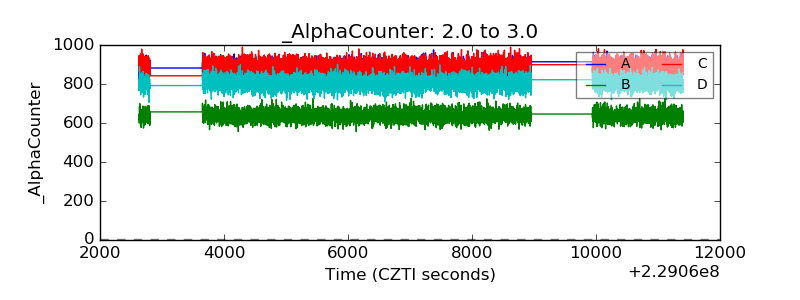 |
| _CPM_Rate | 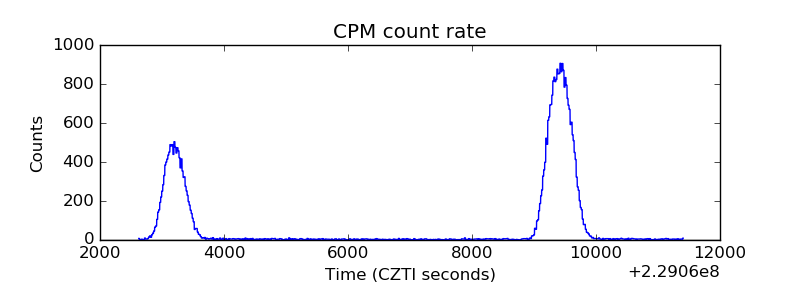 |
| CZT Counter | 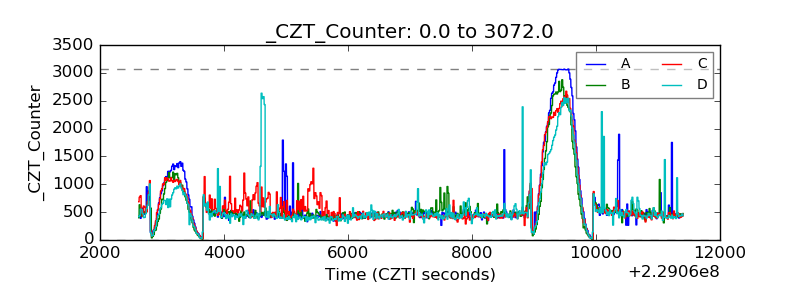 |
| +2.5 Volts monitor | 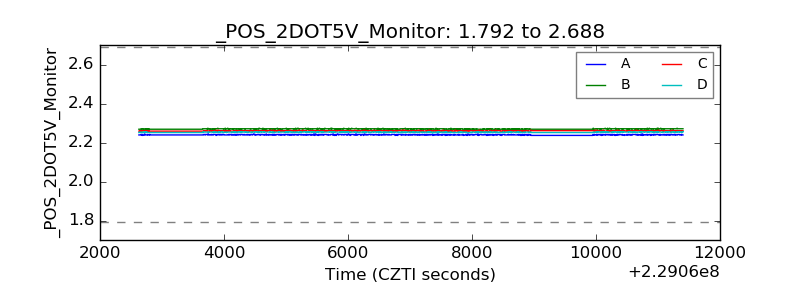 |
| +5 Volts monitor |  |
| _ROLL_ROT | 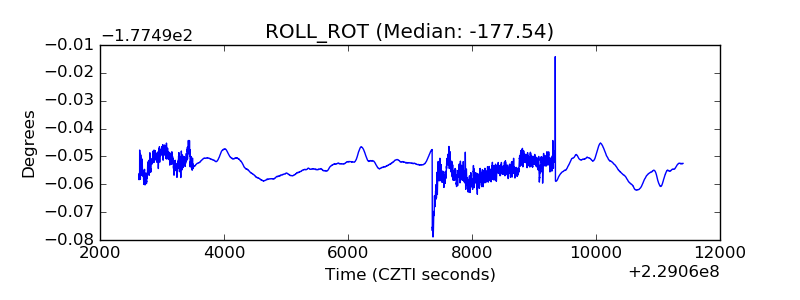 |
| _Roll_DEC | 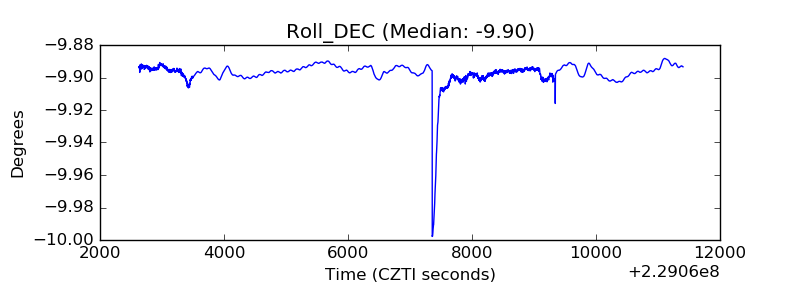 |
| _Roll_RA | 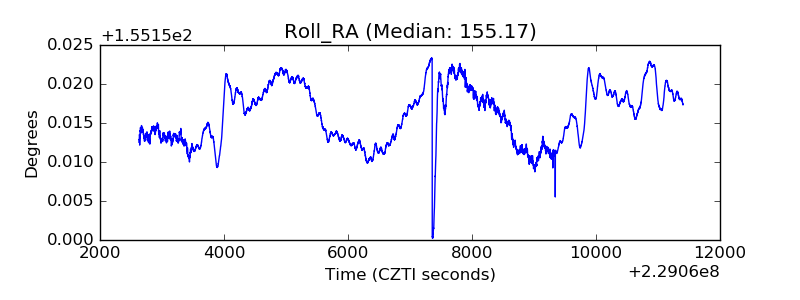 |
| Veto Counter | 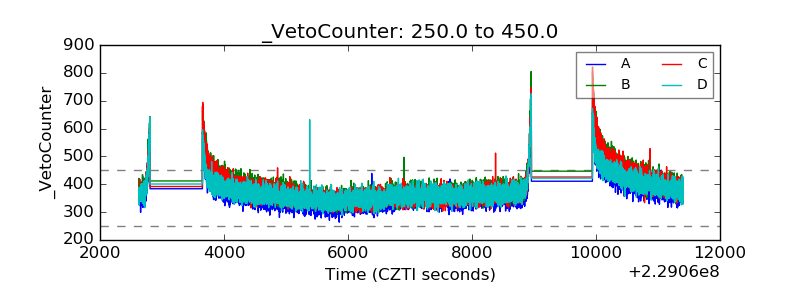 |