| Param | Original file | Final file |
|---|---|---|
| Filename | modeM0/AS1C02_041T01_9000001136_08218cztM0_level2.evt | modeM0/AS1C02_041T01_9000001136_08218cztM0_level2_quad_clean.evt |
| Size (bytes) | 427,728,960 | 64,474,560 |
| Size | 407.9 MB | 61.5 MB |
| Events in quadrant A | 3,197,190 | 378,489 |
| Events in quadrant B | 3,222,454 | 382,274 |
| Events in quadrant C | 3,018,717 | 376,365 |
| Events in quadrant D | 3,075,623 | 363,848 |
| Mode M9 | |||
|---|---|---|---|
| Quadrant | BADHDUFLAG | Total packets | Discarded packets |
| A | 0 | 12 | 0 |
| B | 0 | 12 | 0 |
| C | 0 | 12 | 0 |
| D | 0 | 13 | 0 |
| Mode SS | |||
|---|---|---|---|
| Quadrant | BADHDUFLAG | Total packets | Discarded packets |
| A | 0 | 132 | 0 |
| B | 0 | 132 | 0 |
| C | 0 | 132 | 0 |
| D | 0 | 132 | 0 |
| Mode M0 | |||
|---|---|---|---|
| Quadrant | BADHDUFLAG | Total packets | Discarded packets |
| A | 0 | 13767 | 3 |
| B | 0 | 13585 | 4 |
| C | 0 | 13365 | 4 |
| D | 0 | 13672 | 2 |
| Quadrant | Total seconds | Saturated seconds | Saturation percentage |
|---|---|---|---|
| A | 6463 | 120 | 1.856723% |
| B | 6462 | 95 | 1.470133% |
| C | 6462 | 74 | 1.145156% |
| D | 6463 | 99 | 1.531796% |
Noise dominated data is calculated using 1-second bins in cleaned event files. If a bin has >2000 counts, and if more than 50% of those come from <1% of pixels, then it is considered to be noise-dominated and hence unusable.
| Quadrant | # 1 sec bins | Bins with >0 counts | Bins with >2000 counts | High rate bins dominated by noise | Noise dominated (total time) | Noise dominated (detector-on time) | Marked lightcurve |
|---|---|---|---|---|---|---|---|
| A | 7513 | 6463 | 22 | 22 | 0.29% | 0.34% | 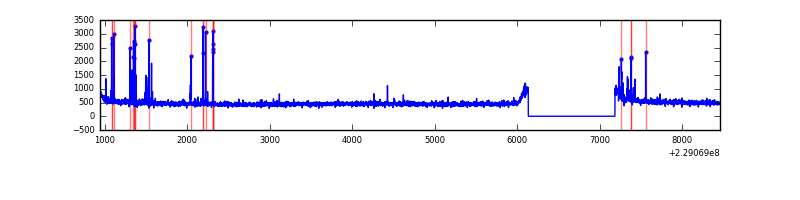 |
| B | 7513 | 6463 | 2 | 2 | 0.03% | 0.03% | 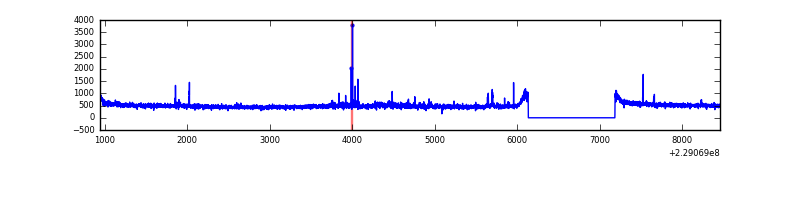 |
| C | 7513 | 6463 | 0 | 0 | 0.00% | 0.00% | 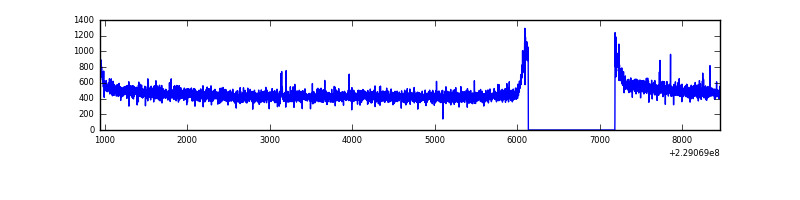 |
| D | 7513 | 6463 | 10 | 10 | 0.13% | 0.15% | 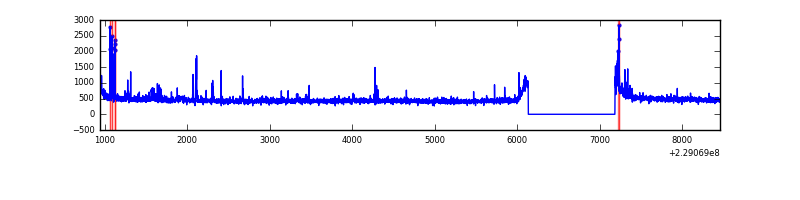 |
Top three noisy pixels from each quadrant. If the there are fewer than three noisy pixels in the level2.evt file, extra rows are filled as -1
| Pixel properties | Quadrant properties | ||||||
|---|---|---|---|---|---|---|---|
| Quadrant | DetID | PixID | Counts | Sigma | Mean | Median | Sigma |
| A | 5 | 16 | 133288 | 814.63 | 794 | 777 | 162.7 |
| A | 0 | 226 | 7318 | 40.21 | 794 | 777 | 162.7 |
| A | 12 | 194 | 7114 | 38.96 | 794 | 777 | 162.7 |
| B | 0 | 214 | 76788 | 497.29 | 801 | 780 | 152.8 |
| B | 12 | 111 | 16297 | 101.52 | 801 | 780 | 152.8 |
| B | 0 | 197 | 13358 | 82.29 | 801 | 780 | 152.8 |
| C | 9 | 68 | 6471 | 31.53 | 770 | 773 | 180.7 |
| C | 13 | 61 | 5980 | 28.81 | 770 | 773 | 180.7 |
| C | 8 | 128 | 5260 | 24.83 | 770 | 773 | 180.7 |
| D | 13 | 122 | 61453 | 320.58 | 768 | 745 | 189.4 |
| D | 12 | 233 | 41993 | 217.81 | 768 | 745 | 189.4 |
| D | 1 | 52 | 34403 | 177.73 | 768 | 745 | 189.4 |
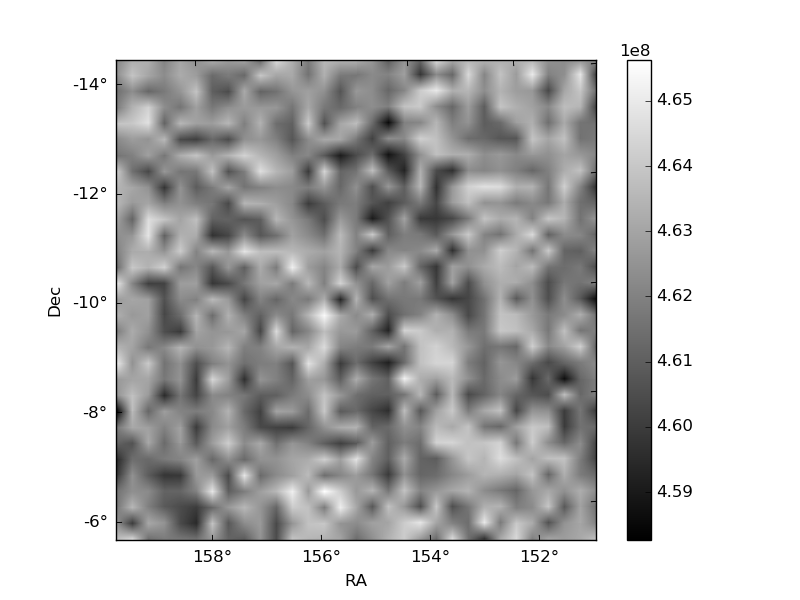
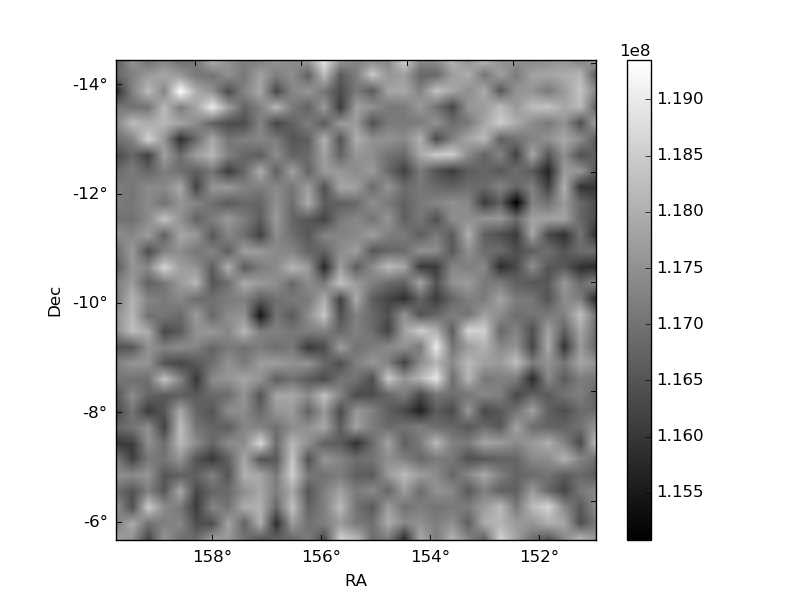
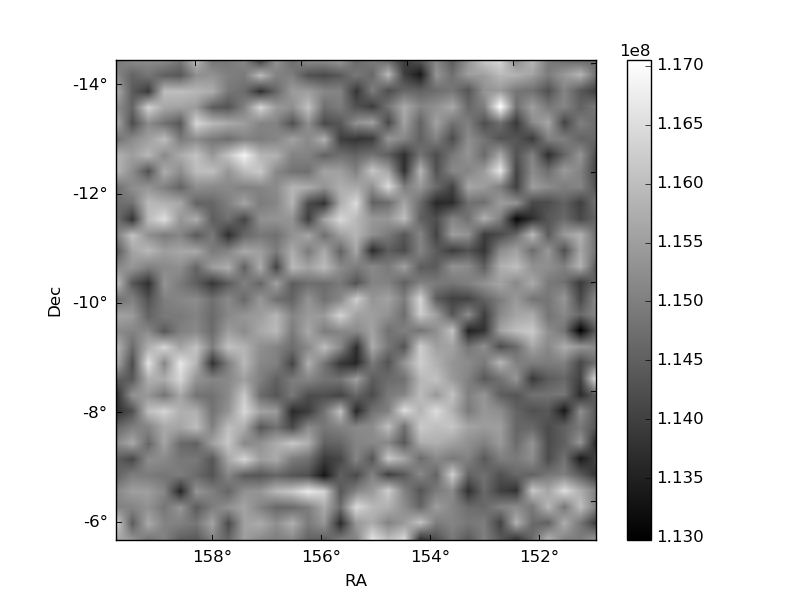
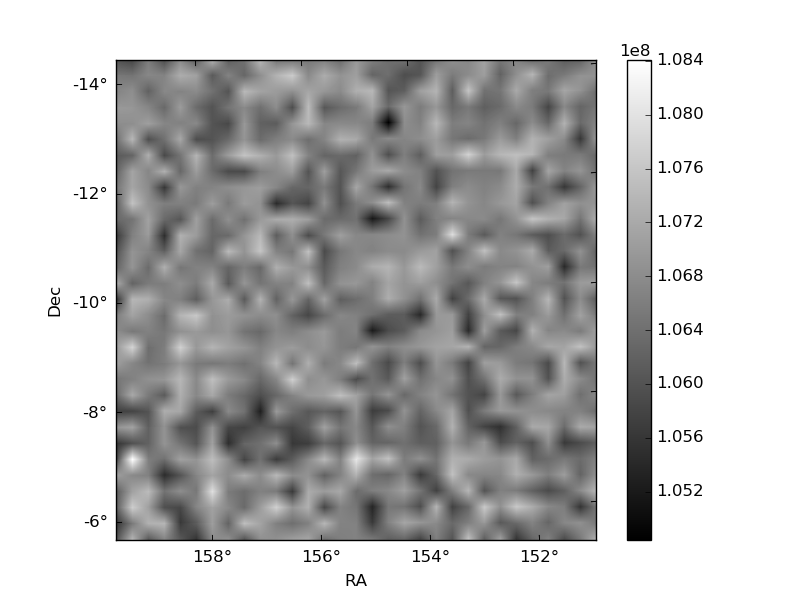
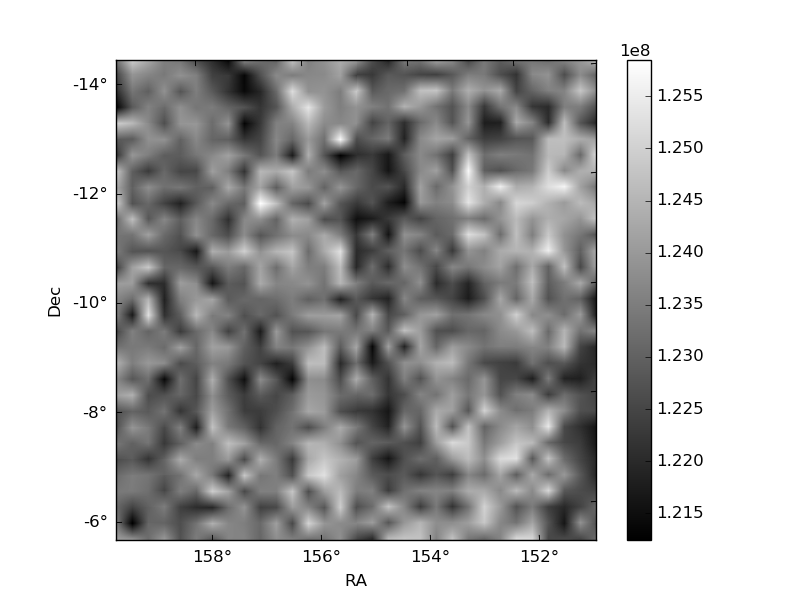
Histogram calculated using DETX and DETY for each event in the final _common_clean file
| Quadrant A | 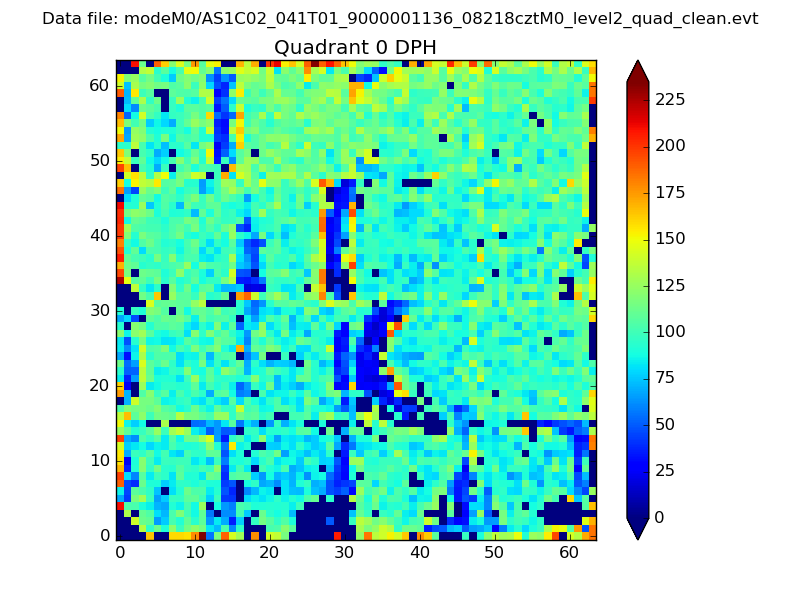 |
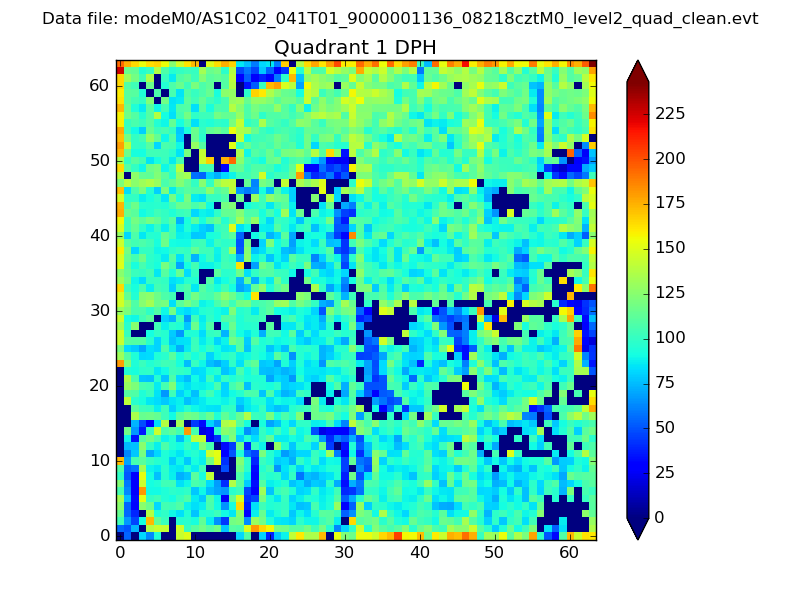 |
Quadrant B |
|---|---|---|---|
| Quadrant D | 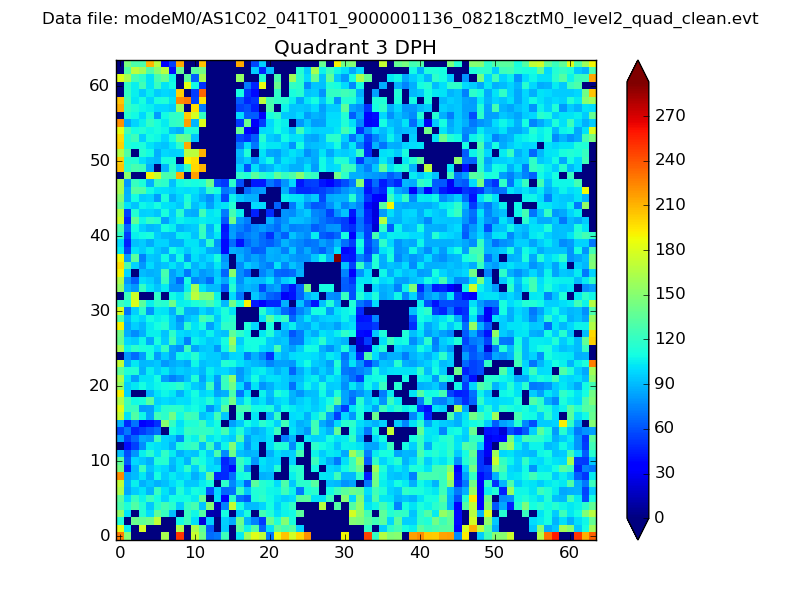 |
 |
Quadrant C |
| Plot type | Count rate plots | Images |
|---|---|---|
| Comparison with Poisson distribution Blue bars denote a histogram of data divided into 1 sec bins. Red curve is a Poisson curve with rate = median count rate of data. |
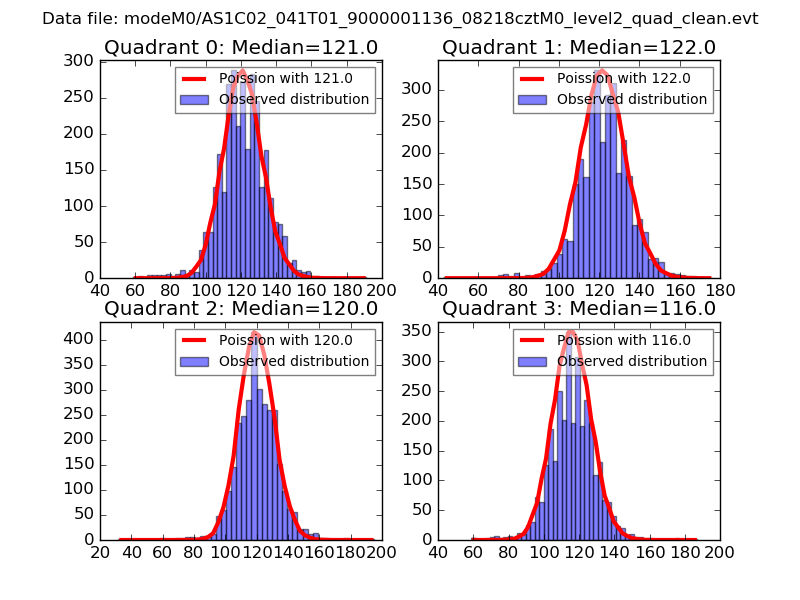 |
 |
| Quadrant-wise count rates Data is divided into 100 sec bins |
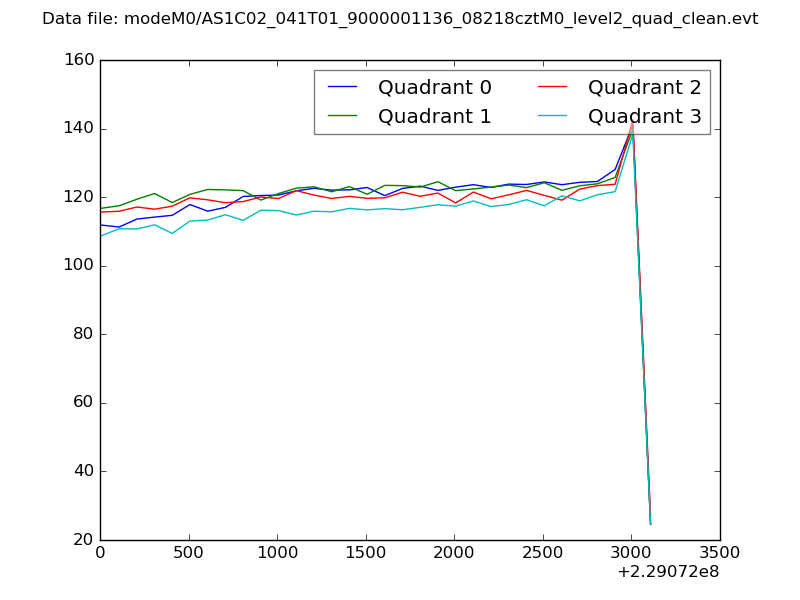 |
|
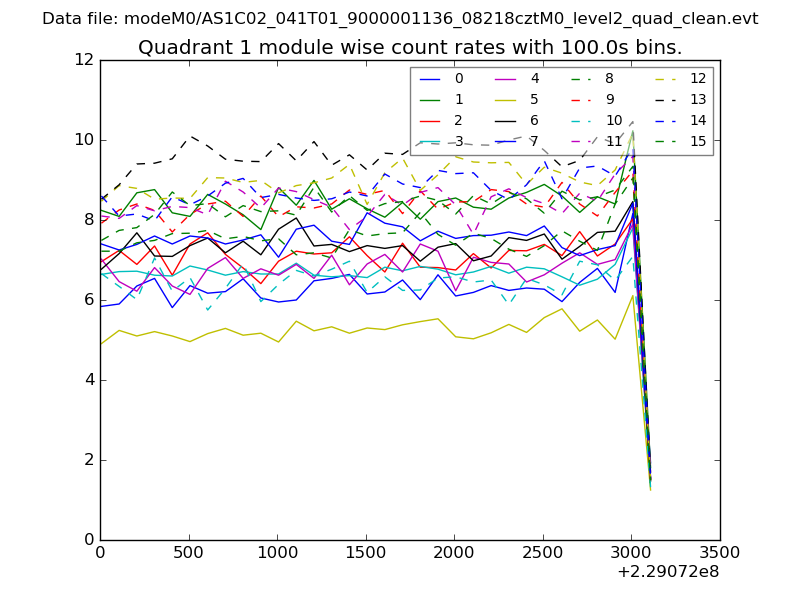
| Module-wise count rates for Quadrant A Data is divided into 100 sec bins |
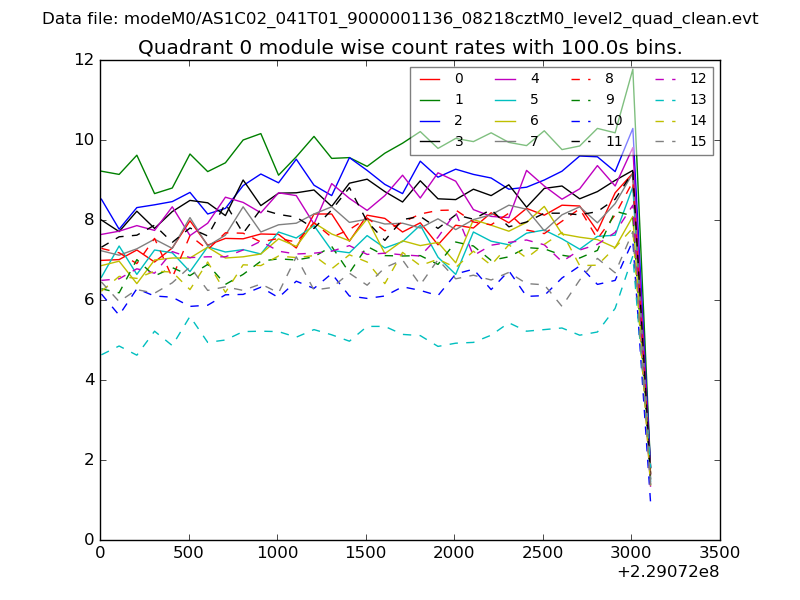 |
 |
| Module-wise count rates for Quadrant B Data is divided into 100 sec bins |
 |
 |
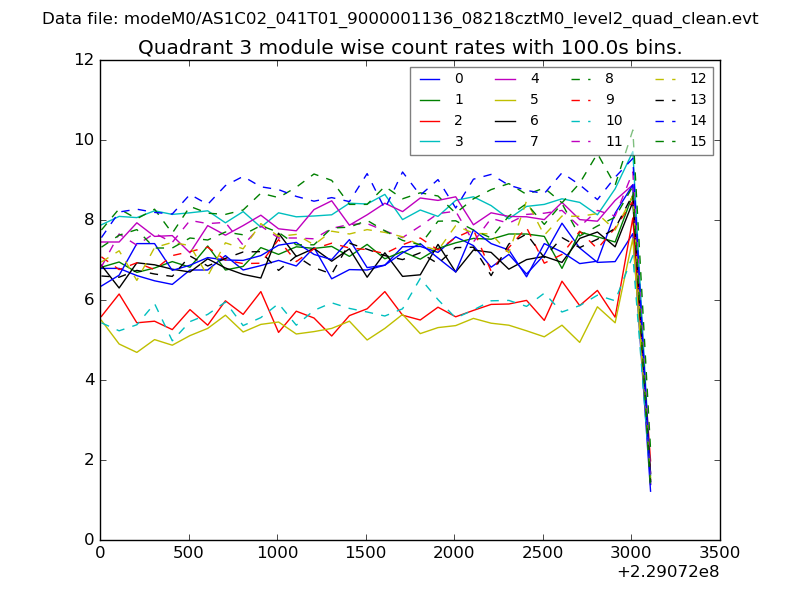
| Module-wise count rates for Quadrant C Data is divided into 100 sec bins |
 |
 |
| Module-wise count rates for Quadrant D Data is divided into 100 sec bins |
 |
 |
| Parameter | Plot |
|---|---|
| CZT HV Monitor | 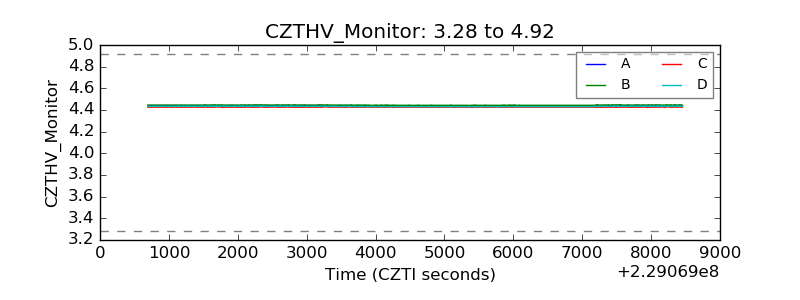 |
| D_VDD | 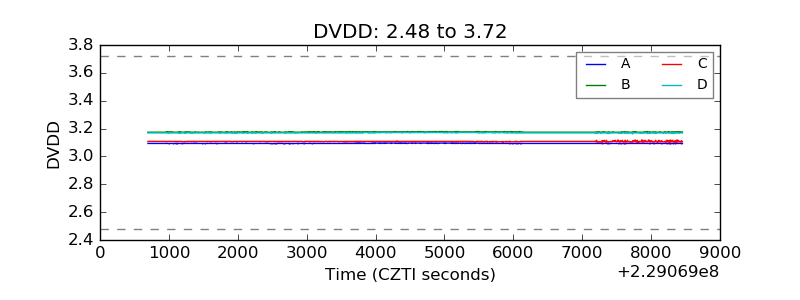 |
| Temperature 1 | 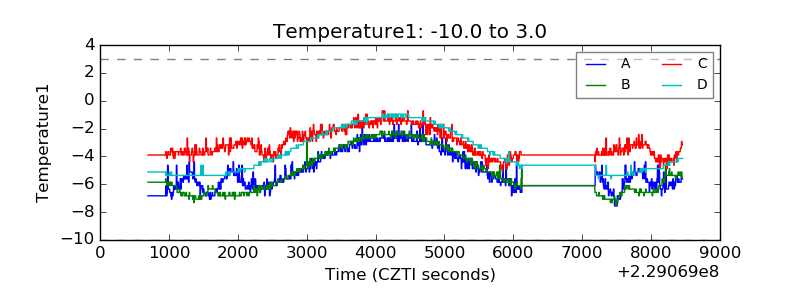 |
| Veto HV Monitor | 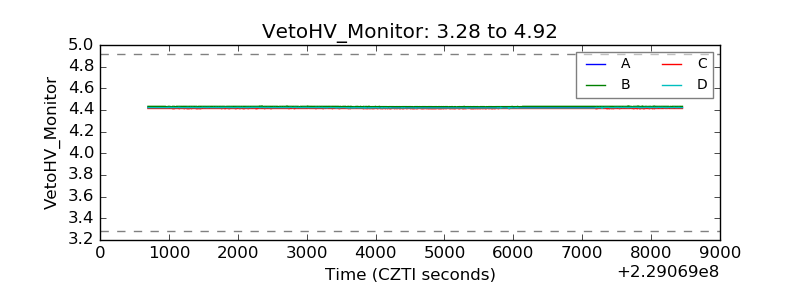 |
| Veto LLD | 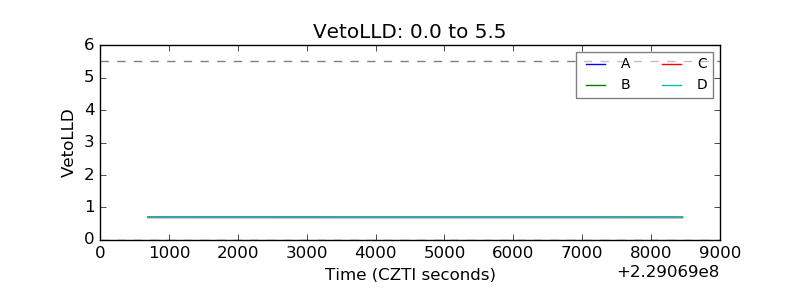 |
| Alpha Counter | 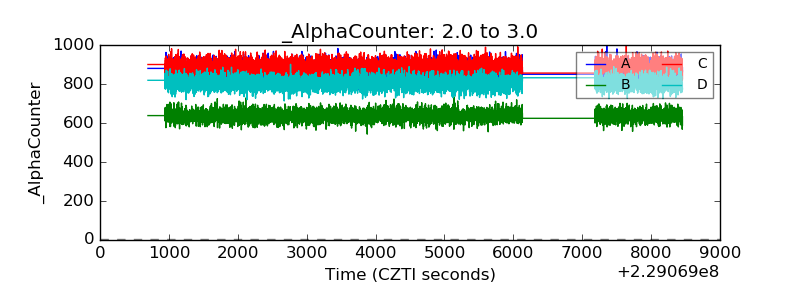 |
| _CPM_Rate | 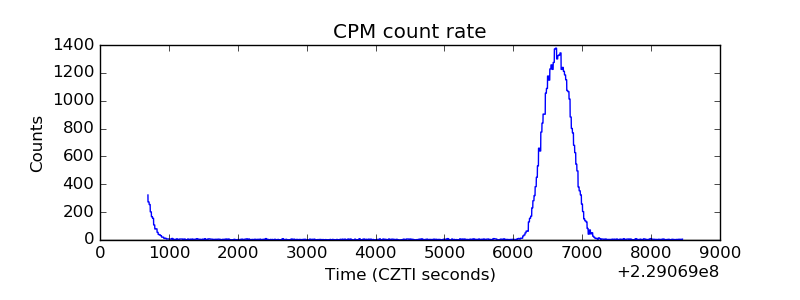 |
| CZT Counter | 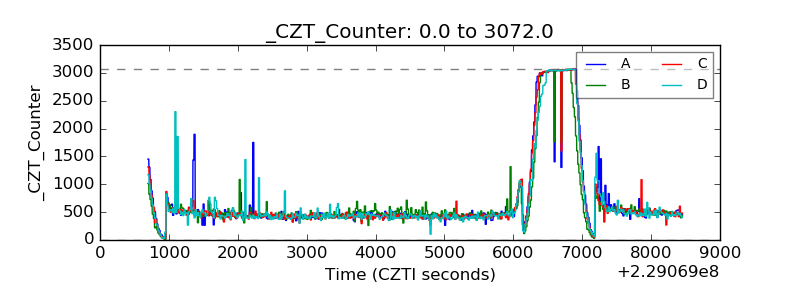 |
| +2.5 Volts monitor |  |
| +5 Volts monitor |  |
| _ROLL_ROT | 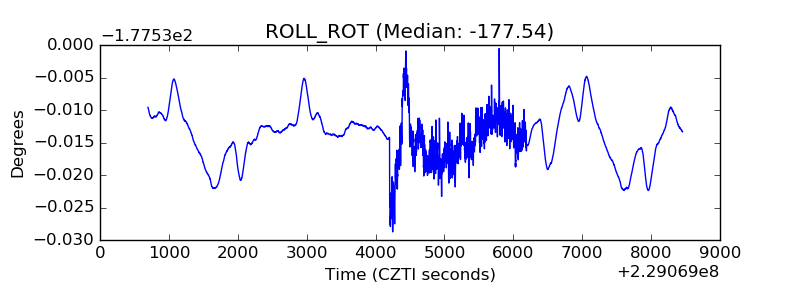 |
| _Roll_DEC | 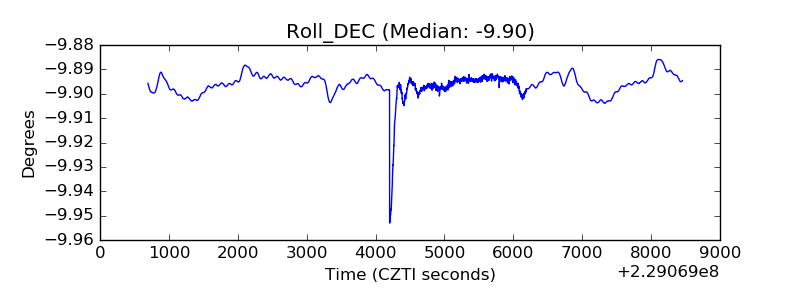 |
| _Roll_RA | 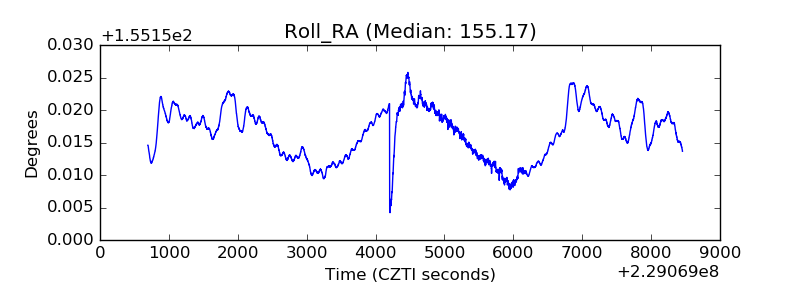 |
| Veto Counter | 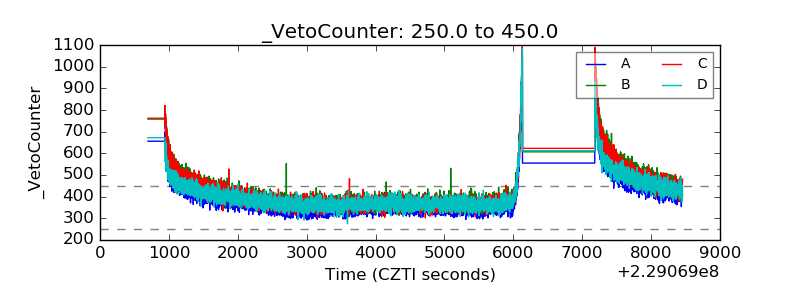 |