| Param | Original file | Final file |
|---|---|---|
| Filename | modeM0/AS1C02_041T01_9000001136_08219cztM0_level2.evt | modeM0/AS1C02_041T01_9000001136_08219cztM0_level2_quad_clean.evt |
| Size (bytes) | 440,357,760 | 72,040,320 |
| Size | 420.0 MB | 68.7 MB |
| Events in quadrant A | 3,173,892 | 438,809 |
| Events in quadrant B | 3,336,838 | 442,601 |
| Events in quadrant C | 3,156,491 | 431,849 |
| Events in quadrant D | 3,235,429 | 422,895 |
| Mode M9 | |||
|---|---|---|---|
| Quadrant | BADHDUFLAG | Total packets | Discarded packets |
| A | 0 | 20 | 0 |
| B | 0 | 20 | 0 |
| C | 0 | 20 | 0 |
| D | 0 | 21 | 0 |
| Mode SS | |||
|---|---|---|---|
| Quadrant | BADHDUFLAG | Total packets | Discarded packets |
| A | 0 | 130 | 0 |
| B | 0 | 130 | 0 |
| C | 0 | 130 | 0 |
| D | 0 | 130 | 0 |
| Mode M0 | |||
|---|---|---|---|
| Quadrant | BADHDUFLAG | Total packets | Discarded packets |
| A | 0 | 13452 | 3 |
| B | 0 | 13803 | 2 |
| C | 0 | 13395 | 2 |
| D | 0 | 13854 | 2 |
| Quadrant | Total seconds | Saturated seconds | Saturation percentage |
|---|---|---|---|
| A | 6377 | 96 | 1.505410% |
| B | 6377 | 88 | 1.379959% |
| C | 6377 | 68 | 1.066332% |
| D | 6377 | 106 | 1.662224% |
Noise dominated data is calculated using 1-second bins in cleaned event files. If a bin has >2000 counts, and if more than 50% of those come from <1% of pixels, then it is considered to be noise-dominated and hence unusable.
| Quadrant | # 1 sec bins | Bins with >0 counts | Bins with >2000 counts | High rate bins dominated by noise | Noise dominated (total time) | Noise dominated (detector-on time) | Marked lightcurve |
|---|---|---|---|---|---|---|---|
| A | 7572 | 6377 | 4 | 4 | 0.05% | 0.06% | 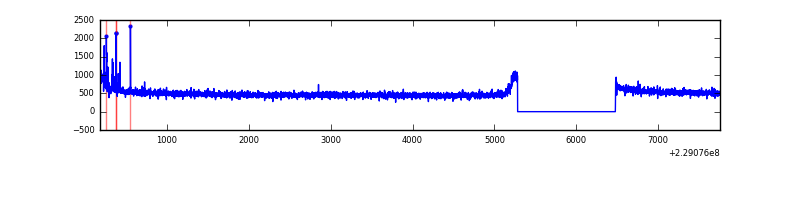 |
| B | 7572 | 6377 | 2 | 2 | 0.03% | 0.03% | 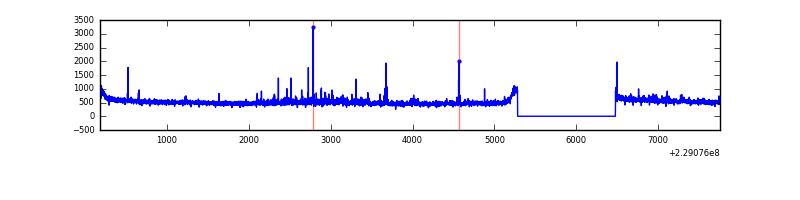 |
| C | 7572 | 6377 | 0 | 0 | 0.00% | 0.00% | 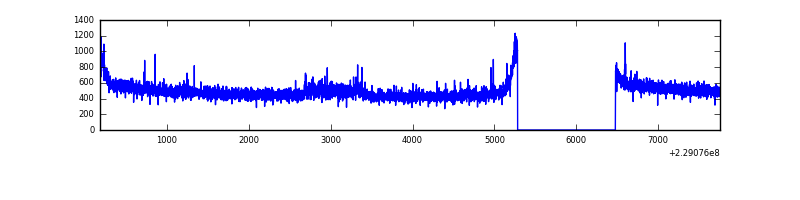 |
| D | 7572 | 6377 | 31 | 31 | 0.41% | 0.49% | 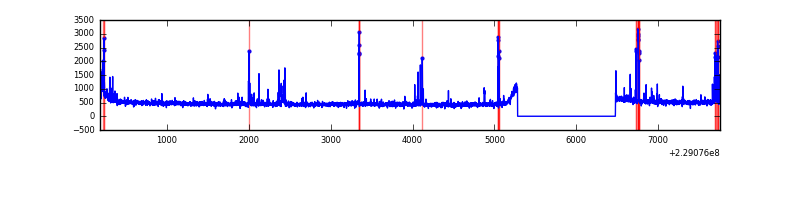 |
Top three noisy pixels from each quadrant. If the there are fewer than three noisy pixels in the level2.evt file, extra rows are filled as -1
| Pixel properties | Quadrant properties | ||||||
|---|---|---|---|---|---|---|---|
| Quadrant | DetID | PixID | Counts | Sigma | Mean | Median | Sigma |
| A | 5 | 16 | 38288 | 227.68 | 812 | 795 | 164.7 |
| A | 8 | 15 | 10528 | 59.1 | 812 | 795 | 164.7 |
| A | 0 | 226 | 7658 | 41.68 | 812 | 795 | 164.7 |
| B | 0 | 214 | 106458 | 680.83 | 817 | 798 | 155.2 |
| B | 0 | 219 | 24098 | 150.13 | 817 | 798 | 155.2 |
| B | 4 | 81 | 23668 | 147.36 | 817 | 798 | 155.2 |
| C | 9 | 68 | 66443 | 363.28 | 784 | 788 | 180.7 |
| C | 8 | 128 | 12427 | 64.4 | 784 | 788 | 180.7 |
| C | 8 | 112 | 6478 | 31.48 | 784 | 788 | 180.7 |
| D | 12 | 233 | 120889 | 561.42 | 780 | 761 | 214.0 |
| D | 13 | 105 | 62137 | 286.84 | 780 | 761 | 214.0 |
| D | 1 | 52 | 49489 | 227.73 | 780 | 761 | 214.0 |
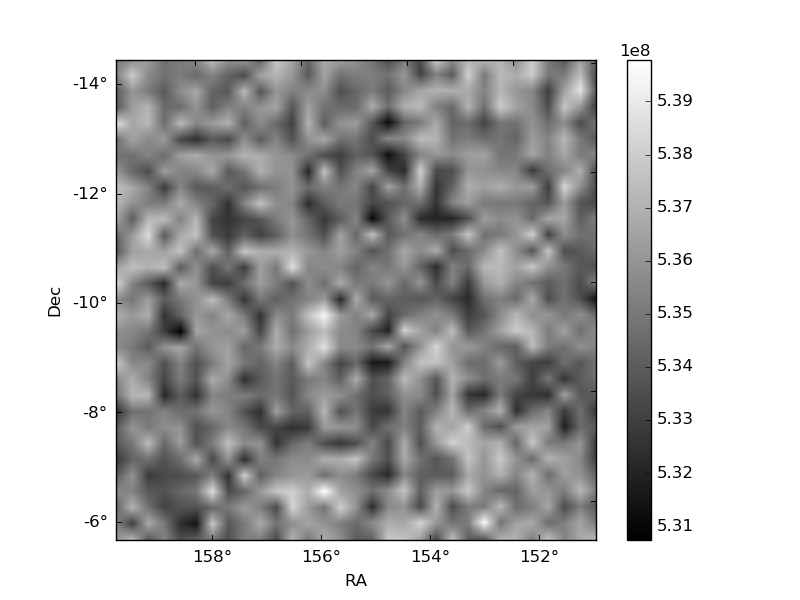
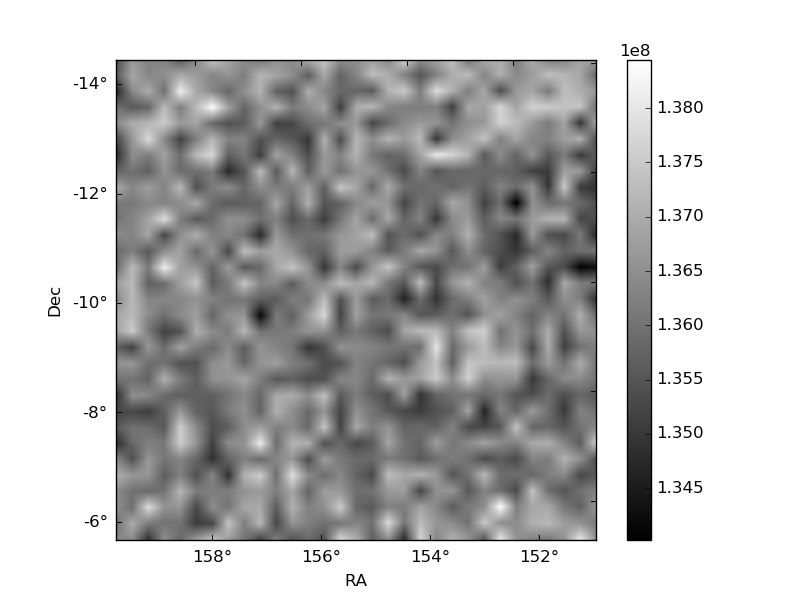
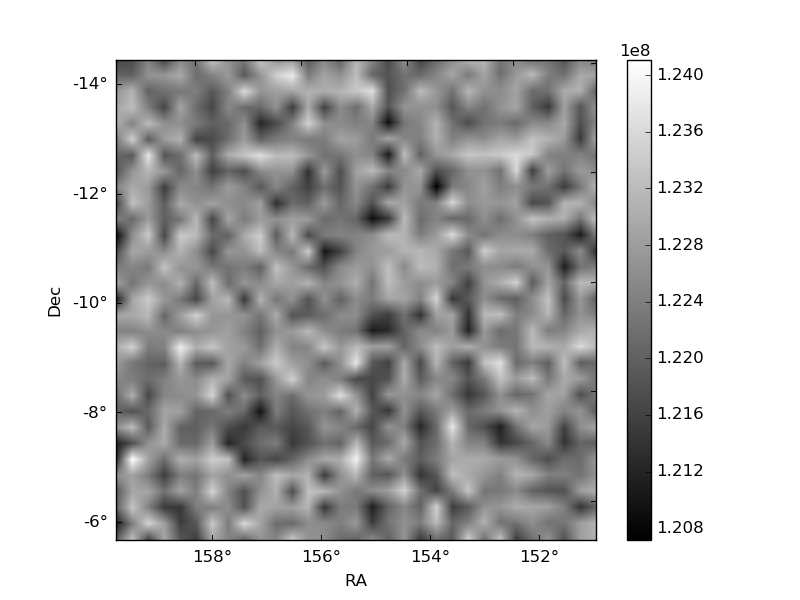
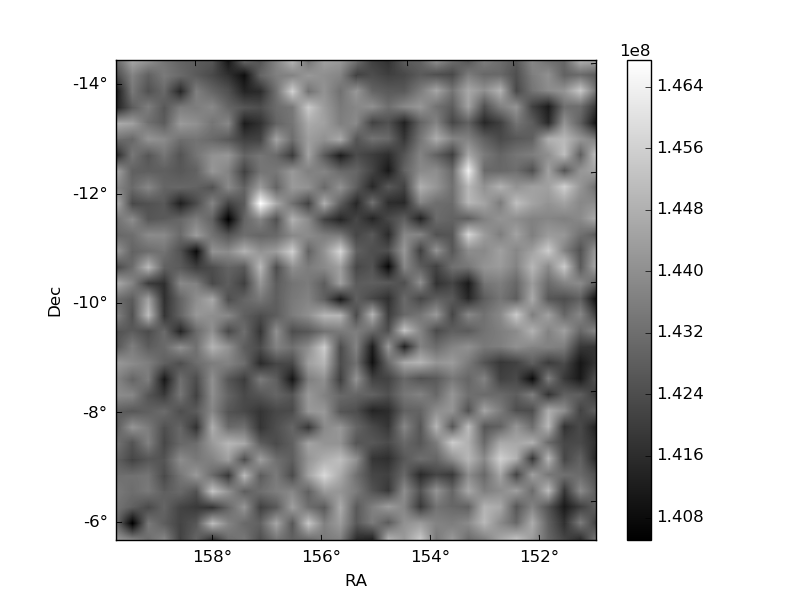
Histogram calculated using DETX and DETY for each event in the final _common_clean file
| Quadrant A | 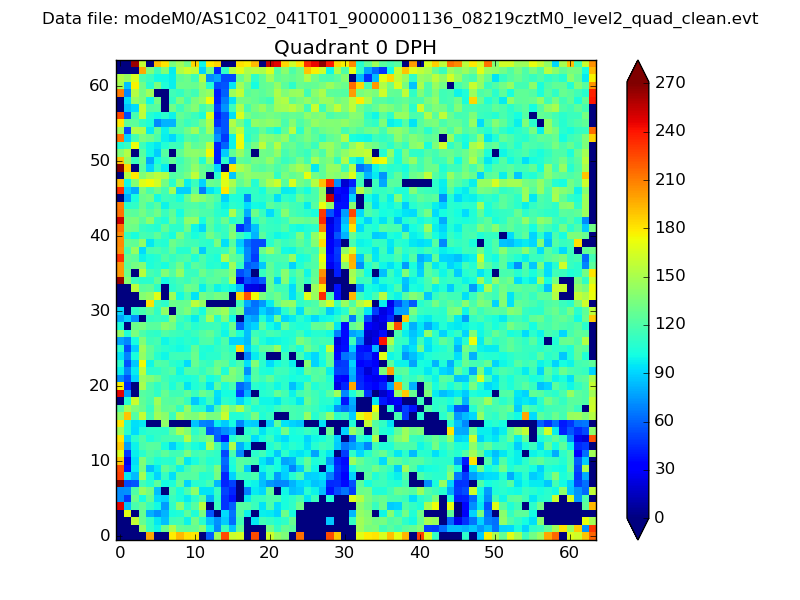 |
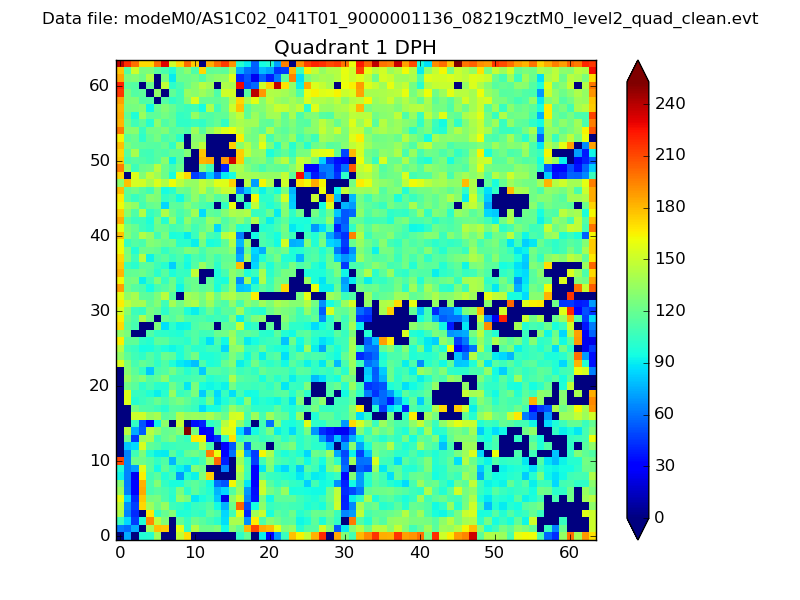 |
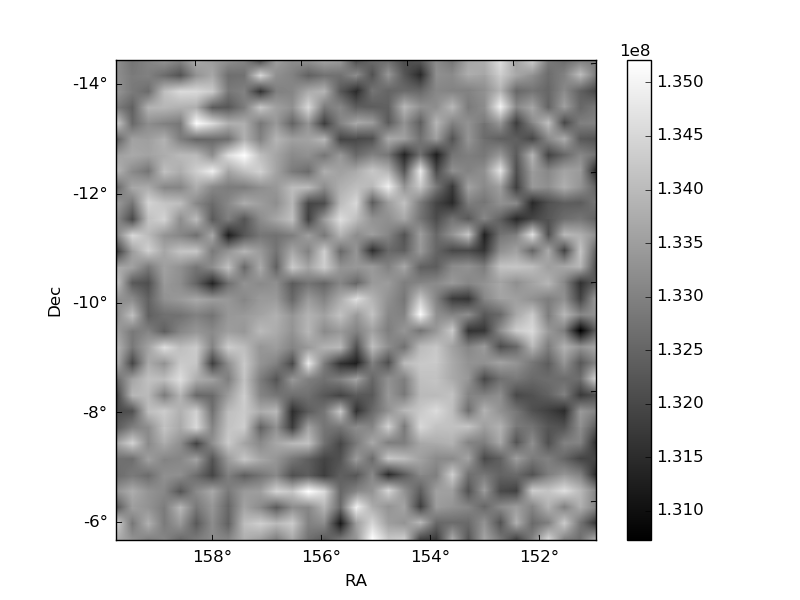
Quadrant B |
|---|---|---|---|
| Quadrant D | 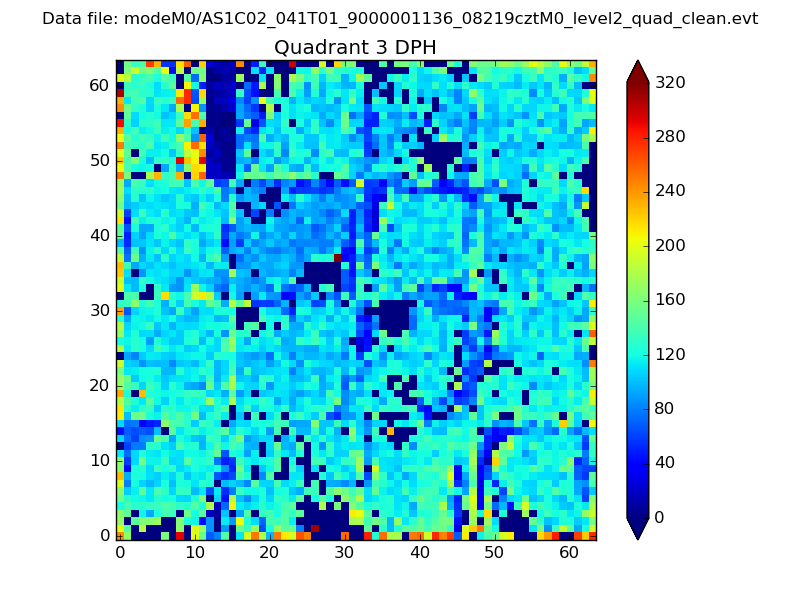 |
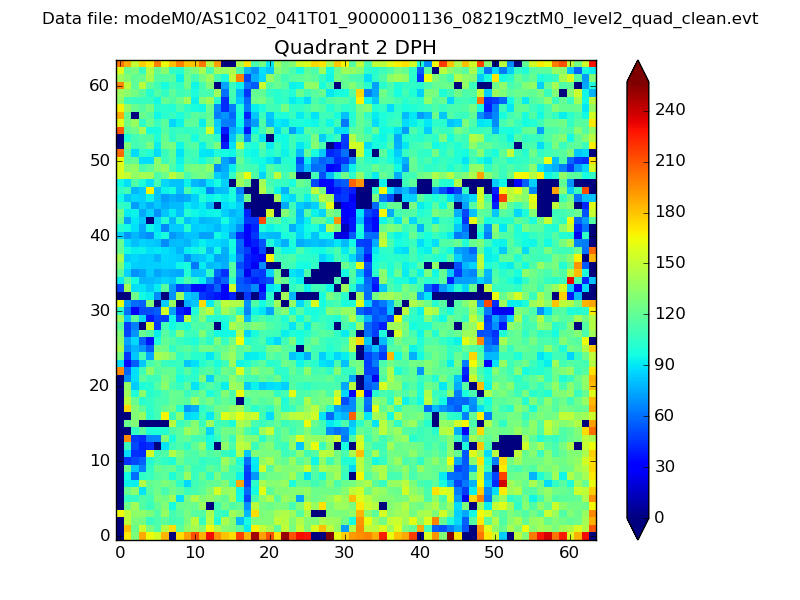 |
Quadrant C |
| Plot type | Count rate plots | Images |
|---|---|---|
| Comparison with Poisson distribution Blue bars denote a histogram of data divided into 1 sec bins. Red curve is a Poisson curve with rate = median count rate of data. |
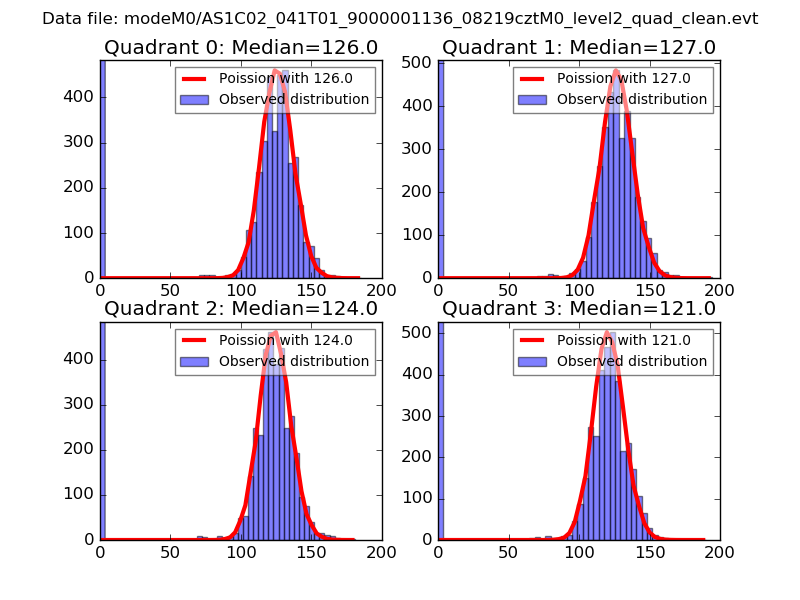 |
 |
| Quadrant-wise count rates Data is divided into 100 sec bins |
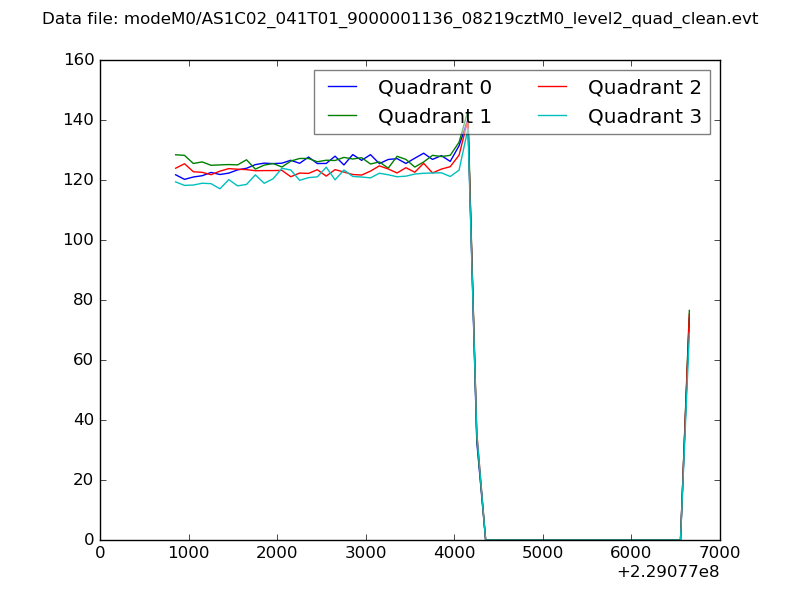 |
|
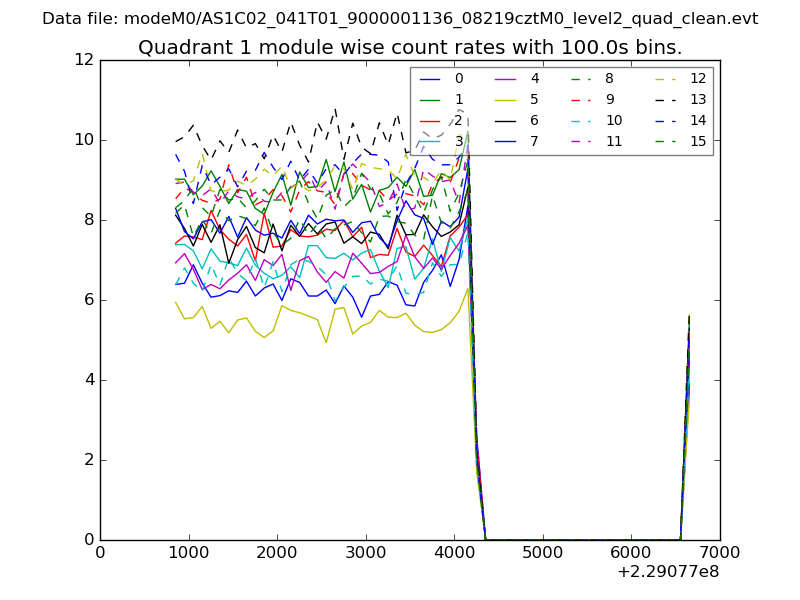
| Module-wise count rates for Quadrant A Data is divided into 100 sec bins |
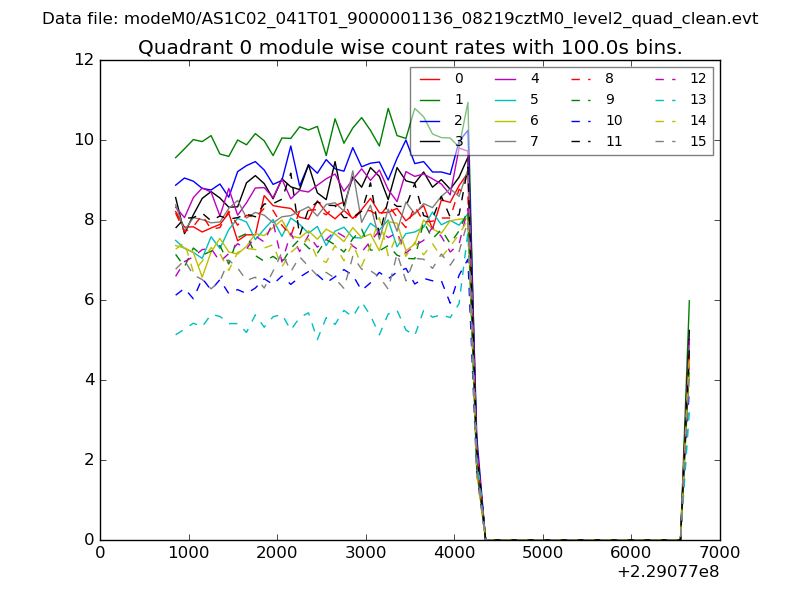 |
 |
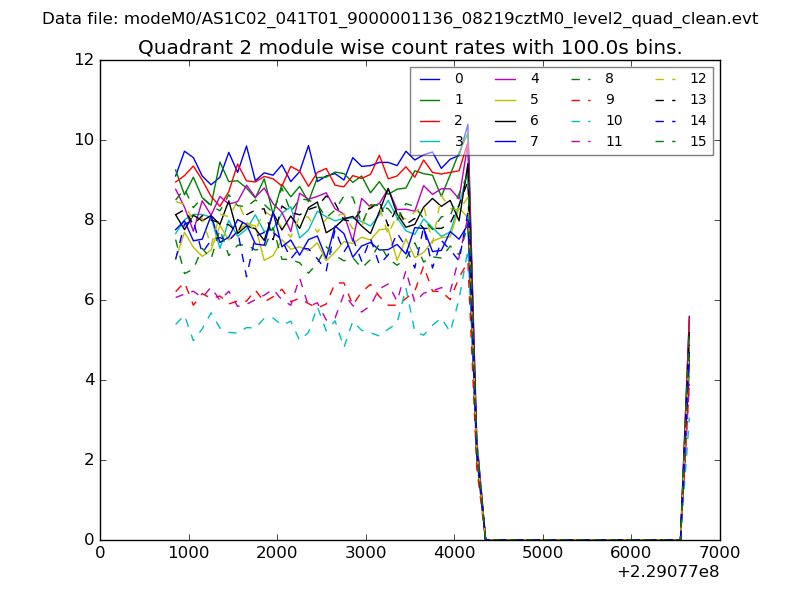
| Module-wise count rates for Quadrant B Data is divided into 100 sec bins |
 |
 |
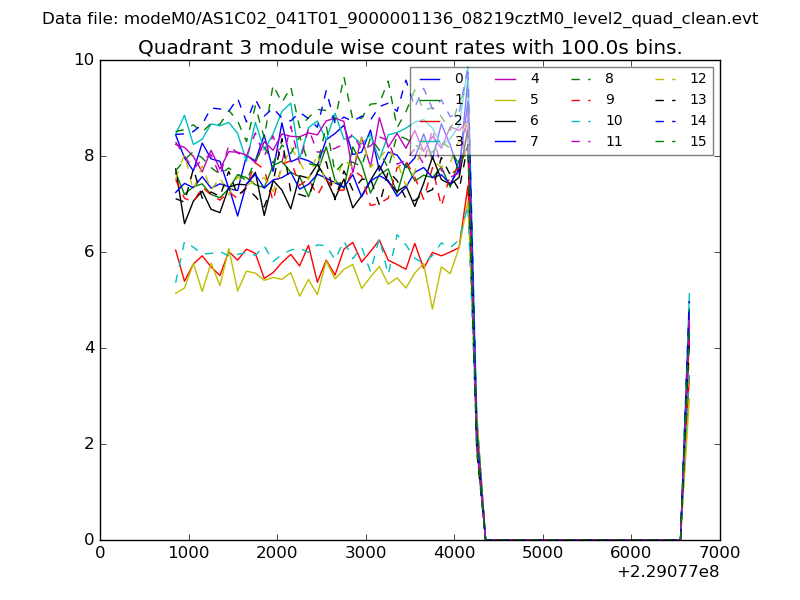
| Module-wise count rates for Quadrant C Data is divided into 100 sec bins |
 |
 |
| Module-wise count rates for Quadrant D Data is divided into 100 sec bins |
 |
 |
| Parameter | Plot |
|---|---|
| CZT HV Monitor | 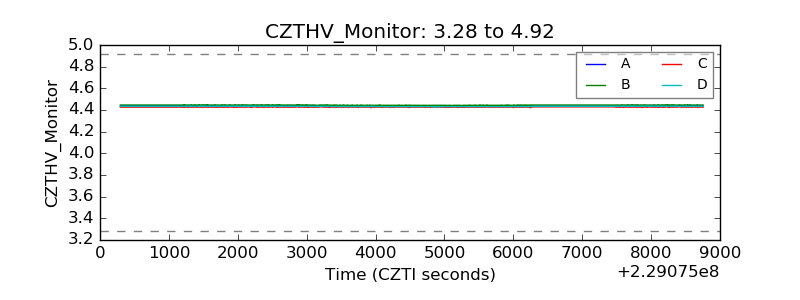 |
| D_VDD | 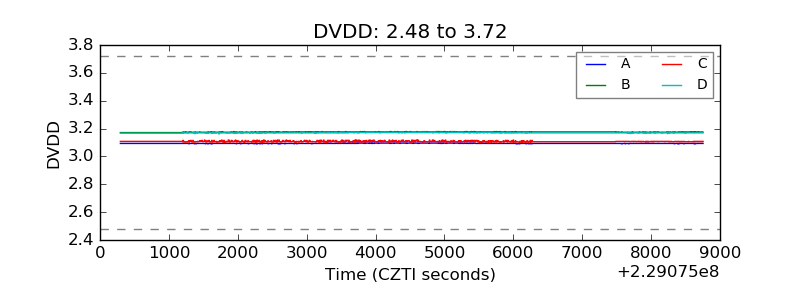 |
| Temperature 1 | 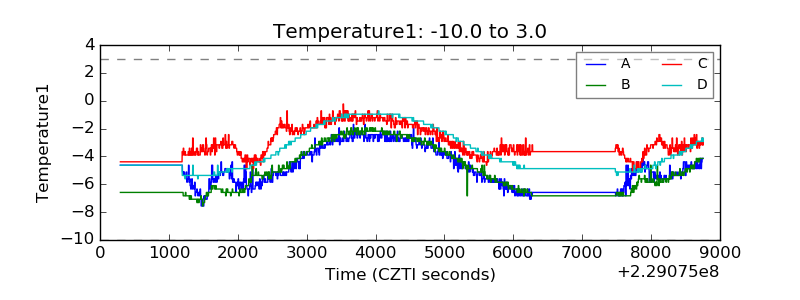 |
| Veto HV Monitor | 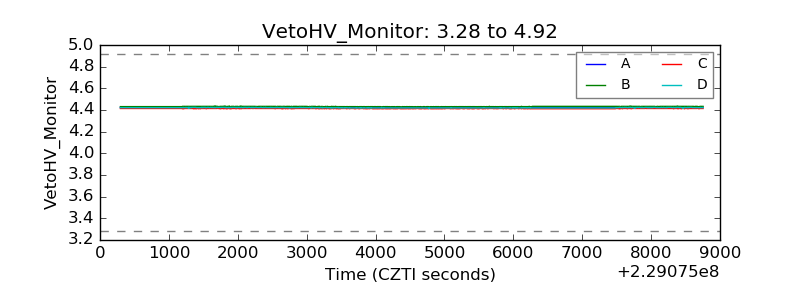 |
| Veto LLD | 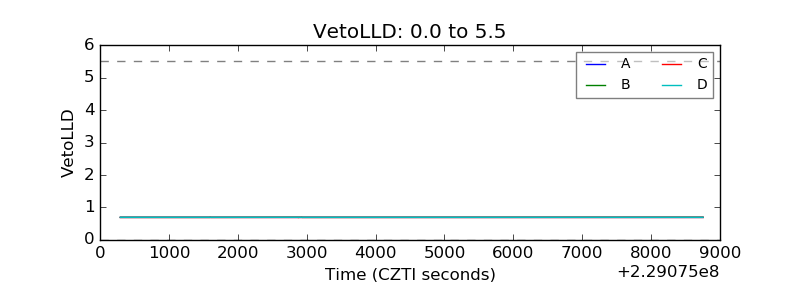 |
| Alpha Counter | 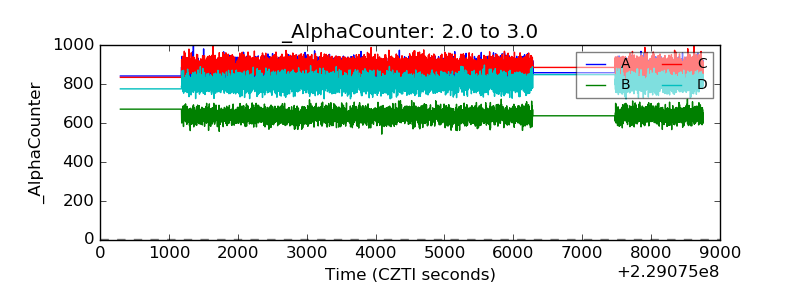 |
| _CPM_Rate | 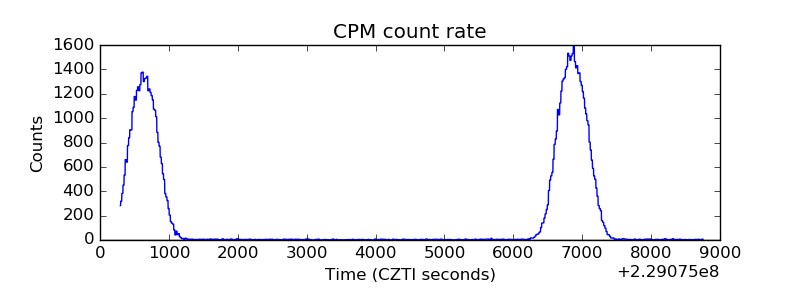 |
| CZT Counter | 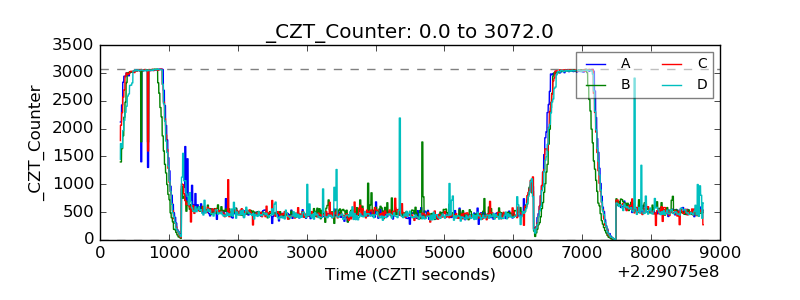 |
| +2.5 Volts monitor | 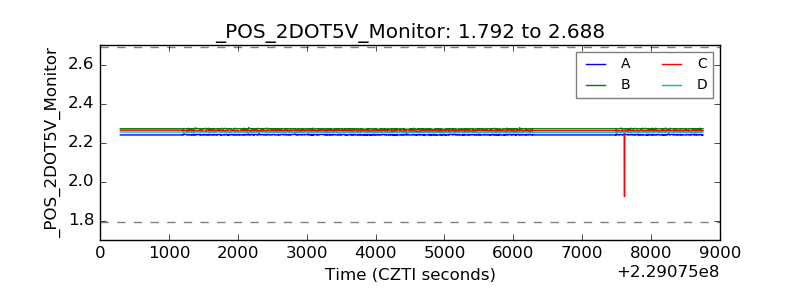 |
| +5 Volts monitor |  |
| _ROLL_ROT | 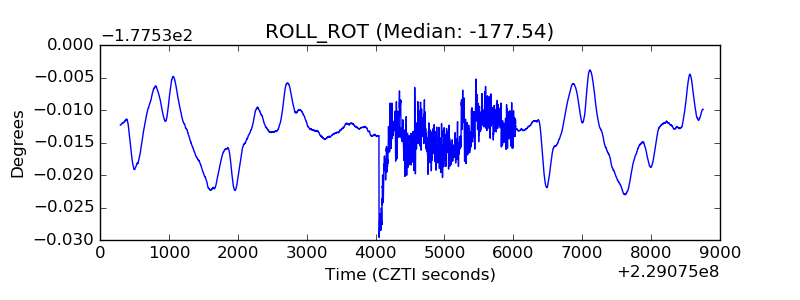 |
| _Roll_DEC | 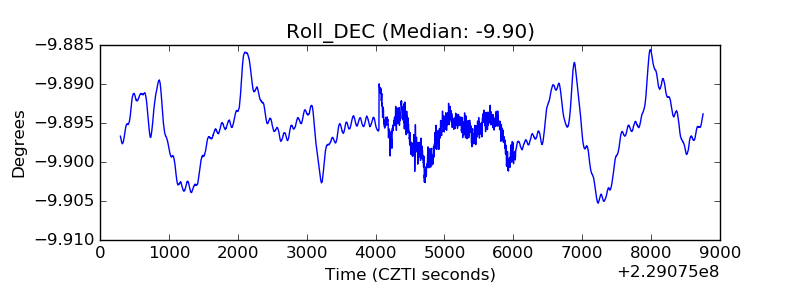 |
| _Roll_RA | 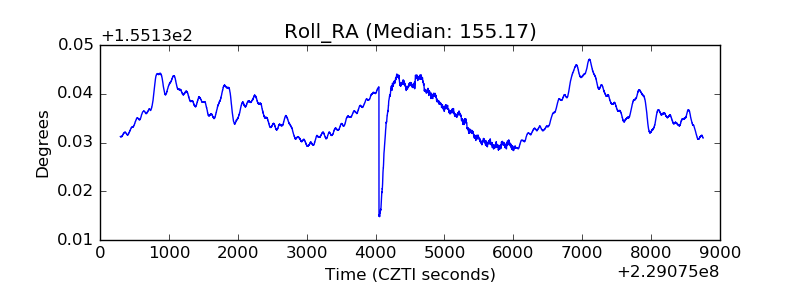 |
| Veto Counter | 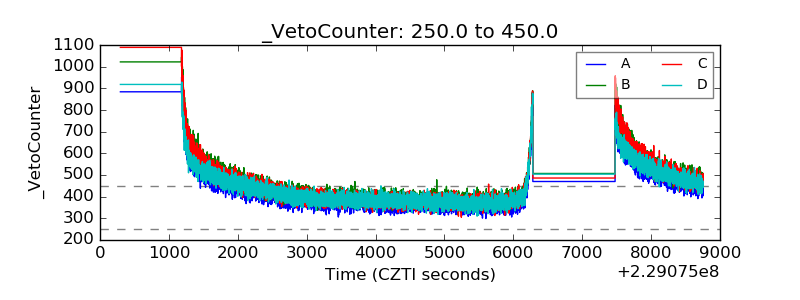 |