| Param | Original file | Final file |
|---|---|---|
| Filename | modeM0/AS1C02_041T01_9000001136_08220cztM0_level2.evt | modeM0/AS1C02_041T01_9000001136_08220cztM0_level2_quad_clean.evt |
| Size (bytes) | 508,904,640 | 97,355,520 |
| Size | 485.3 MB | 92.8 MB |
| Events in quadrant A | 3,566,512 | 624,695 |
| Events in quadrant B | 3,792,932 | 629,791 |
| Events in quadrant C | 3,672,665 | 612,639 |
| Events in quadrant D | 3,904,728 | 593,676 |
| Mode M9 | |||
|---|---|---|---|
| Quadrant | BADHDUFLAG | Total packets | Discarded packets |
| A | 0 | 25 | 0 |
| B | 0 | 25 | 0 |
| C | 0 | 25 | 0 |
| D | 0 | 25 | 0 |
| Mode SS | |||
|---|---|---|---|
| Quadrant | BADHDUFLAG | Total packets | Discarded packets |
| A | 0 | 142 | 0 |
| B | 0 | 142 | 0 |
| C | 0 | 142 | 0 |
| D | 0 | 142 | 0 |
| Mode M0 | |||
|---|---|---|---|
| Quadrant | BADHDUFLAG | Total packets | Discarded packets |
| A | 0 | 14922 | 3 |
| B | 0 | 15626 | 2 |
| C | 0 | 15359 | 2 |
| D | 0 | 16149 | 2 |
| Quadrant | Total seconds | Saturated seconds | Saturation percentage |
|---|---|---|---|
| A | 7007 | 156 | 2.226345% |
| B | 7007 | 170 | 2.426145% |
| C | 7007 | 118 | 1.684030% |
| D | 7007 | 203 | 2.897103% |
Noise dominated data is calculated using 1-second bins in cleaned event files. If a bin has >2000 counts, and if more than 50% of those come from <1% of pixels, then it is considered to be noise-dominated and hence unusable.
| Quadrant | # 1 sec bins | Bins with >0 counts | Bins with >2000 counts | High rate bins dominated by noise | Noise dominated (total time) | Noise dominated (detector-on time) | Marked lightcurve |
|---|---|---|---|---|---|---|---|
| A | 9422 | 7007 | 1 | 1 | 0.01% | 0.01% | 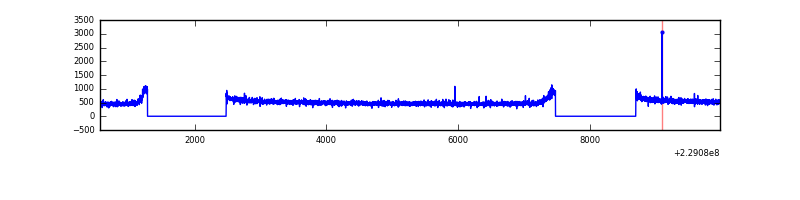 |
| B | 9422 | 7007 | 12 | 12 | 0.13% | 0.17% | 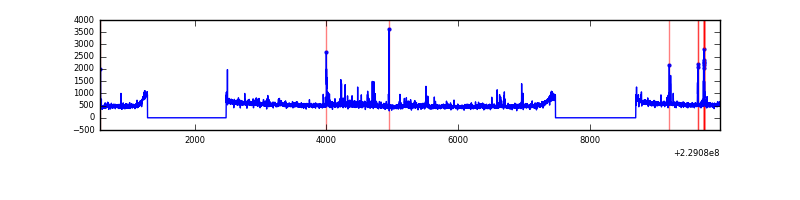 |
| C | 9422 | 7007 | 0 | 0 | 0.00% | 0.00% | 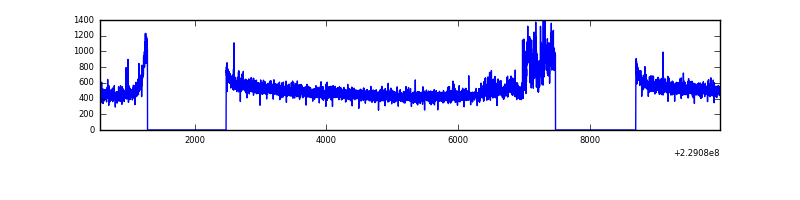 |
| D | 9422 | 7007 | 82 | 82 | 0.87% | 1.17% | 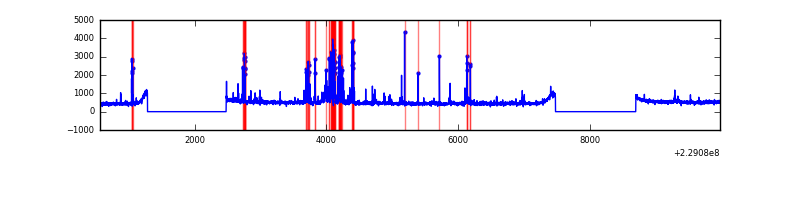 |
Top three noisy pixels from each quadrant. If the there are fewer than three noisy pixels in the level2.evt file, extra rows are filled as -1
| Pixel properties | Quadrant properties | ||||||
|---|---|---|---|---|---|---|---|
| Quadrant | DetID | PixID | Counts | Sigma | Mean | Median | Sigma |
| A | 8 | 15 | 10814 | 53.16 | 922 | 903 | 186.4 |
| A | 0 | 226 | 8660 | 41.61 | 922 | 903 | 186.4 |
| A | 12 | 194 | 8152 | 38.88 | 922 | 903 | 186.4 |
| B | 4 | 81 | 78883 | 450.07 | 919 | 901 | 173.3 |
| B | 0 | 214 | 78595 | 448.41 | 919 | 901 | 173.3 |
| B | 10 | 16 | 29870 | 167.19 | 919 | 901 | 173.3 |
| C | 9 | 68 | 214733 | 1049.98 | 883 | 888 | 203.7 |
| C | 14 | 67 | 9350 | 41.55 | 883 | 888 | 203.7 |
| C | 13 | 61 | 6823 | 29.14 | 883 | 888 | 203.7 |
| D | 12 | 233 | 345054 | 1441.78 | 883 | 864 | 238.7 |
| D | 1 | 52 | 71395 | 295.45 | 883 | 864 | 238.7 |
| D | 13 | 105 | 70239 | 290.6 | 883 | 864 | 238.7 |
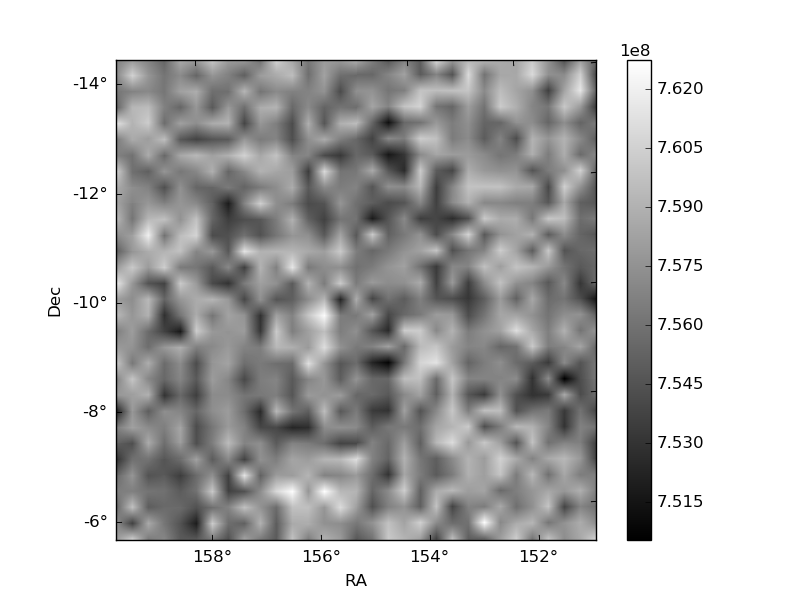
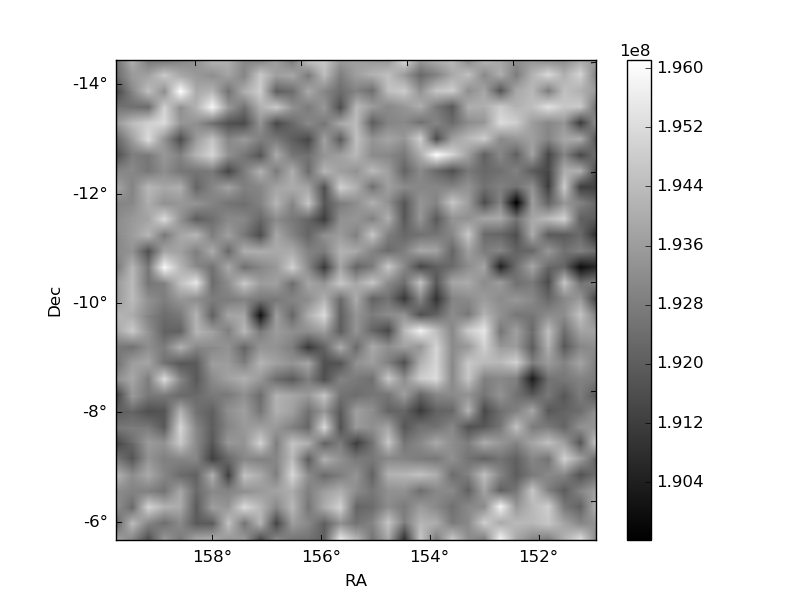
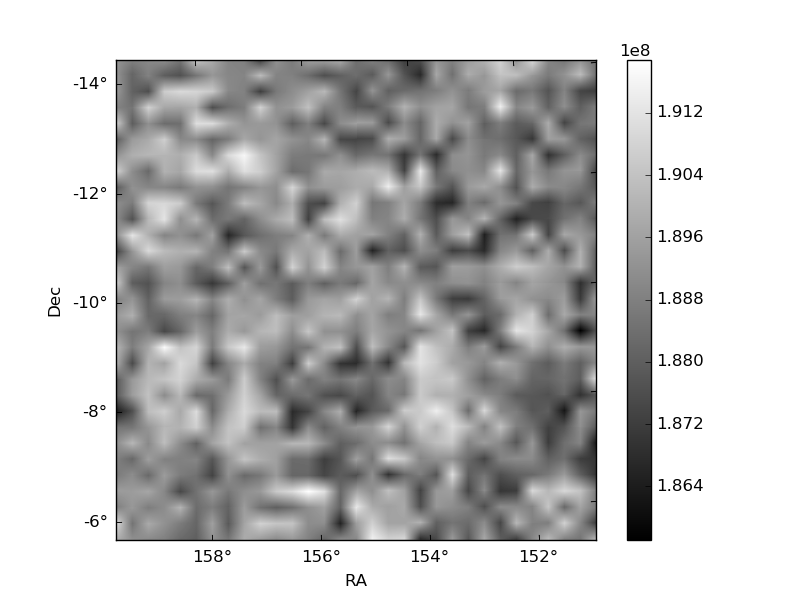
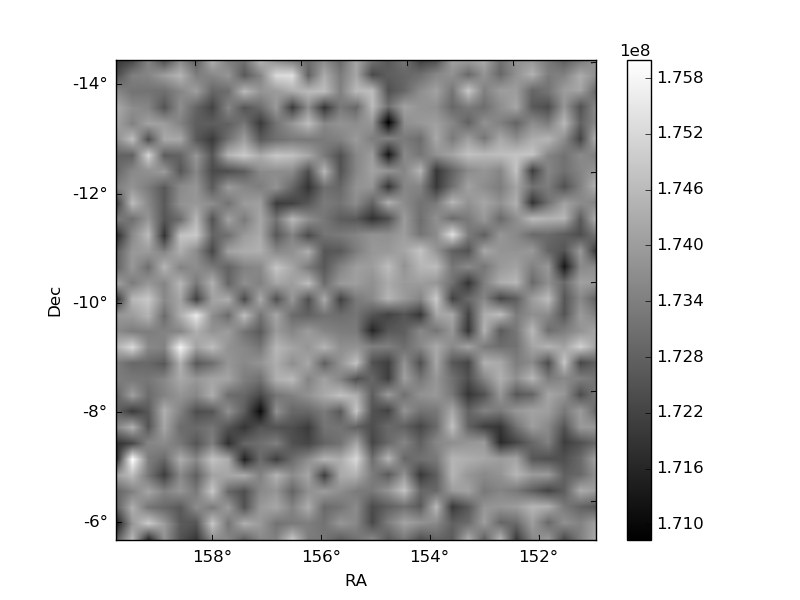
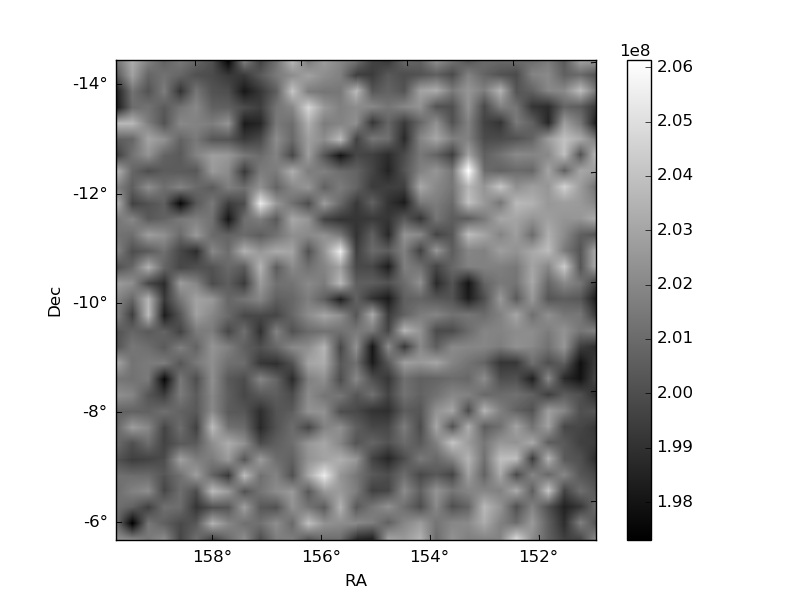
Histogram calculated using DETX and DETY for each event in the final _common_clean file
| Quadrant A | 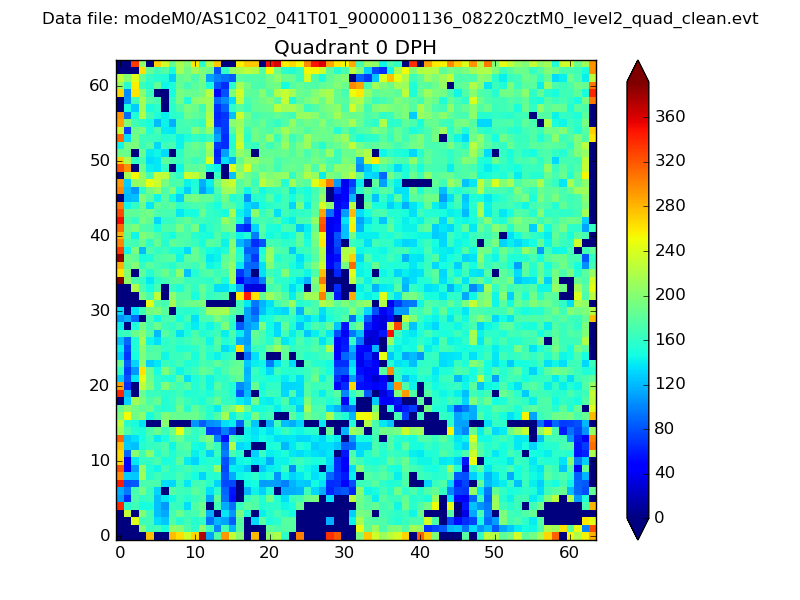 |
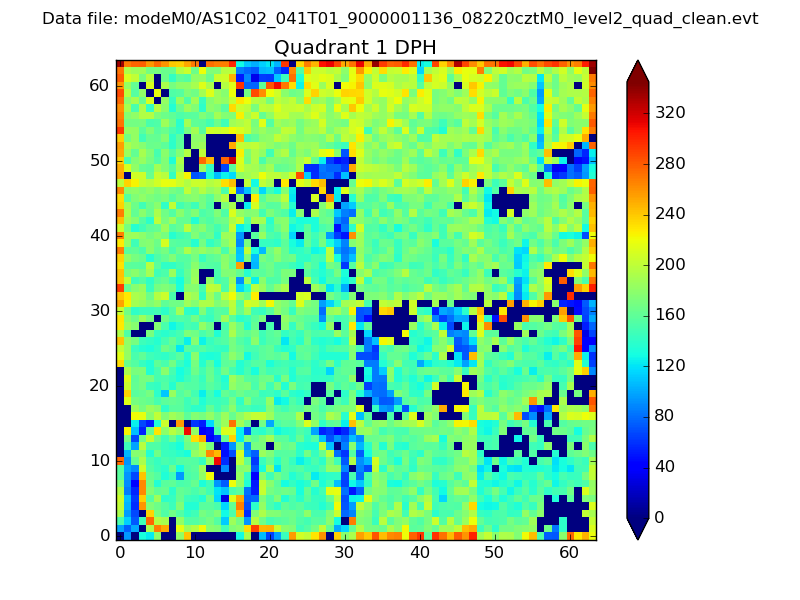 |
Quadrant B |
|---|---|---|---|
| Quadrant D | 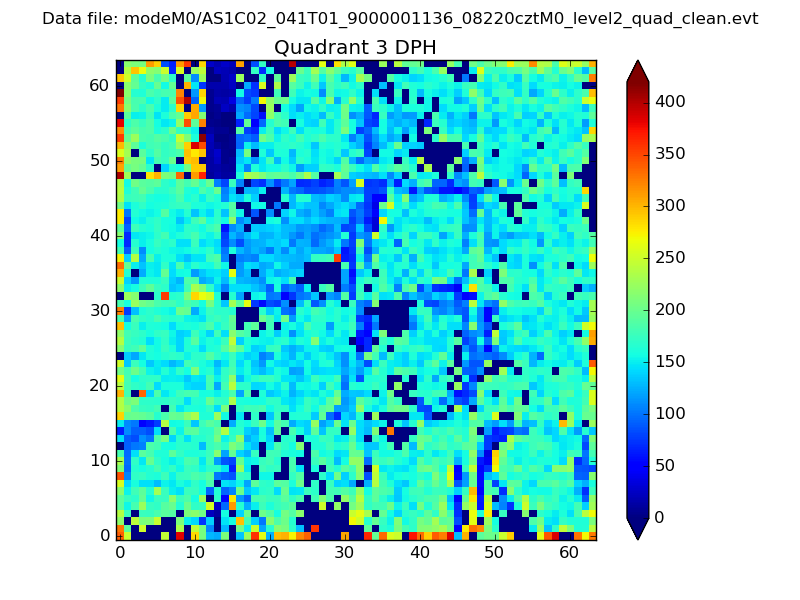 |
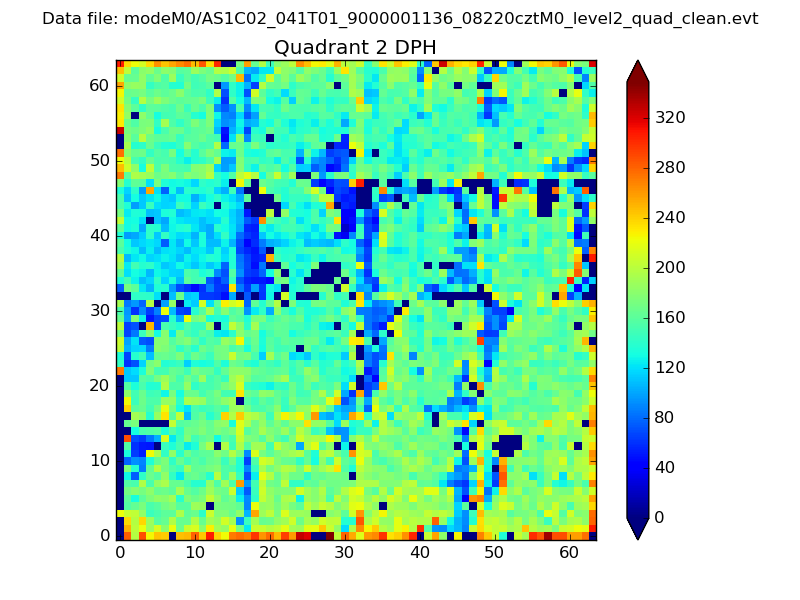 |
Quadrant C |
| Plot type | Count rate plots | Images |
|---|---|---|
| Comparison with Poisson distribution Blue bars denote a histogram of data divided into 1 sec bins. Red curve is a Poisson curve with rate = median count rate of data. |
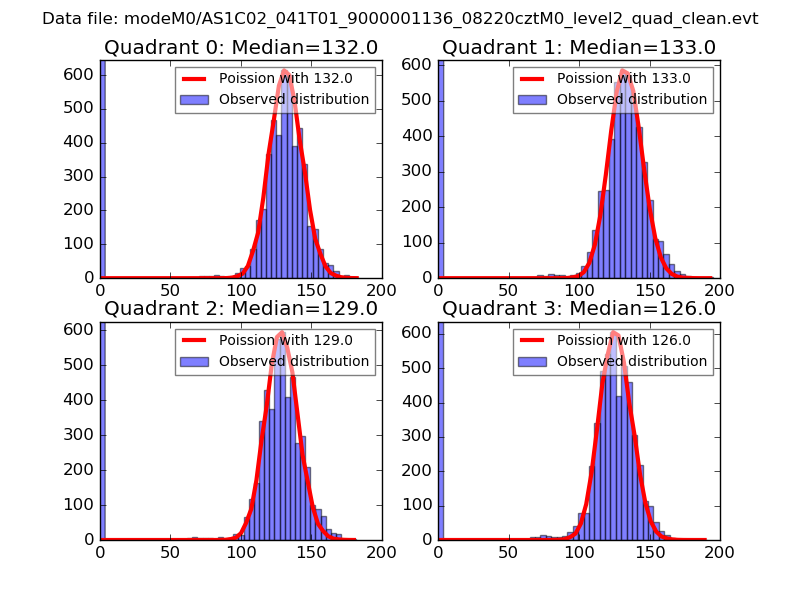 |
 |
| Quadrant-wise count rates Data is divided into 100 sec bins |
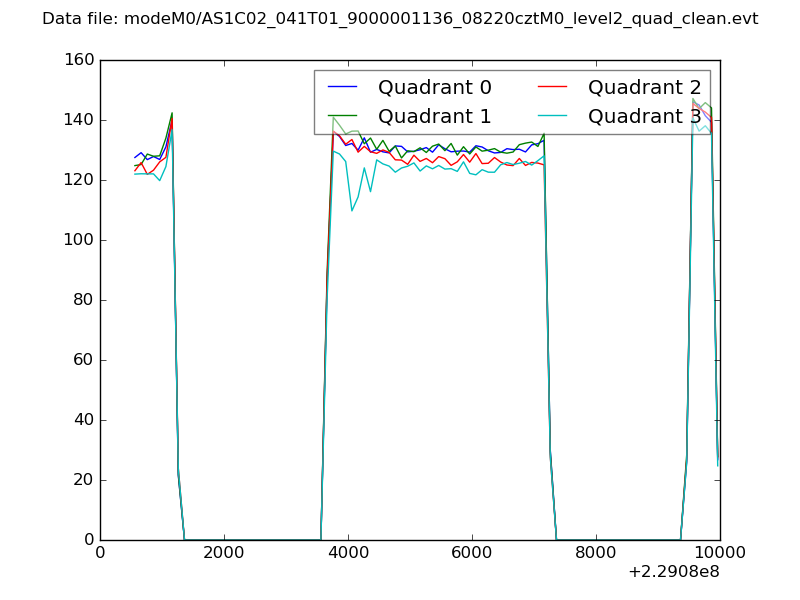 |
|
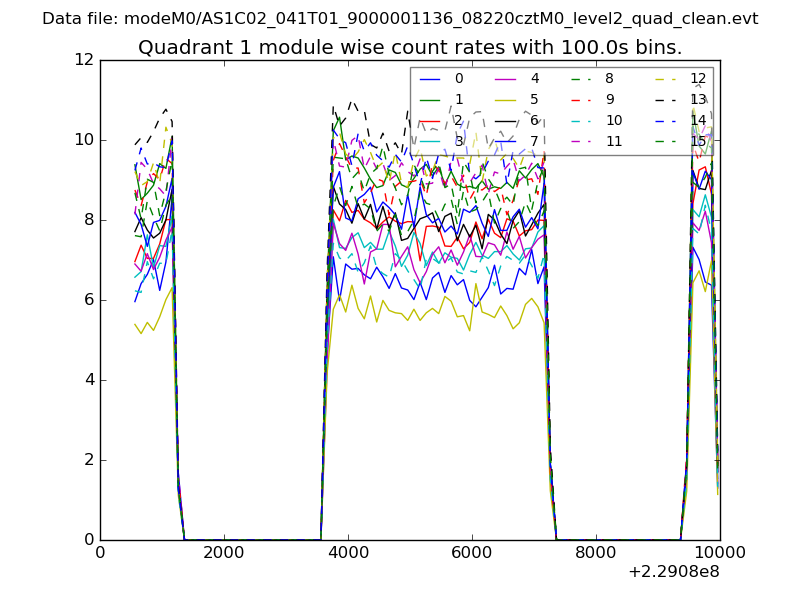
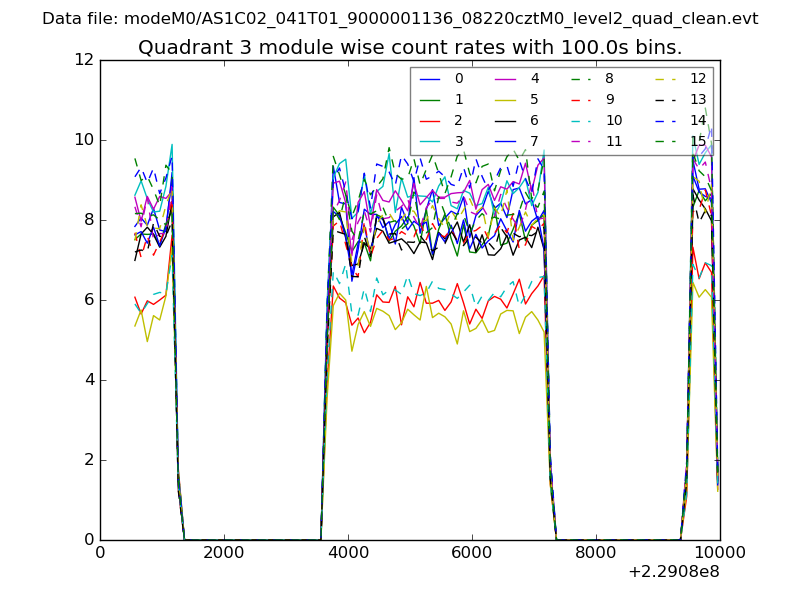
| Module-wise count rates for Quadrant A Data is divided into 100 sec bins |
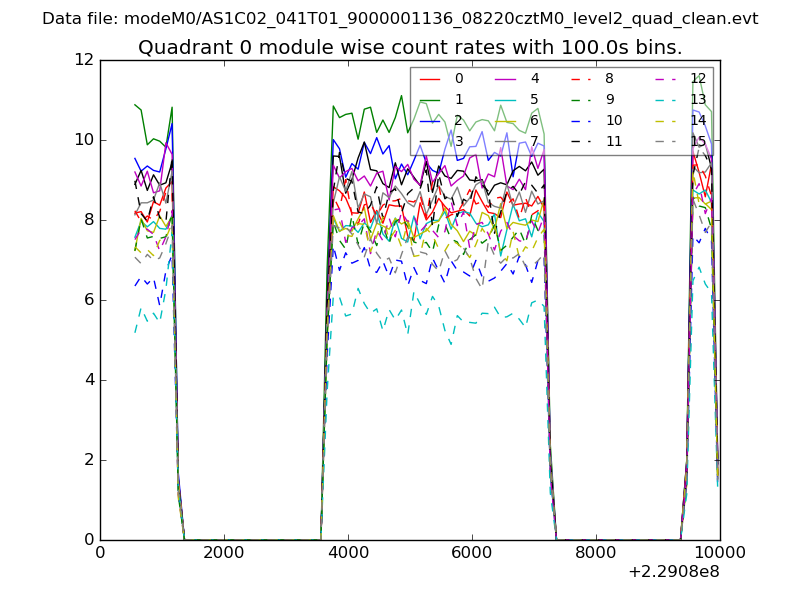 |
 |
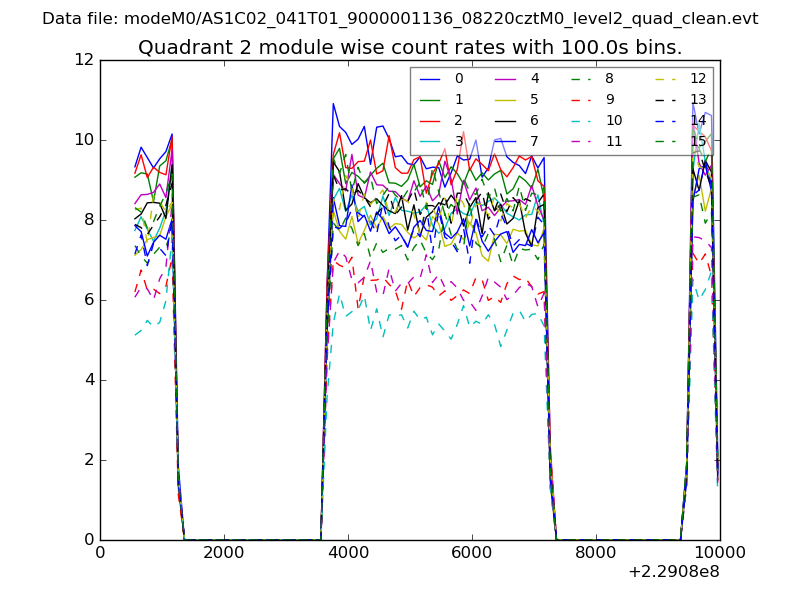
| Module-wise count rates for Quadrant B Data is divided into 100 sec bins |
 |
 |
| Module-wise count rates for Quadrant C Data is divided into 100 sec bins |
 |
 |
| Module-wise count rates for Quadrant D Data is divided into 100 sec bins |
 |
 |
| Parameter | Plot |
|---|---|
| CZT HV Monitor | 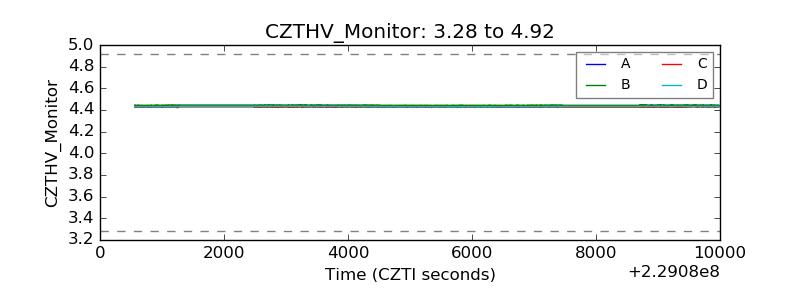 |
| D_VDD | 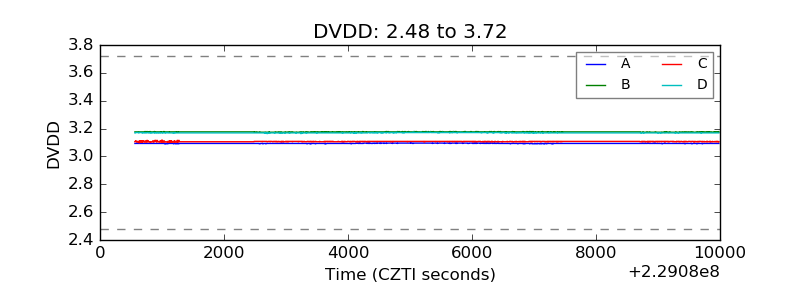 |
| Temperature 1 |  |
| Veto HV Monitor | 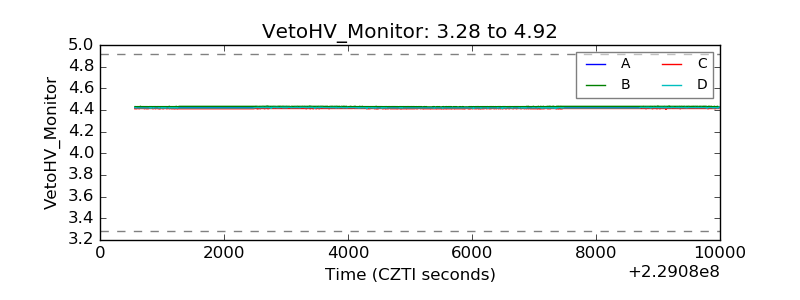 |
| Veto LLD | 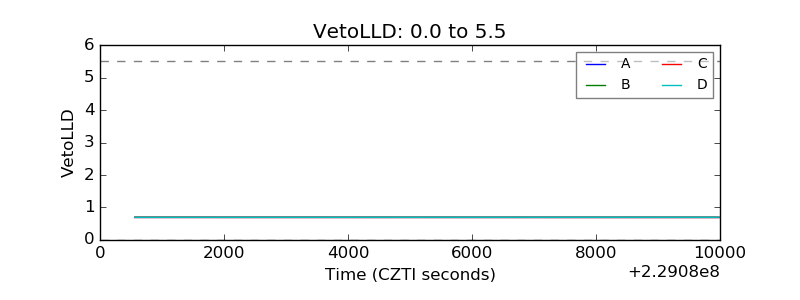 |
| Alpha Counter | 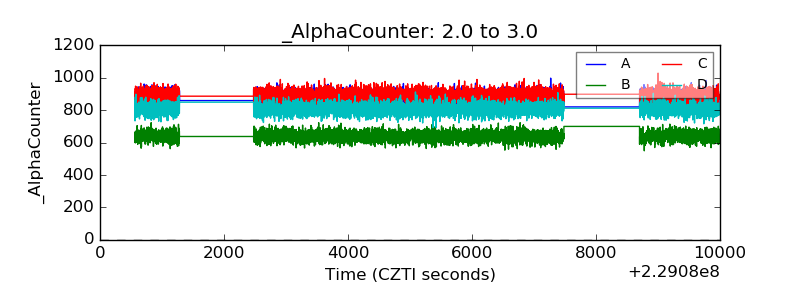 |
| _CPM_Rate | 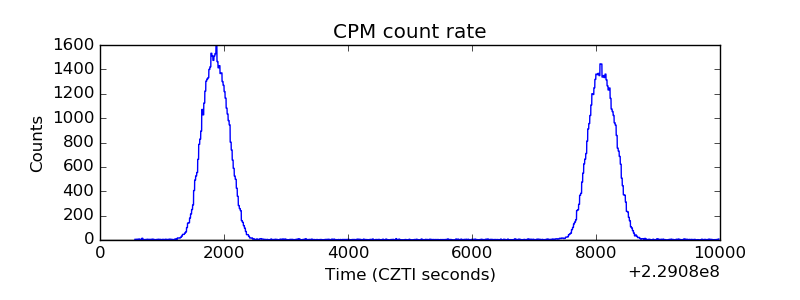 |
| CZT Counter | 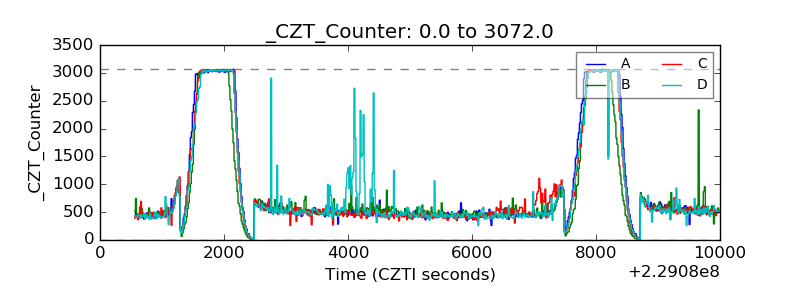 |
| +2.5 Volts monitor |  |
| +5 Volts monitor |  |
| _ROLL_ROT | 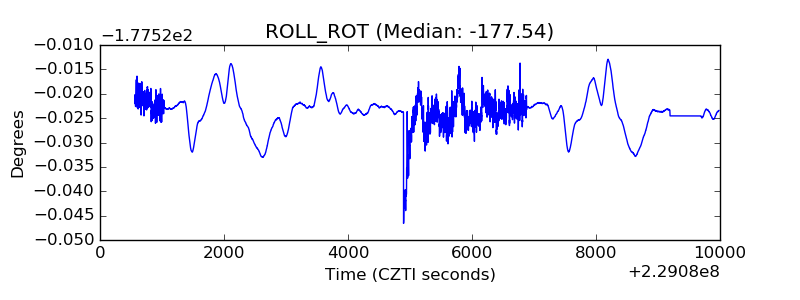 |
| _Roll_DEC | 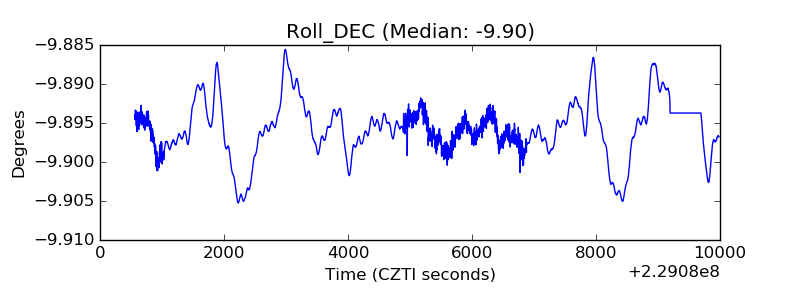 |
| _Roll_RA | 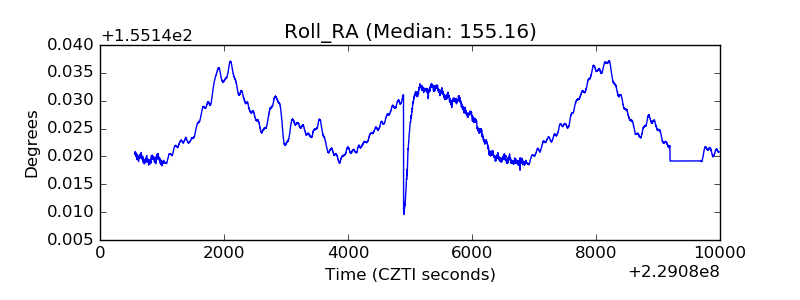 |
| Veto Counter | 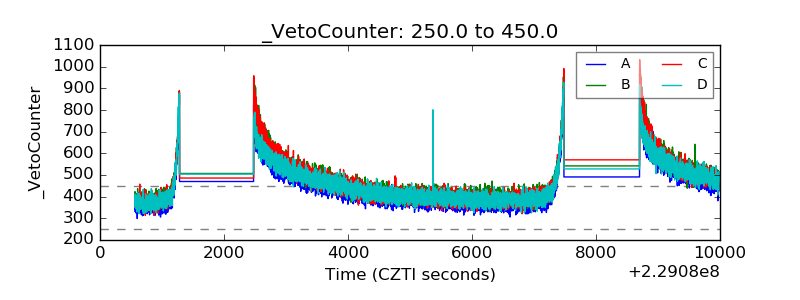 |