| Param | Original file | Final file |
|---|---|---|
| Filename | modeM0/AS1C02_041T01_9000001136_08222cztM0_level2.evt | modeM0/AS1C02_041T01_9000001136_08222cztM0_level2_quad_clean.evt |
| Size (bytes) | 740,260,800 | 166,265,280 |
| Size | 706.0 MB | 158.6 MB |
| Events in quadrant A | 5,594,730 | 1,101,118 |
| Events in quadrant B | 5,676,430 | 1,100,858 |
| Events in quadrant C | 4,922,317 | 1,074,007 |
| Events in quadrant D | 5,524,672 | 1,043,630 |
| Mode M9 | |||
|---|---|---|---|
| Quadrant | BADHDUFLAG | Total packets | Discarded packets |
| A | 0 | 24 | 0 |
| B | 0 | 24 | 0 |
| C | 0 | 24 | 0 |
| D | 0 | 24 | 0 |
| Mode SS | |||
|---|---|---|---|
| Quadrant | BADHDUFLAG | Total packets | Discarded packets |
| A | 0 | 212 | 0 |
| B | 0 | 212 | 0 |
| C | 0 | 212 | 0 |
| D | 0 | 212 | 0 |
| Mode M0 | |||
|---|---|---|---|
| Quadrant | BADHDUFLAG | Total packets | Discarded packets |
| A | 0 | 23230 | 3 |
| B | 0 | 23383 | 2 |
| C | 0 | 21553 | 2 |
| D | 0 | 23212 | 2 |
| Quadrant | Total seconds | Saturated seconds | Saturation percentage |
|---|---|---|---|
| A | 10341 | 213 | 2.059762% |
| B | 10341 | 278 | 2.688328% |
| C | 10341 | 149 | 1.440866% |
| D | 10341 | 213 | 2.059762% |
Noise dominated data is calculated using 1-second bins in cleaned event files. If a bin has >2000 counts, and if more than 50% of those come from <1% of pixels, then it is considered to be noise-dominated and hence unusable.
| Quadrant | # 1 sec bins | Bins with >0 counts | Bins with >2000 counts | High rate bins dominated by noise | Noise dominated (total time) | Noise dominated (detector-on time) | Marked lightcurve |
|---|---|---|---|---|---|---|---|
| A | 12786 | 10341 | 8 | 8 | 0.06% | 0.08% | 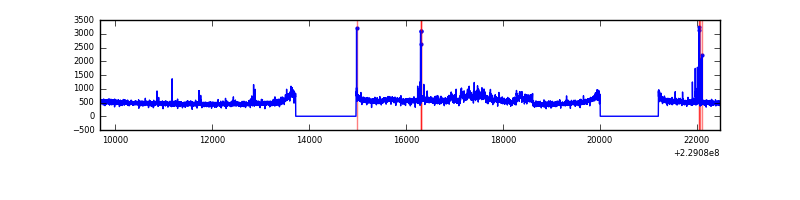 |
| B | 12786 | 10341 | 63 | 63 | 0.49% | 0.61% | 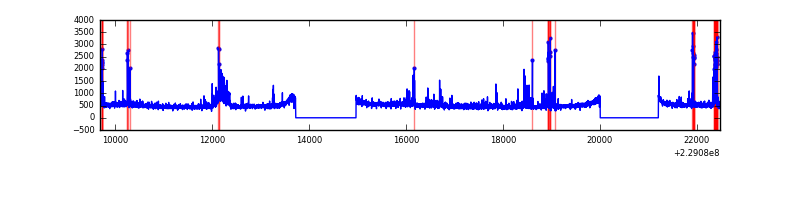 |
| C | 12786 | 10342 | 1 | 1 | 0.01% | 0.01% | 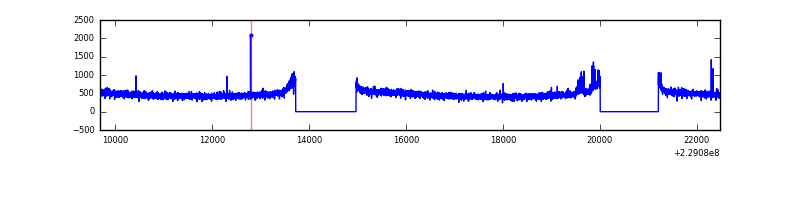 |
| D | 12786 | 10342 | 57 | 57 | 0.45% | 0.55% | 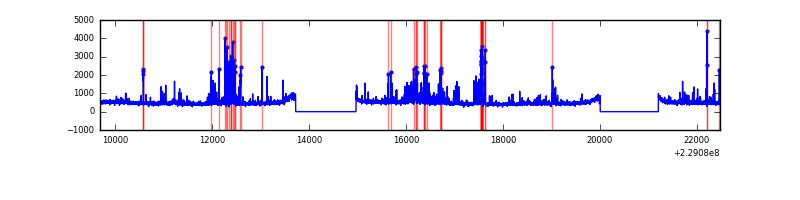 |
Top three noisy pixels from each quadrant. If the there are fewer than three noisy pixels in the level2.evt file, extra rows are filled as -1
| Pixel properties | Quadrant properties | ||||||
|---|---|---|---|---|---|---|---|
| Quadrant | DetID | PixID | Counts | Sigma | Mean | Median | Sigma |
| A | 15 | 79 | 517306 | 1964.99 | 1301 | 1278 | 262.6 |
| A | 5 | 16 | 57440 | 213.86 | 1301 | 1278 | 262.6 |
| A | 0 | 226 | 12421 | 42.43 | 1301 | 1278 | 262.6 |
| B | 0 | 245 | 156035 | 635.74 | 1289 | 1263 | 243.5 |
| B | 0 | 214 | 121530 | 494.01 | 1289 | 1263 | 243.5 |
| B | 0 | 213 | 119661 | 486.33 | 1289 | 1263 | 243.5 |
| C | 9 | 68 | 59254 | 203.39 | 1239 | 1245 | 285.2 |
| C | 1 | 16 | 24963 | 83.16 | 1239 | 1245 | 285.2 |
| C | 13 | 61 | 9498 | 28.94 | 1239 | 1245 | 285.2 |
| D | 13 | 105 | 417013 | 1345.65 | 1260 | 1224 | 309.0 |
| D | 1 | 52 | 170920 | 549.2 | 1260 | 1224 | 309.0 |
| D | 12 | 233 | 123130 | 394.53 | 1260 | 1224 | 309.0 |
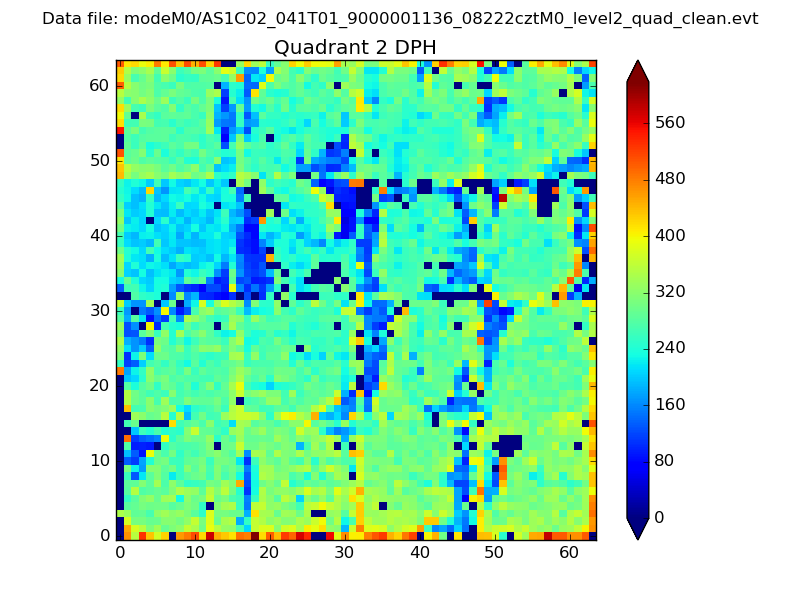
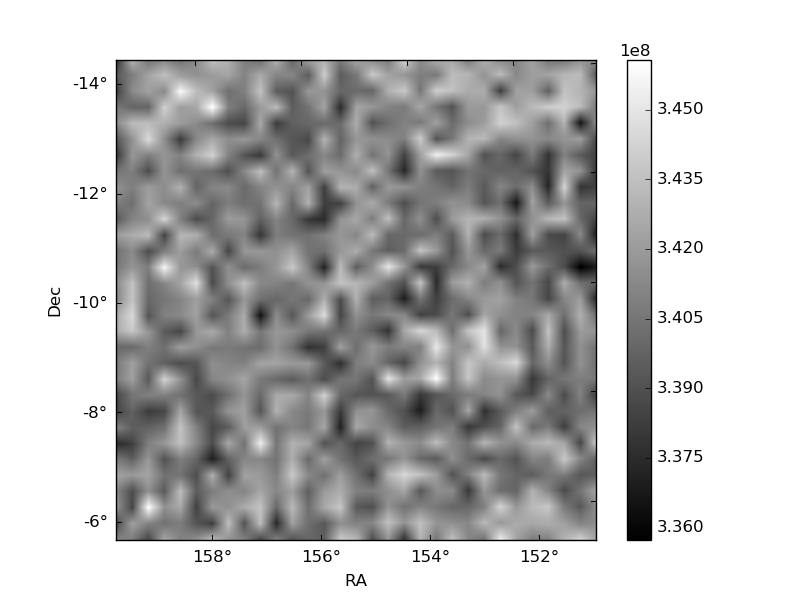
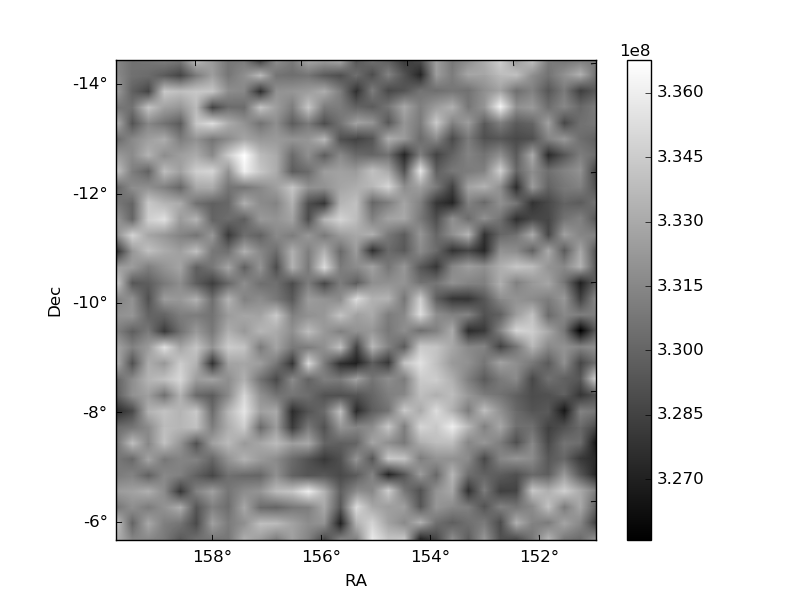
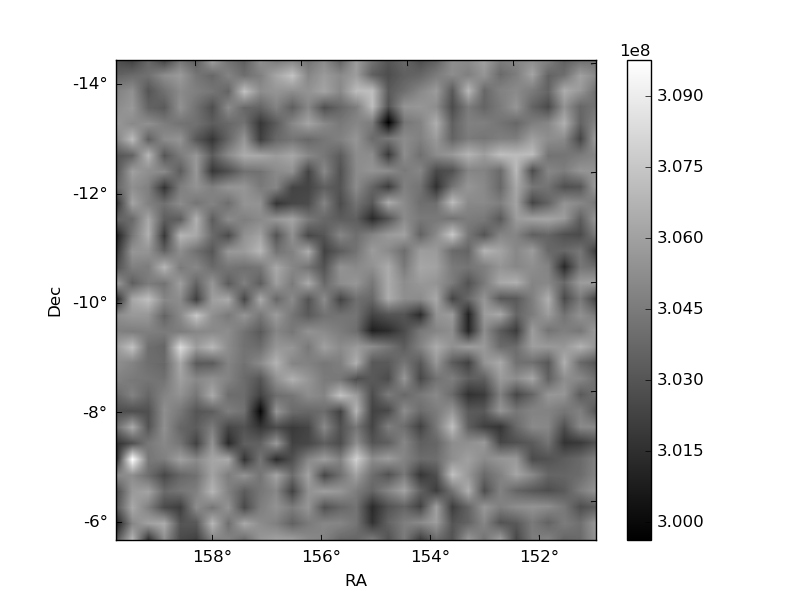
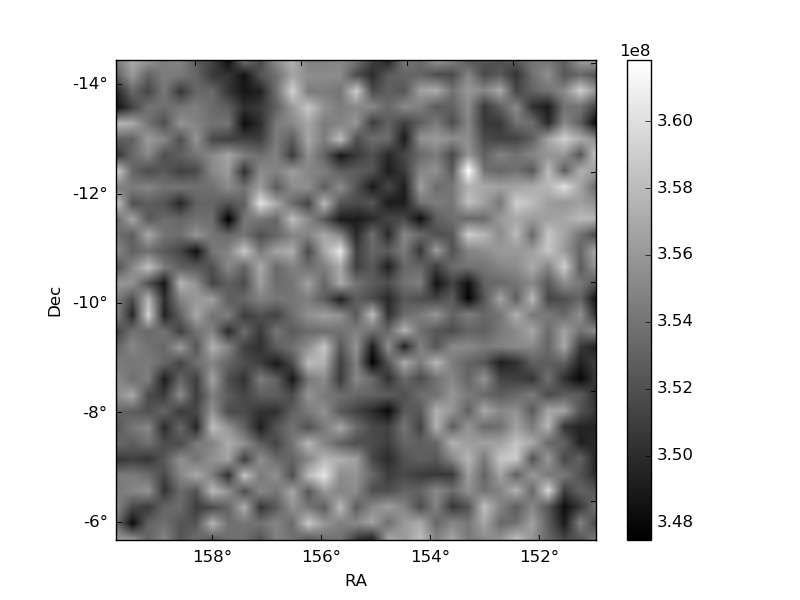
Histogram calculated using DETX and DETY for each event in the final _common_clean file
| Quadrant A | 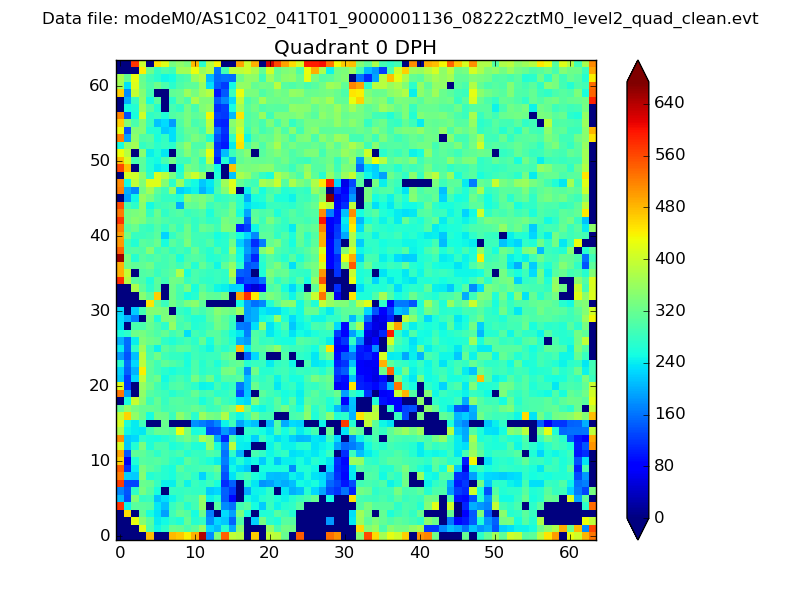 |
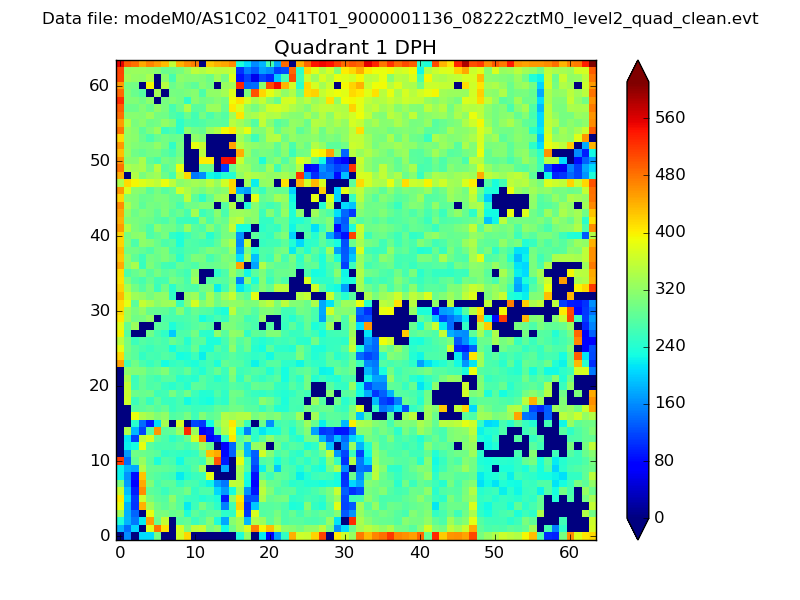 |
Quadrant B |
|---|---|---|---|
| Quadrant D | 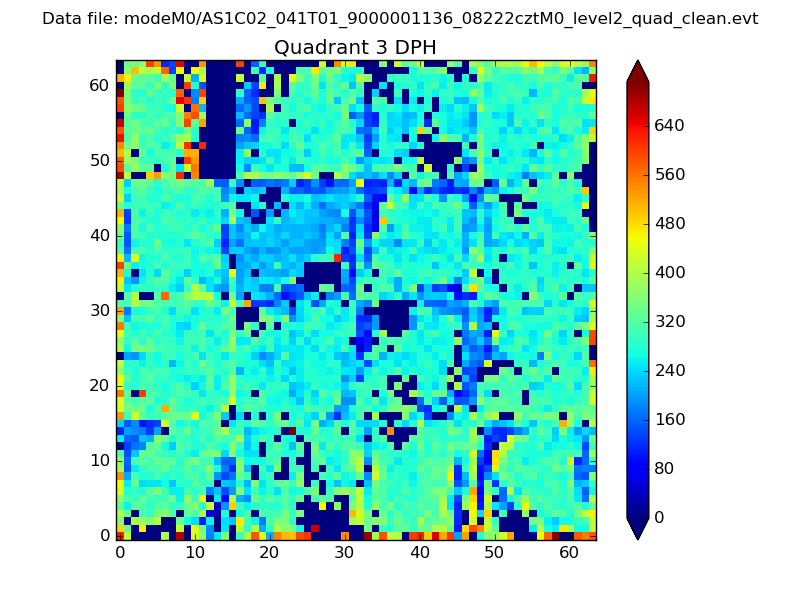 |
 |
Quadrant C |
| Plot type | Count rate plots | Images |
|---|---|---|
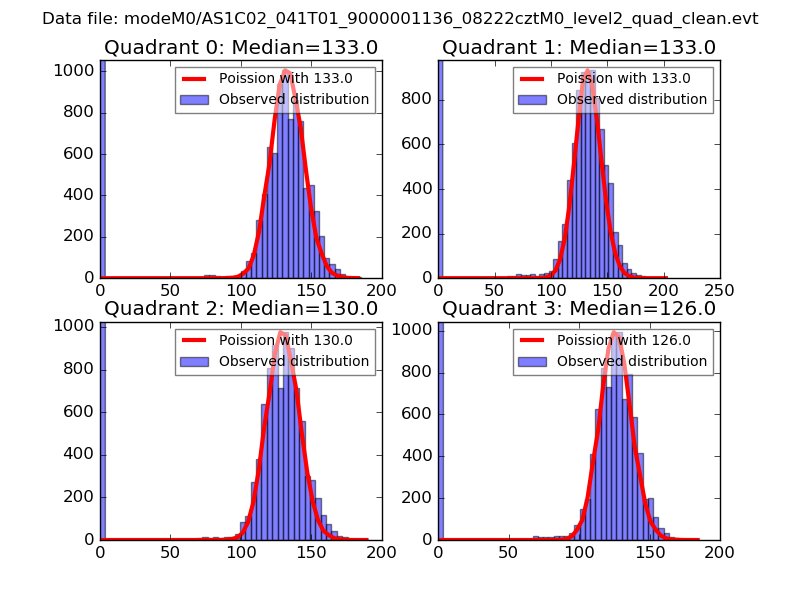
| Comparison with Poisson distribution Blue bars denote a histogram of data divided into 1 sec bins. Red curve is a Poisson curve with rate = median count rate of data. |
 |
 |
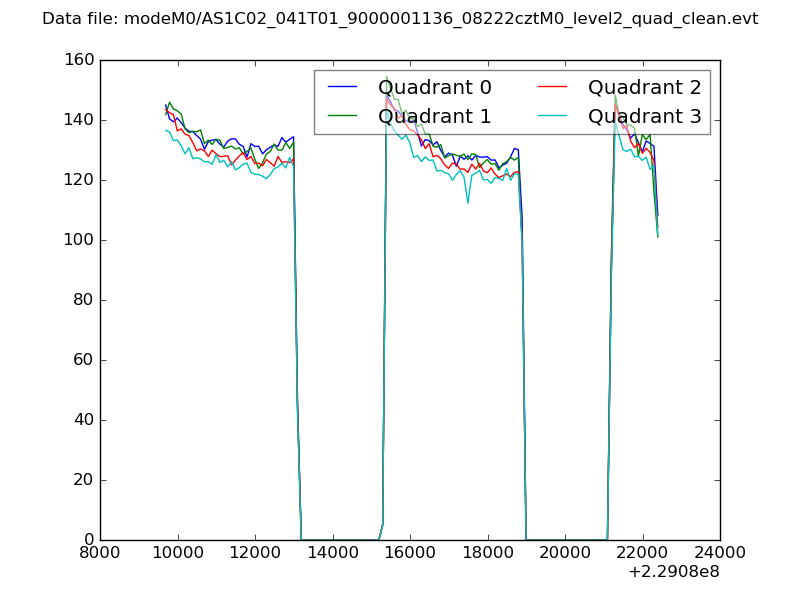
| Quadrant-wise count rates Data is divided into 100 sec bins |
 |
|
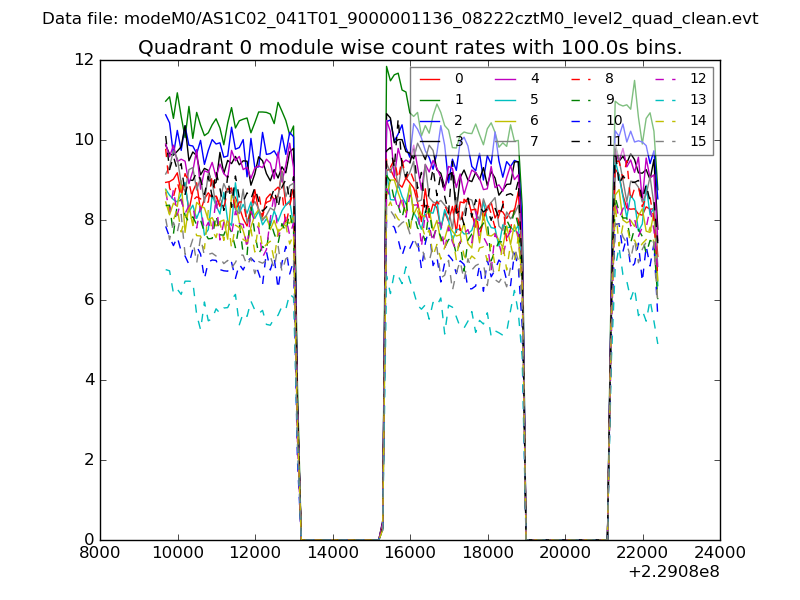
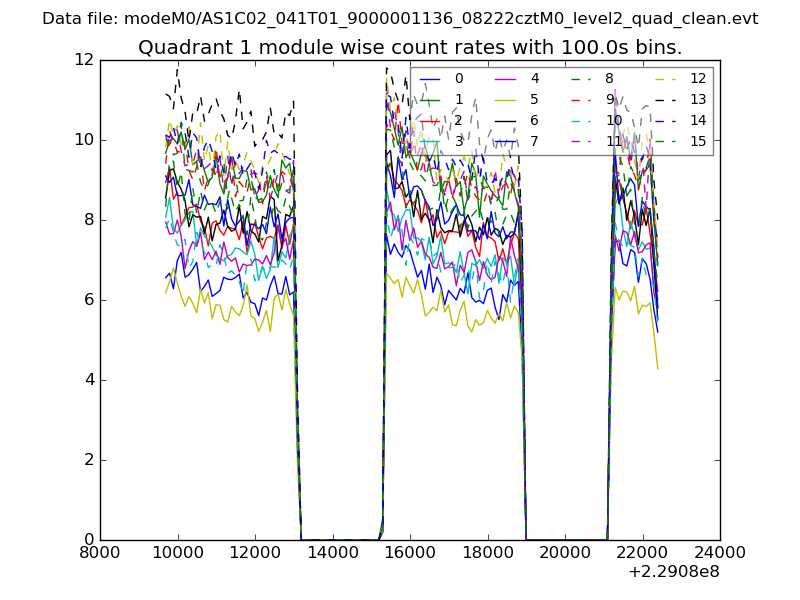
| Module-wise count rates for Quadrant A Data is divided into 100 sec bins |
 |
 |
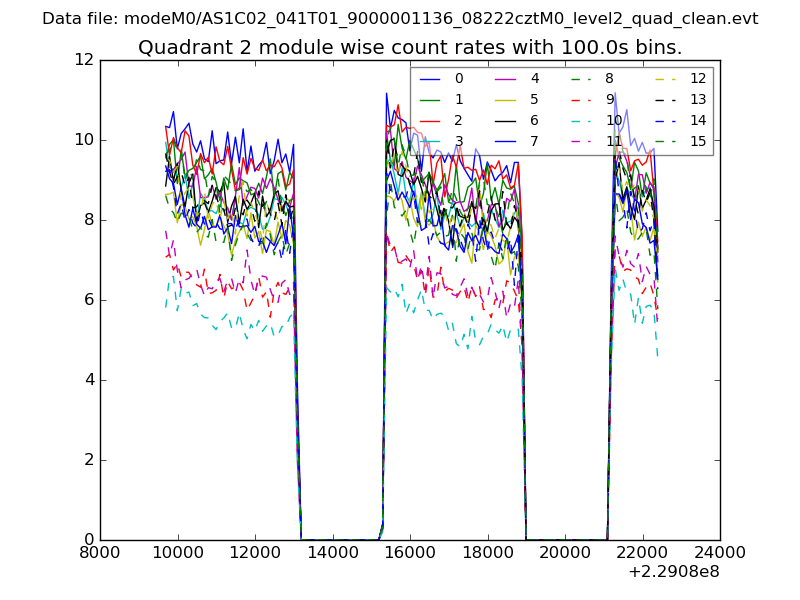
| Module-wise count rates for Quadrant B Data is divided into 100 sec bins |
 |
 |
| Module-wise count rates for Quadrant C Data is divided into 100 sec bins |
 |
 |
| Module-wise count rates for Quadrant D Data is divided into 100 sec bins |
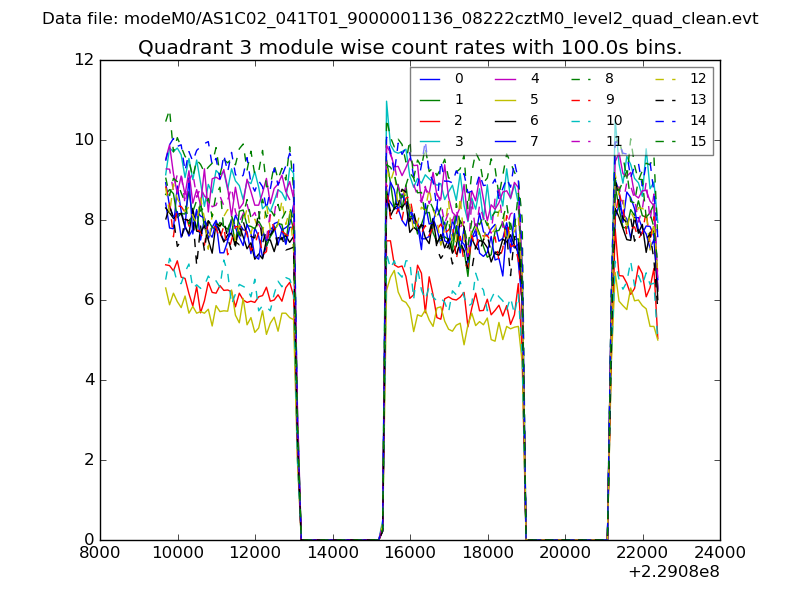 |
 |
| Parameter | Plot |
|---|---|
| CZT HV Monitor | 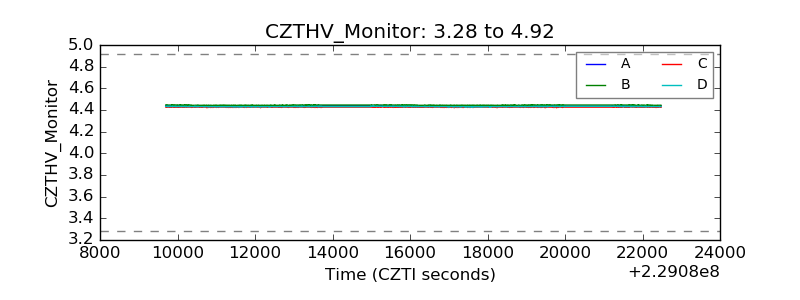 |
| D_VDD | 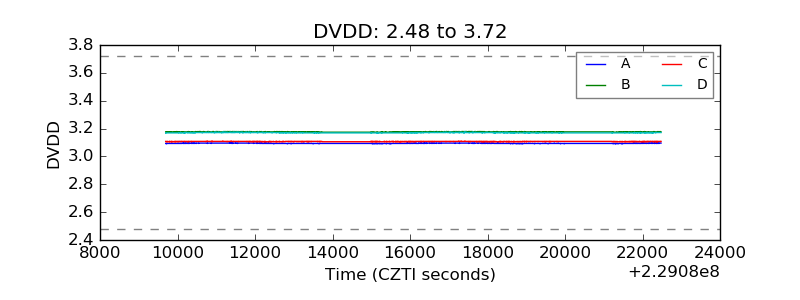 |
| Temperature 1 | 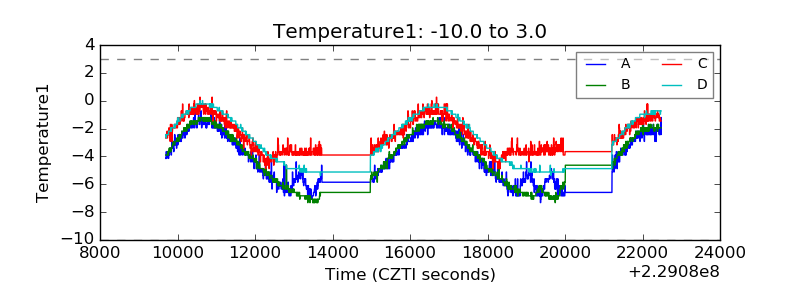 |
| Veto HV Monitor | 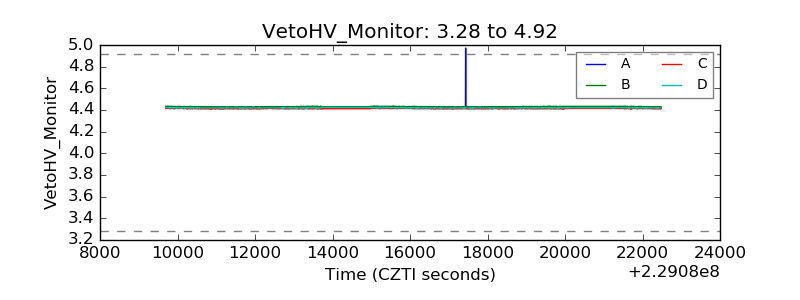 |
| Veto LLD | 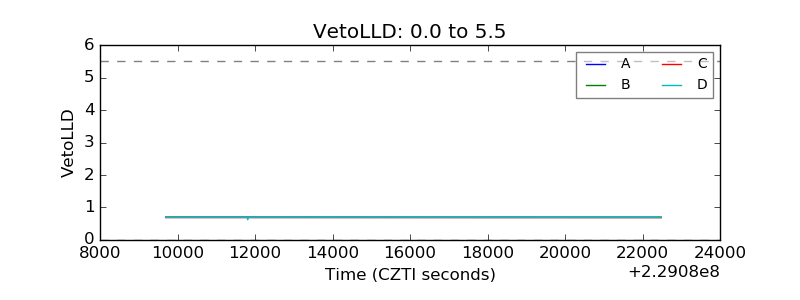 |
| Alpha Counter | 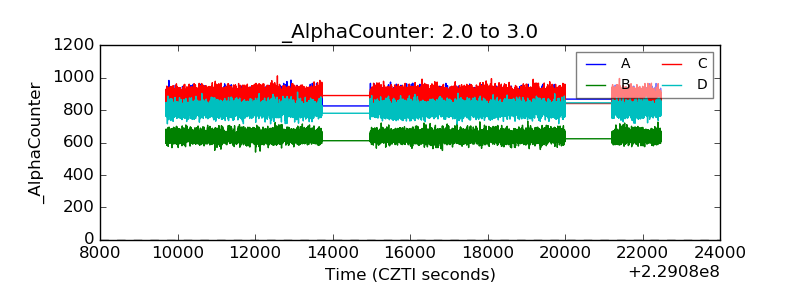 |
| _CPM_Rate | 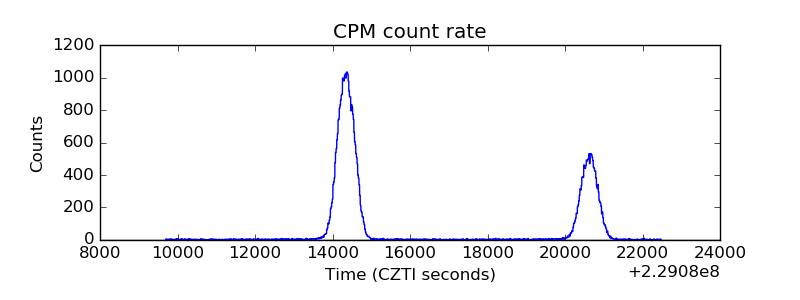 |
| CZT Counter | 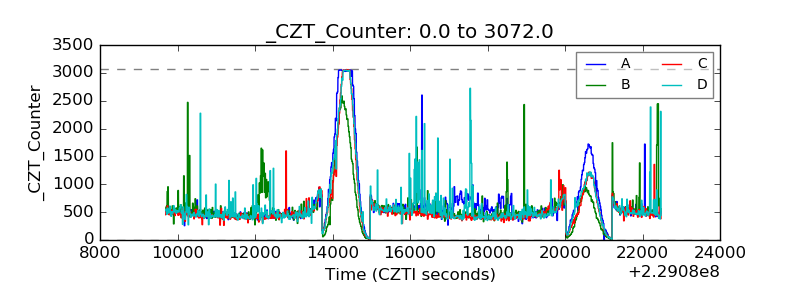 |
| +2.5 Volts monitor | 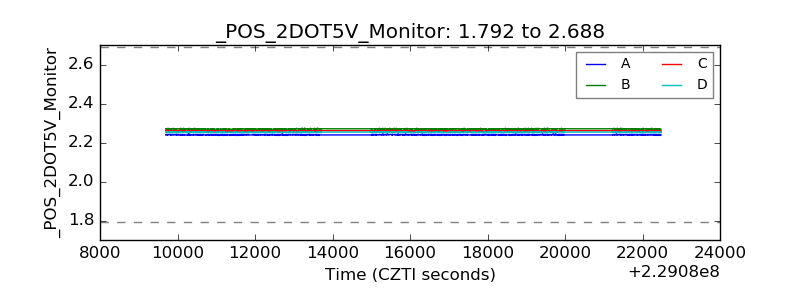 |
| +5 Volts monitor |  |
| _ROLL_ROT | 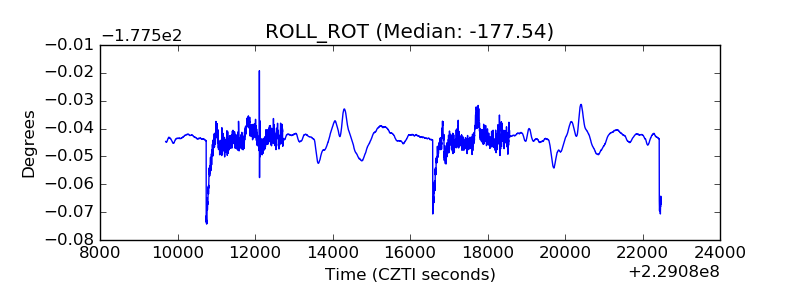 |
| _Roll_DEC | 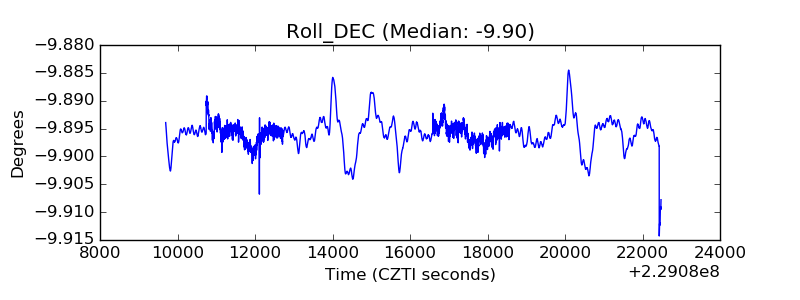 |
| _Roll_RA | 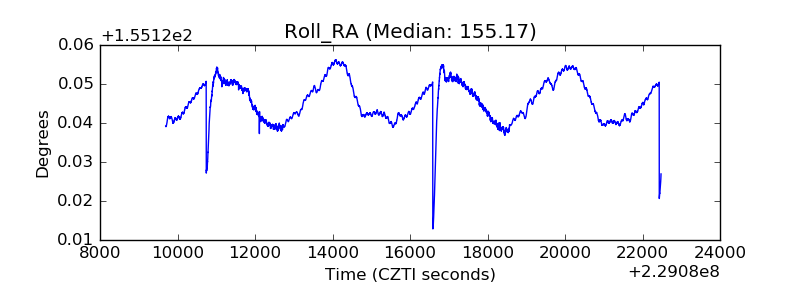 |
| Veto Counter | 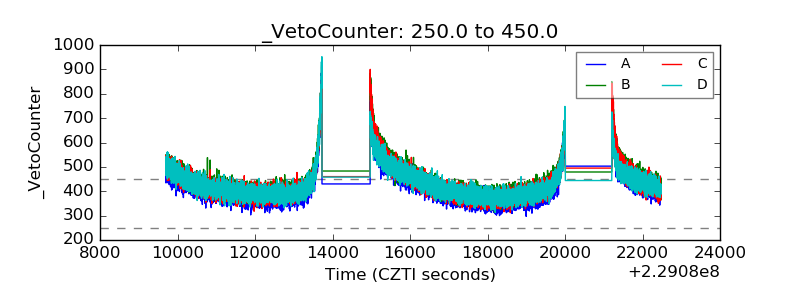 |