| Param | Original file | Final file |
|---|---|---|
| Filename | modeM0/AS1C02_041T01_9000001136_08223cztM0_level2.evt | modeM0/AS1C02_041T01_9000001136_08223cztM0_level2_quad_clean.evt |
| Size (bytes) | 435,363,840 | 92,007,360 |
| Size | 415.2 MB | 87.7 MB |
| Events in quadrant A | 3,051,764 | 595,598 |
| Events in quadrant B | 3,325,698 | 596,411 |
| Events in quadrant C | 3,081,470 | 582,749 |
| Events in quadrant D | 3,291,755 | 566,153 |
| Mode M9 | |||
|---|---|---|---|
| Quadrant | BADHDUFLAG | Total packets | Discarded packets |
| A | 0 | 10 | 0 |
| B | 0 | 10 | 0 |
| C | 0 | 10 | 0 |
| D | 0 | 10 | 0 |
| Mode SS | |||
|---|---|---|---|
| Quadrant | BADHDUFLAG | Total packets | Discarded packets |
| A | 0 | 128 | 0 |
| B | 0 | 128 | 0 |
| C | 0 | 128 | 0 |
| D | 0 | 128 | 0 |
| Mode M0 | |||
|---|---|---|---|
| Quadrant | BADHDUFLAG | Total packets | Discarded packets |
| A | 0 | 13328 | 2 |
| B | 0 | 13998 | 1 |
| C | 0 | 13563 | 1 |
| D | 0 | 14281 | 1 |
| Quadrant | Total seconds | Saturated seconds | Saturation percentage |
|---|---|---|---|
| A | 6389 | 118 | 1.846924% |
| B | 6389 | 173 | 2.707779% |
| C | 6389 | 70 | 1.095633% |
| D | 6389 | 130 | 2.034747% |
Noise dominated data is calculated using 1-second bins in cleaned event files. If a bin has >2000 counts, and if more than 50% of those come from <1% of pixels, then it is considered to be noise-dominated and hence unusable.
| Quadrant | # 1 sec bins | Bins with >0 counts | Bins with >2000 counts | High rate bins dominated by noise | Noise dominated (total time) | Noise dominated (detector-on time) | Marked lightcurve |
|---|---|---|---|---|---|---|---|
| A | 7324 | 6389 | 5 | 5 | 0.07% | 0.08% | 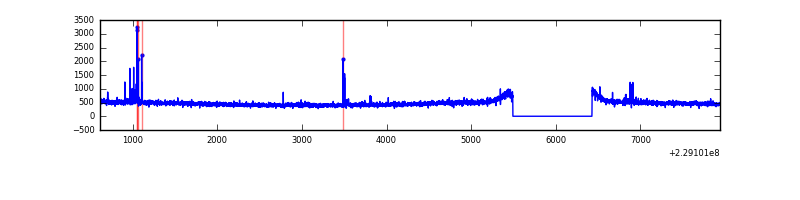 |
| B | 7324 | 6389 | 43 | 43 | 0.59% | 0.67% | 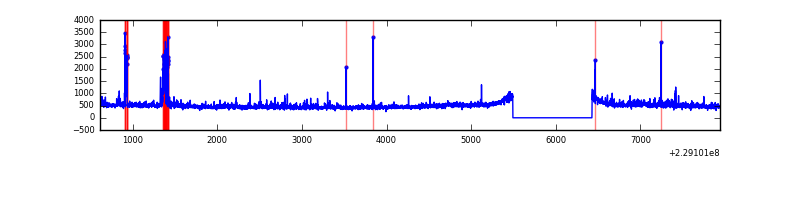 |
| C | 7324 | 6390 | 0 | 0 | 0.00% | 0.00% | 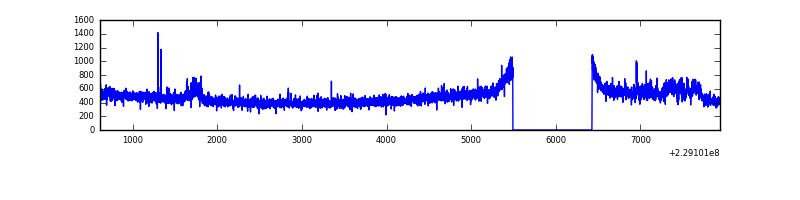 |
| D | 7324 | 6390 | 47 | 47 | 0.64% | 0.74% | 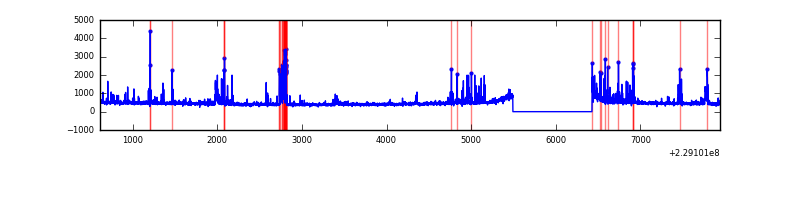 |
Top three noisy pixels from each quadrant. If the there are fewer than three noisy pixels in the level2.evt file, extra rows are filled as -1
| Pixel properties | Quadrant properties | ||||||
|---|---|---|---|---|---|---|---|
| Quadrant | DetID | PixID | Counts | Sigma | Mean | Median | Sigma |
| A | 5 | 16 | 48267 | 294.16 | 780 | 761 | 161.5 |
| A | 0 | 226 | 7400 | 41.11 | 780 | 761 | 161.5 |
| A | 12 | 194 | 7108 | 39.3 | 780 | 761 | 161.5 |
| B | 0 | 213 | 105084 | 702.83 | 772 | 755 | 148.4 |
| B | 11 | 51 | 79425 | 529.97 | 772 | 755 | 148.4 |
| B | 0 | 214 | 54367 | 361.17 | 772 | 755 | 148.4 |
| C | 9 | 68 | 166550 | 954.5 | 742 | 747 | 173.7 |
| C | 1 | 16 | 21415 | 118.98 | 742 | 747 | 173.7 |
| C | 13 | 61 | 5671 | 28.35 | 742 | 747 | 173.7 |
| D | 13 | 105 | 190113 | 1020.52 | 751 | 729 | 185.6 |
| D | 1 | 52 | 175192 | 940.11 | 751 | 729 | 185.6 |
| D | 1 | 7 | 39063 | 206.56 | 751 | 729 | 185.6 |
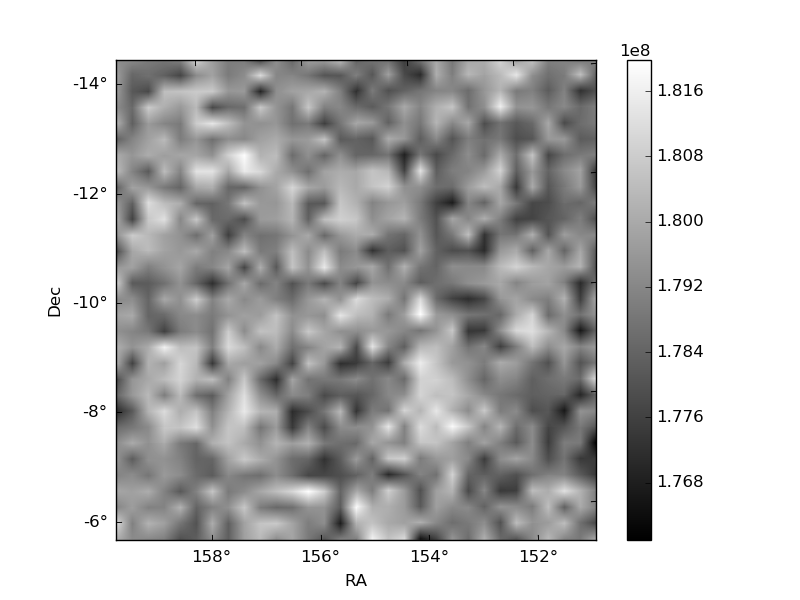
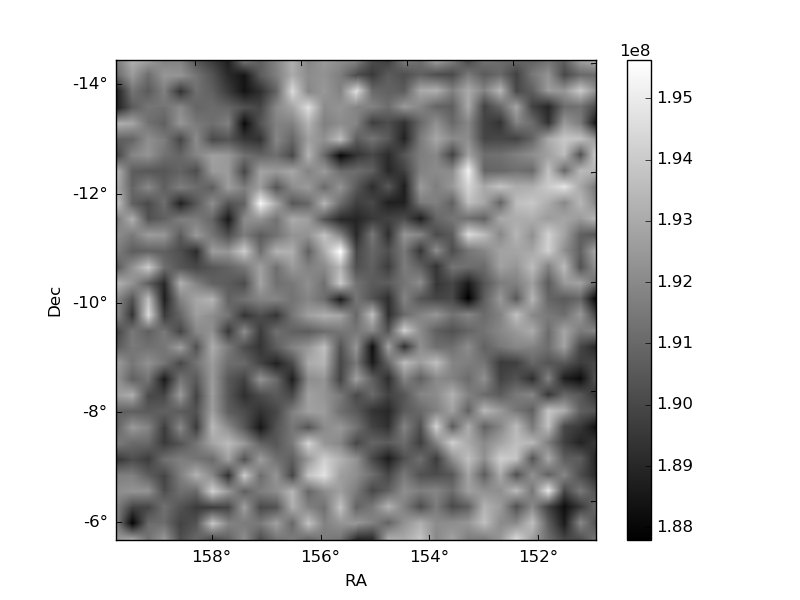
Histogram calculated using DETX and DETY for each event in the final _common_clean file
| Quadrant A | 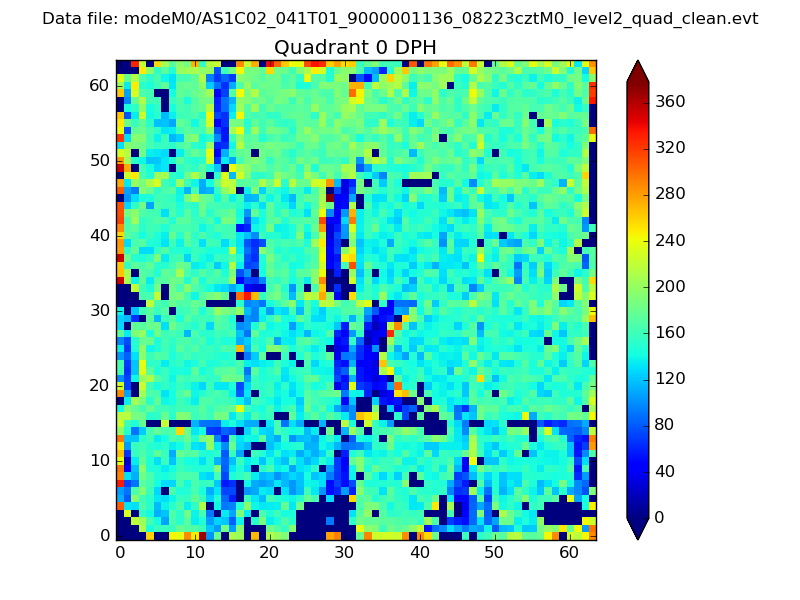 |
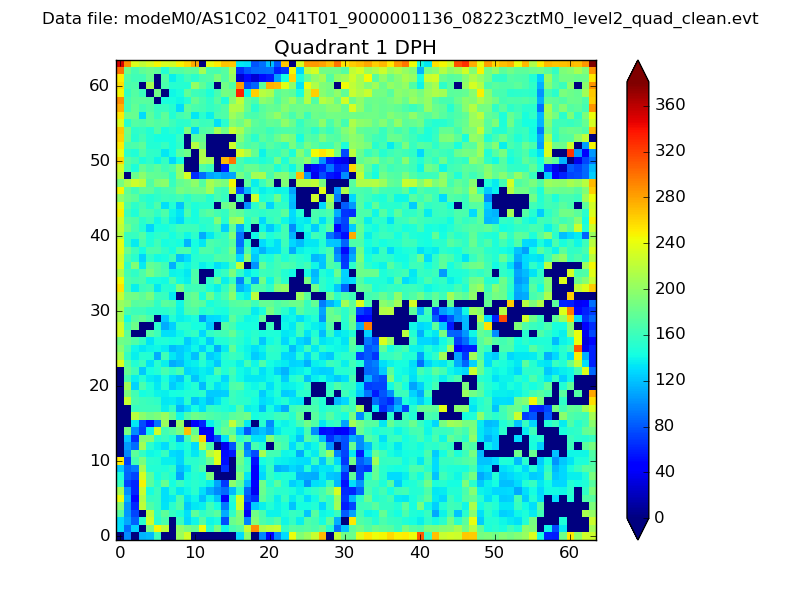 |
Quadrant B |
|---|---|---|---|
| Quadrant D | 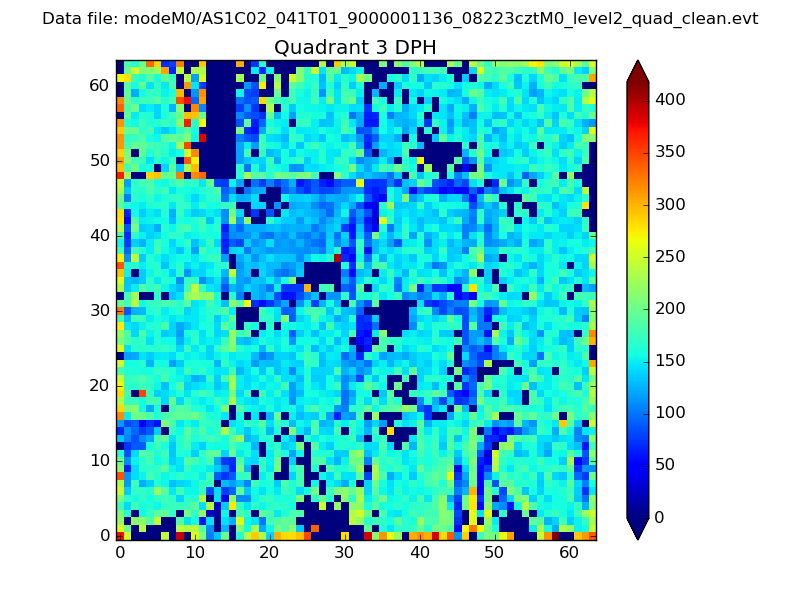 |
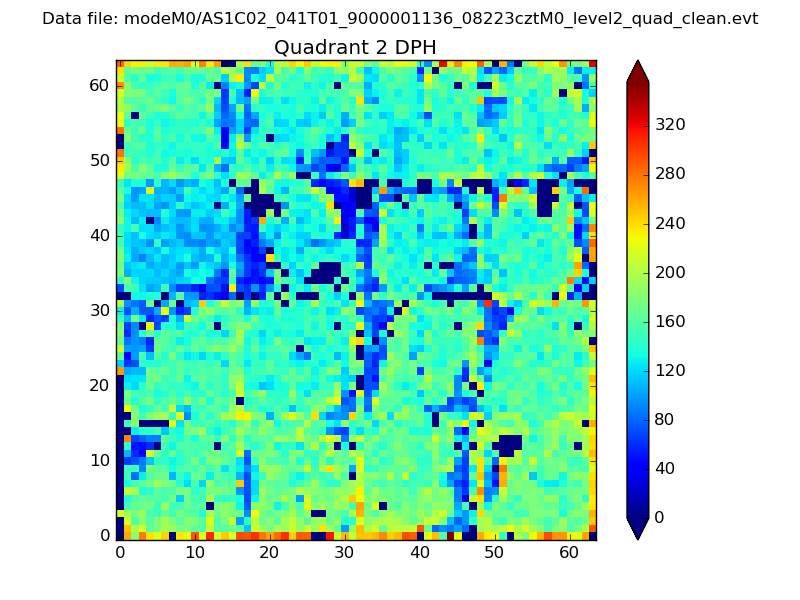 |
Quadrant C |
| Plot type | Count rate plots | Images |
|---|---|---|
| Comparison with Poisson distribution Blue bars denote a histogram of data divided into 1 sec bins. Red curve is a Poisson curve with rate = median count rate of data. |
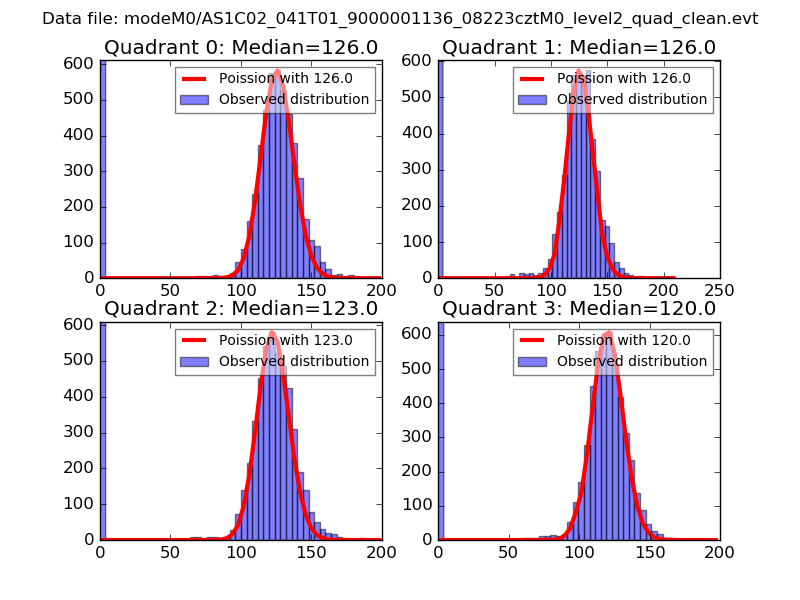 |
 |
| Quadrant-wise count rates Data is divided into 100 sec bins |
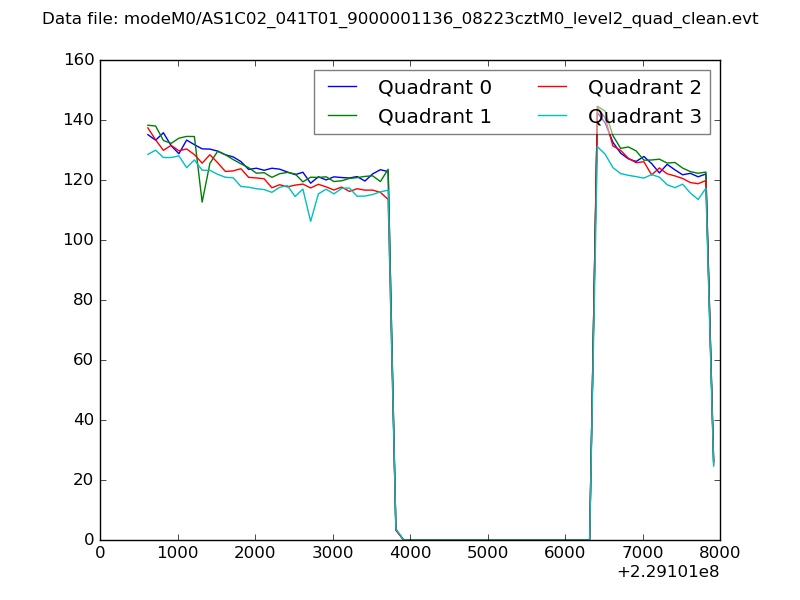 |
|
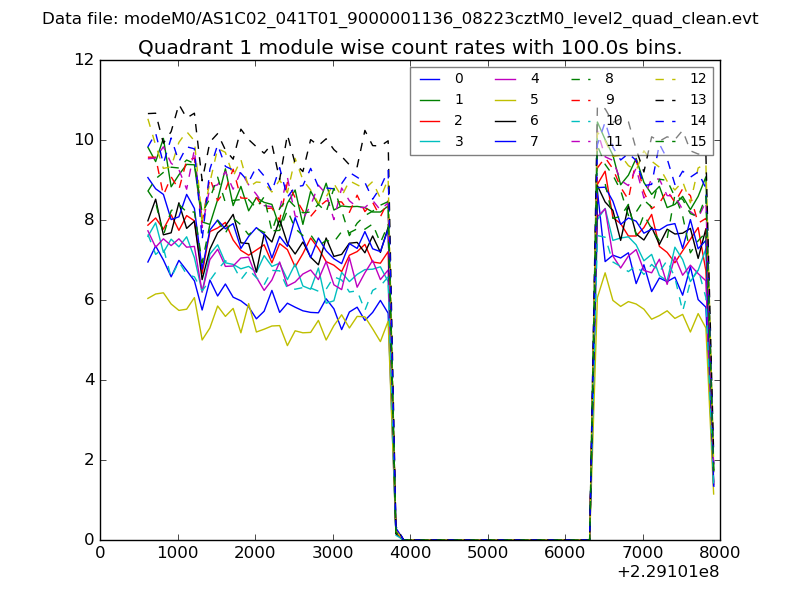
| Module-wise count rates for Quadrant A Data is divided into 100 sec bins |
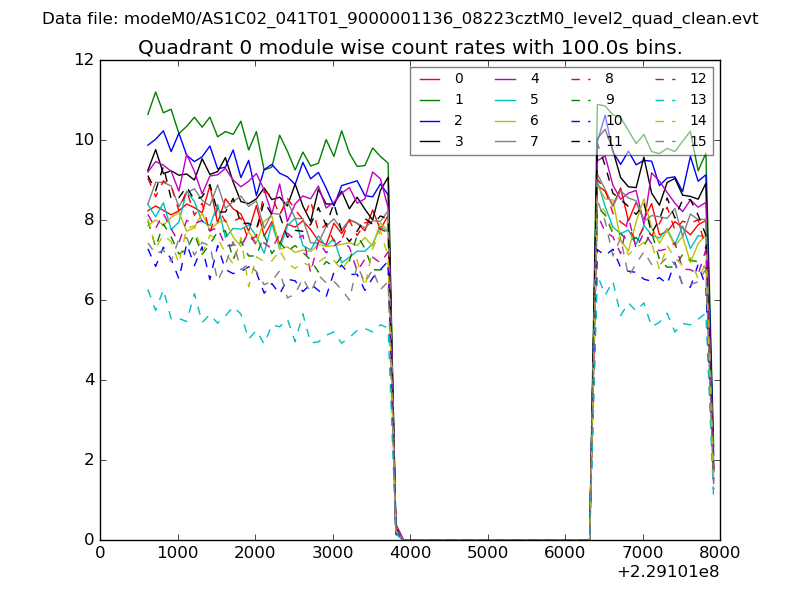 |
 |
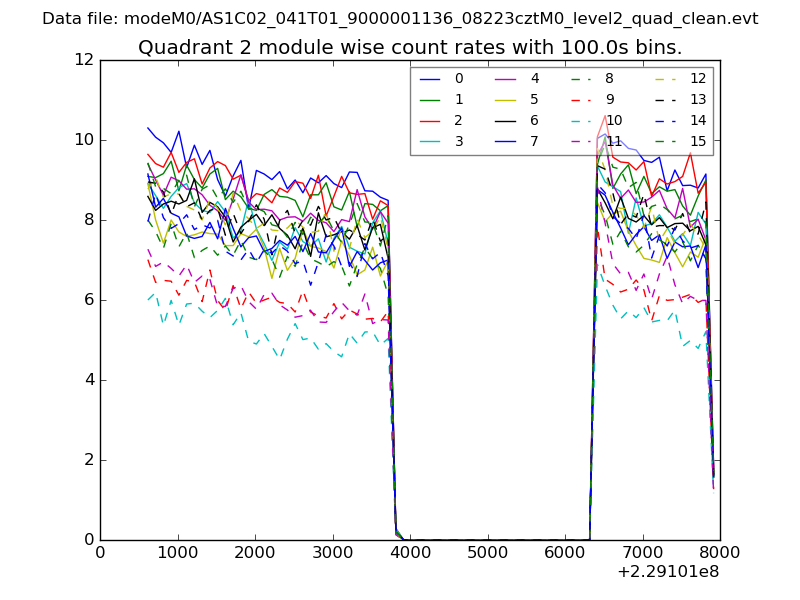
| Module-wise count rates for Quadrant B Data is divided into 100 sec bins |
 |
 |
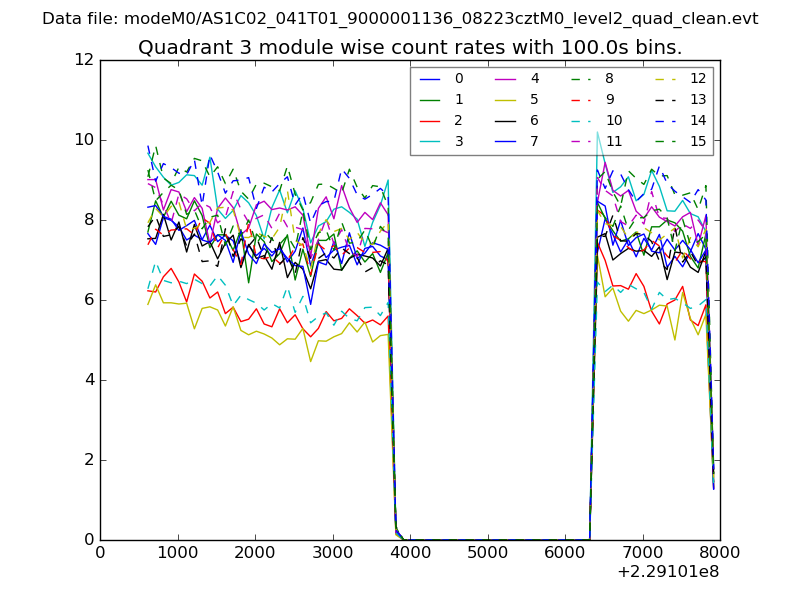
| Module-wise count rates for Quadrant C Data is divided into 100 sec bins |
 |
 |
| Module-wise count rates for Quadrant D Data is divided into 100 sec bins |
 |
 |
| Parameter | Plot |
|---|---|
| CZT HV Monitor | 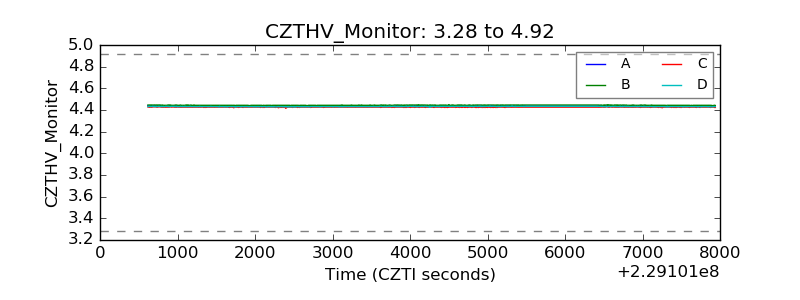 |
| D_VDD | 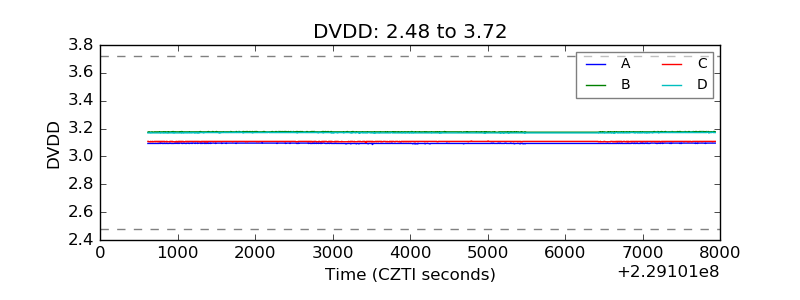 |
| Temperature 1 | 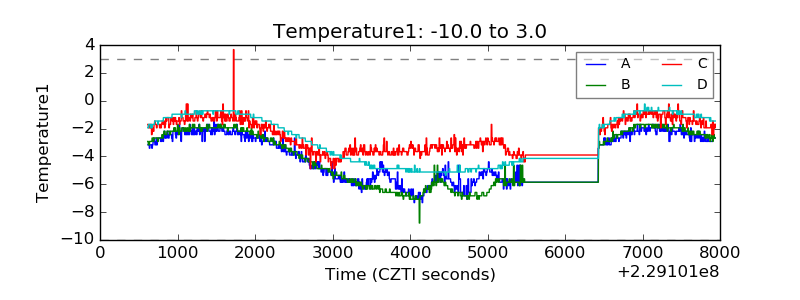 |
| Veto HV Monitor | 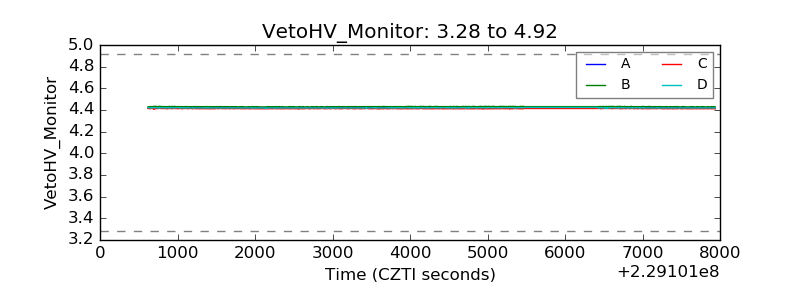 |
| Veto LLD | 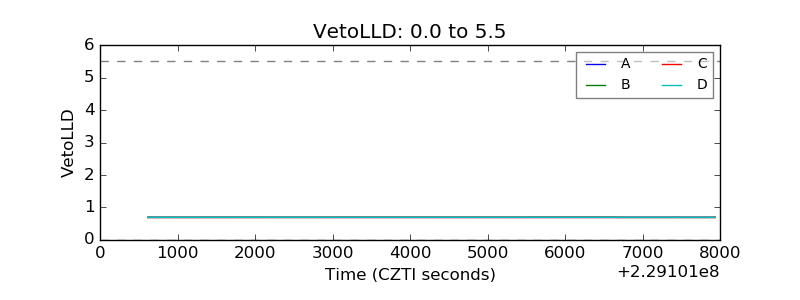 |
| Alpha Counter | 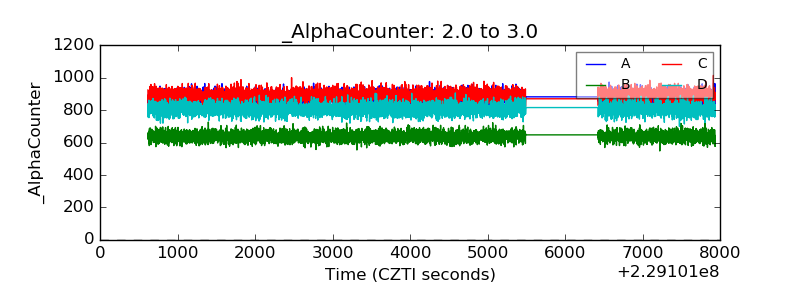 |
| _CPM_Rate | 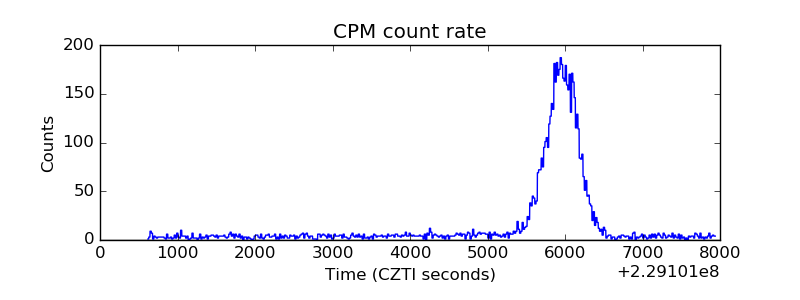 |
| CZT Counter |  |
| +2.5 Volts monitor |  |
| +5 Volts monitor |  |
| _ROLL_ROT | 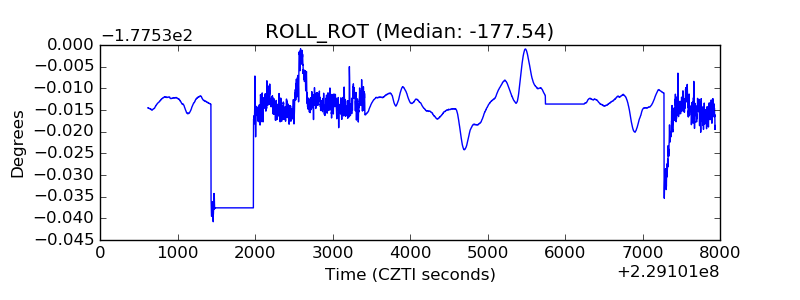 |
| _Roll_DEC | 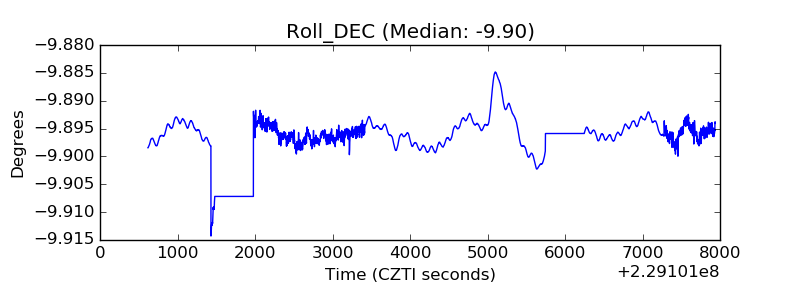 |
| _Roll_RA | 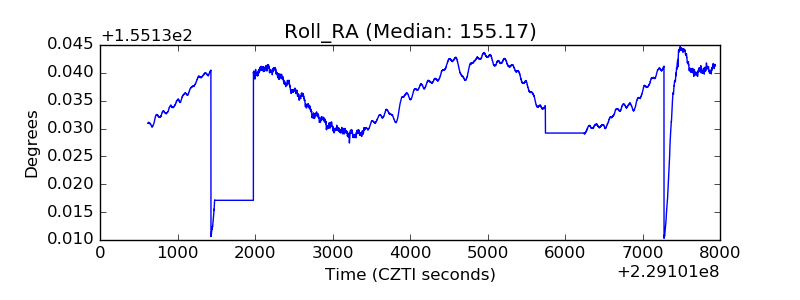 |
| Veto Counter | 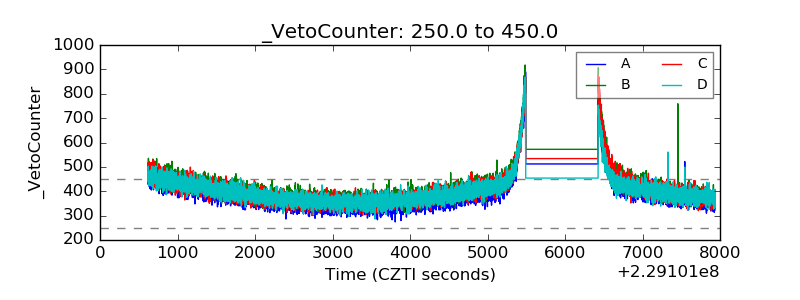 |