| Param | Original file | Final file |
|---|---|---|
| Filename | modeM0/AS1C02_041T01_9000001136_08225cztM0_level2.evt | modeM0/AS1C02_041T01_9000001136_08225cztM0_level2_quad_clean.evt |
| Size (bytes) | 486,826,560 | 96,056,640 |
| Size | 464.3 MB | 91.6 MB |
| Events in quadrant A | 3,567,623 | 610,355 |
| Events in quadrant B | 3,684,241 | 611,079 |
| Events in quadrant C | 3,495,383 | 599,680 |
| Events in quadrant D | 3,502,241 | 581,643 |
| Mode M9 | |||
|---|---|---|---|
| Quadrant | BADHDUFLAG | Total packets | Discarded packets |
| A | 0 | 3 | 0 |
| B | 0 | 3 | 0 |
| C | 0 | 3 | 0 |
| D | 0 | 3 | 0 |
| Mode SS | |||
|---|---|---|---|
| Quadrant | BADHDUFLAG | Total packets | Discarded packets |
| A | 0 | 148 | 0 |
| B | 0 | 148 | 0 |
| C | 0 | 148 | 0 |
| D | 0 | 148 | 0 |
| Mode M0 | |||
|---|---|---|---|
| Quadrant | BADHDUFLAG | Total packets | Discarded packets |
| A | 0 | 15616 | 2 |
| B | 0 | 15808 | 1 |
| C | 0 | 15202 | 1 |
| D | 0 | 15678 | 1 |
| Quadrant | Total seconds | Saturated seconds | Saturation percentage |
|---|---|---|---|
| A | 7270 | 55 | 0.756534% |
| B | 7270 | 88 | 1.210454% |
| C | 7270 | 16 | 0.220083% |
| D | 7270 | 45 | 0.618982% |
Noise dominated data is calculated using 1-second bins in cleaned event files. If a bin has >2000 counts, and if more than 50% of those come from <1% of pixels, then it is considered to be noise-dominated and hence unusable.
| Quadrant | # 1 sec bins | Bins with >0 counts | Bins with >2000 counts | High rate bins dominated by noise | Noise dominated (total time) | Noise dominated (detector-on time) | Marked lightcurve |
|---|---|---|---|---|---|---|---|
| A | 7570 | 7271 | 25 | 25 | 0.33% | 0.34% | 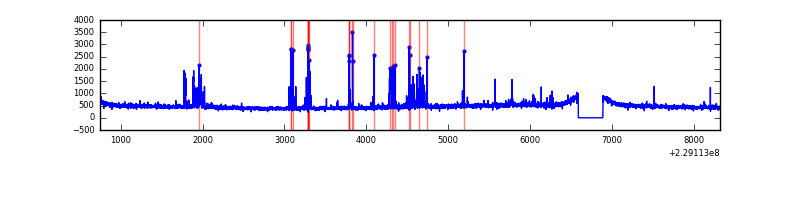 |
| B | 7570 | 7271 | 22 | 22 | 0.29% | 0.30% | 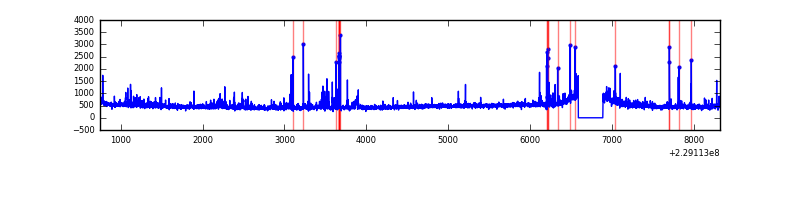 |
| C | 7570 | 7271 | 0 | 0 | 0.00% | 0.00% | 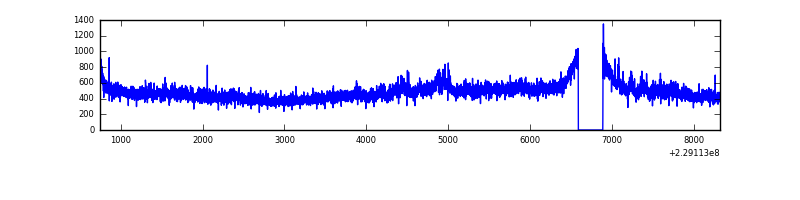 |
| D | 7570 | 7271 | 23 | 23 | 0.30% | 0.32% | 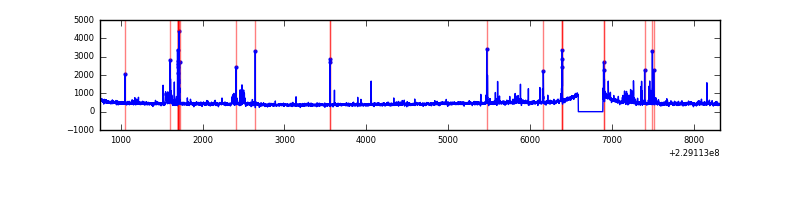 |
Top three noisy pixels from each quadrant. If the there are fewer than three noisy pixels in the level2.evt file, extra rows are filled as -1
| Pixel properties | Quadrant properties | ||||||
|---|---|---|---|---|---|---|---|
| Quadrant | DetID | PixID | Counts | Sigma | Mean | Median | Sigma |
| A | 5 | 16 | 131784 | 731.57 | 862 | 843 | 179.0 |
| A | 6 | 16 | 117686 | 652.8 | 862 | 843 | 179.0 |
| A | 0 | 226 | 8270 | 41.49 | 862 | 843 | 179.0 |
| B | 10 | 16 | 148283 | 891.76 | 860 | 841 | 165.3 |
| B | 11 | 51 | 117202 | 703.78 | 860 | 841 | 165.3 |
| B | 0 | 214 | 34152 | 201.47 | 860 | 841 | 165.3 |
| C | 9 | 68 | 218245 | 1112.17 | 829 | 833 | 195.5 |
| C | 1 | 16 | 44907 | 225.46 | 829 | 833 | 195.5 |
| C | 13 | 61 | 6402 | 28.49 | 829 | 833 | 195.5 |
| D | 2 | 136 | 79933 | 384.71 | 833 | 809 | 205.7 |
| D | 12 | 233 | 66006 | 316.99 | 833 | 809 | 205.7 |
| D | 8 | 230 | 47862 | 228.78 | 833 | 809 | 205.7 |
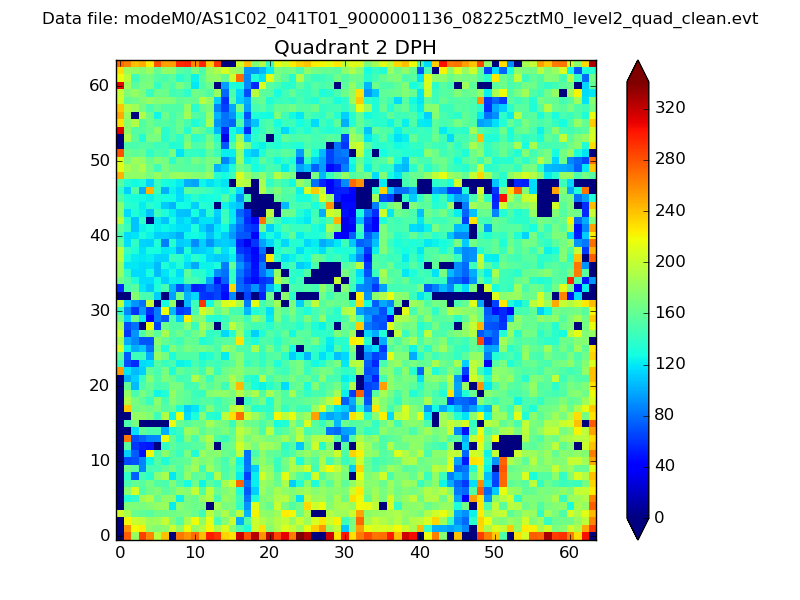
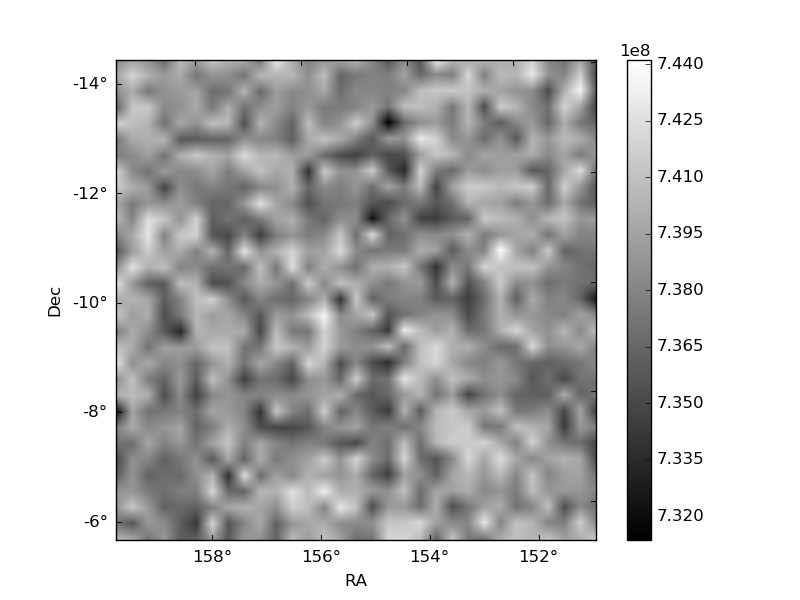
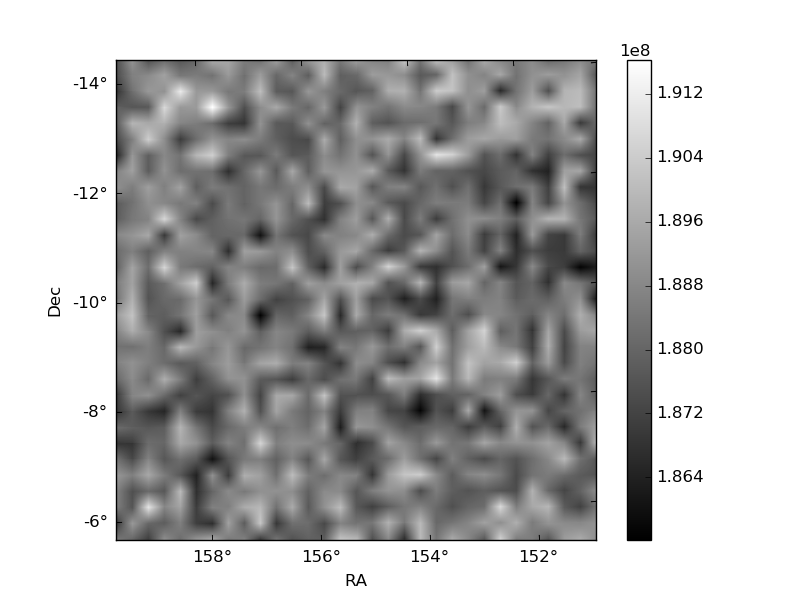
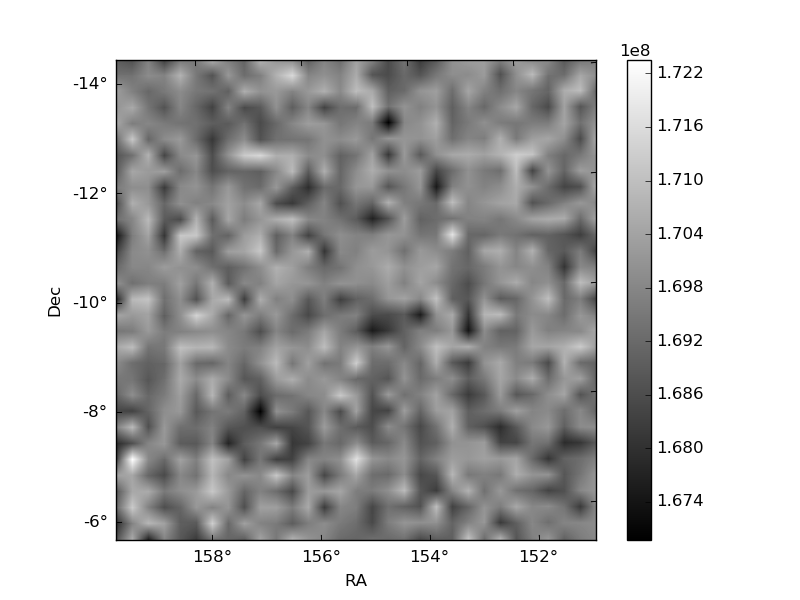
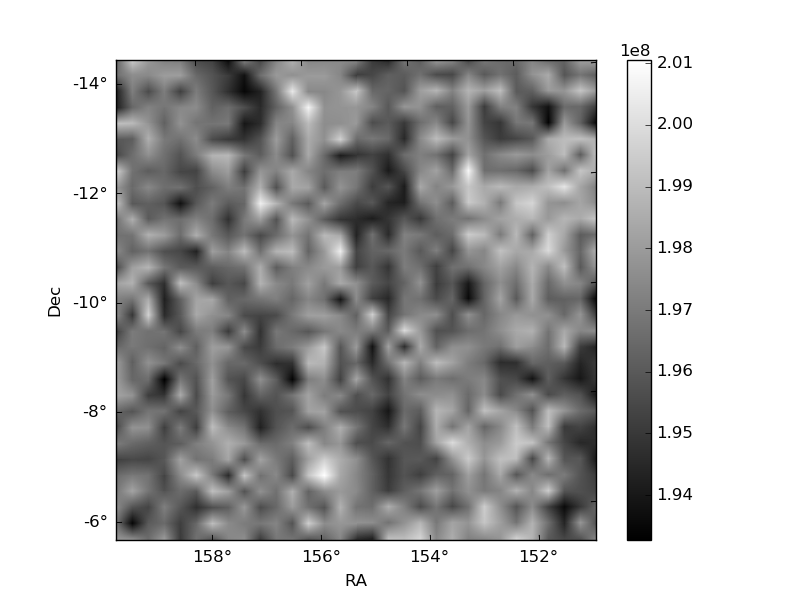
Histogram calculated using DETX and DETY for each event in the final _common_clean file
| Quadrant A | 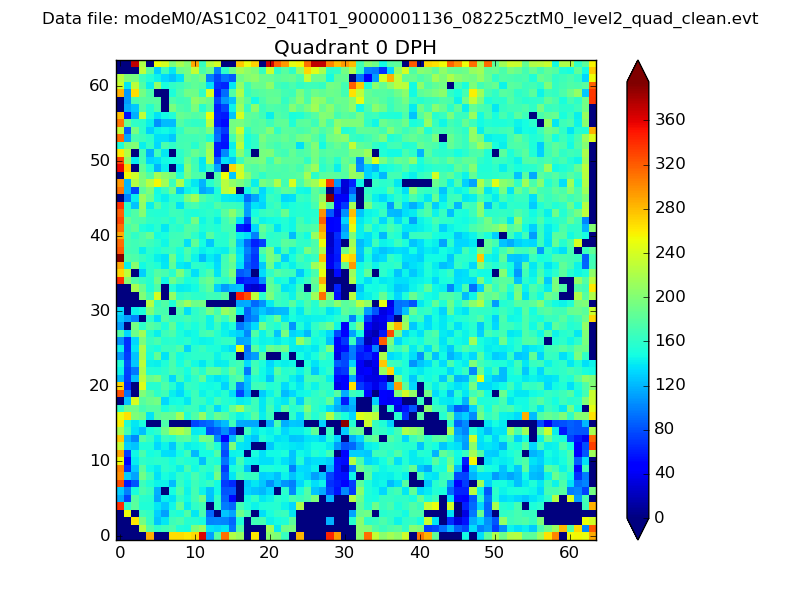 |
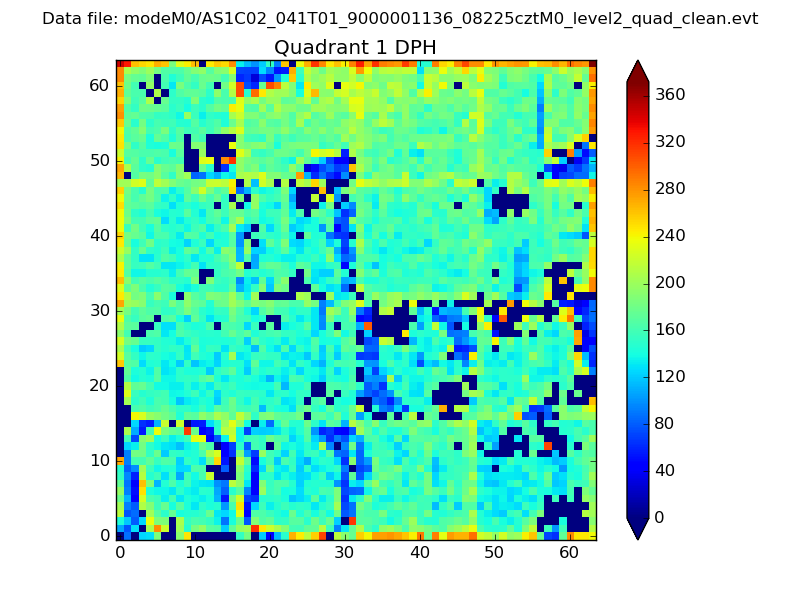 |
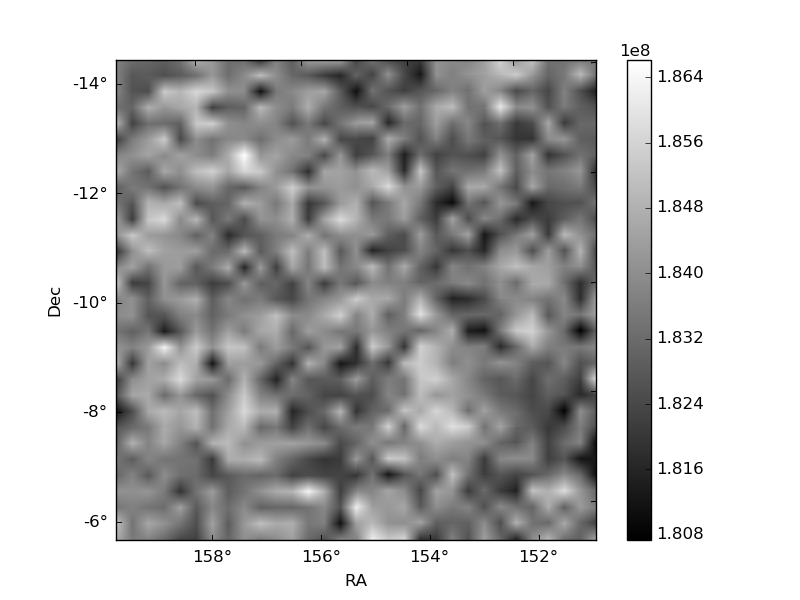
Quadrant B |
|---|---|---|---|
| Quadrant D | 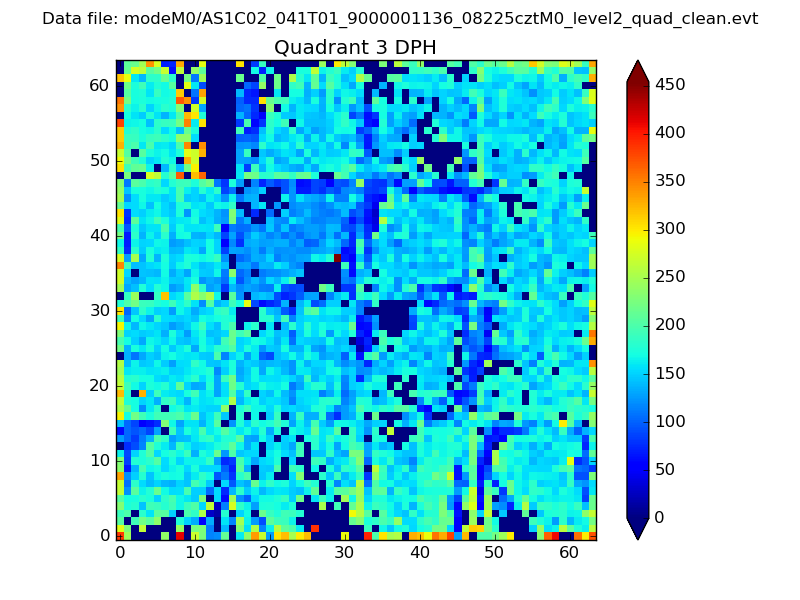 |
 |
Quadrant C |
| Plot type | Count rate plots | Images |
|---|---|---|
| Comparison with Poisson distribution Blue bars denote a histogram of data divided into 1 sec bins. Red curve is a Poisson curve with rate = median count rate of data. |
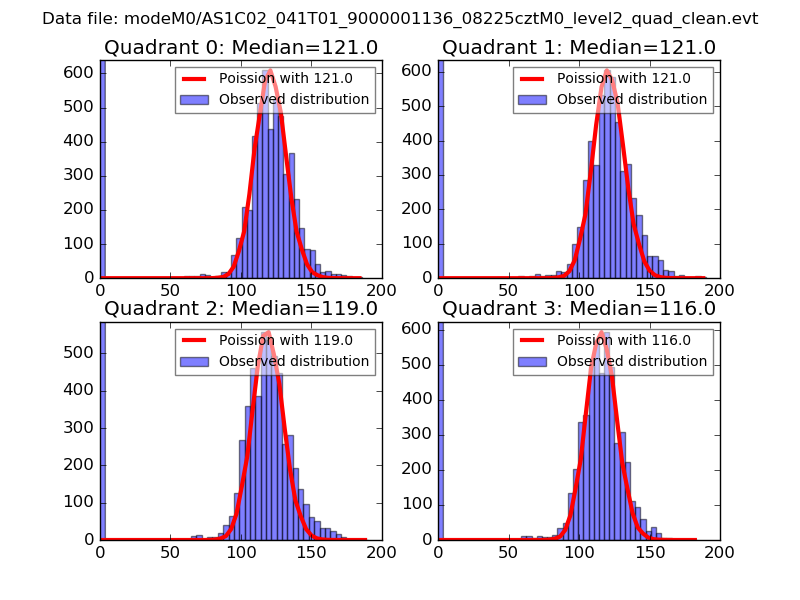 |
 |
| Quadrant-wise count rates Data is divided into 100 sec bins |
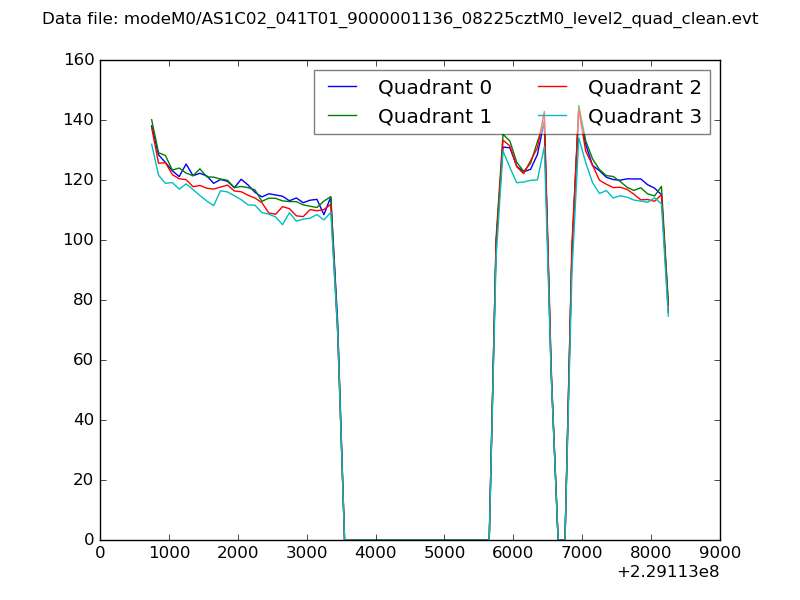 |
|
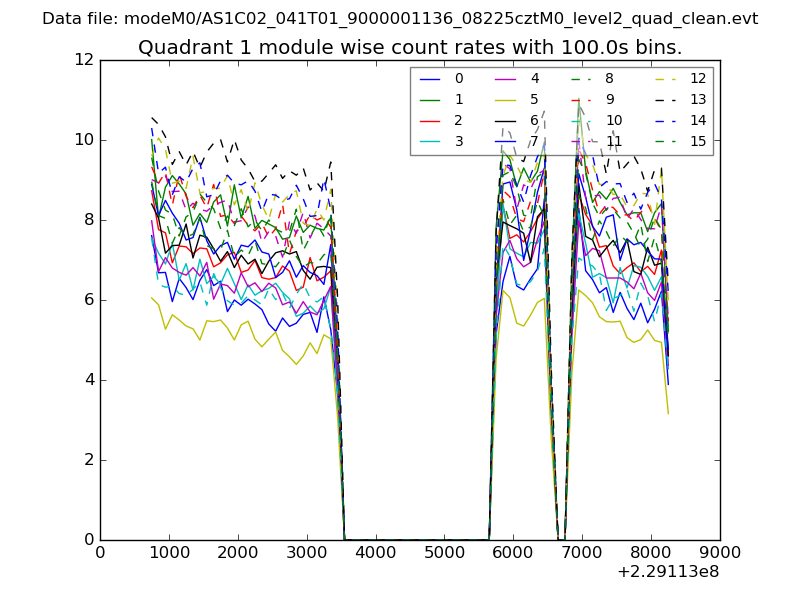
| Module-wise count rates for Quadrant A Data is divided into 100 sec bins |
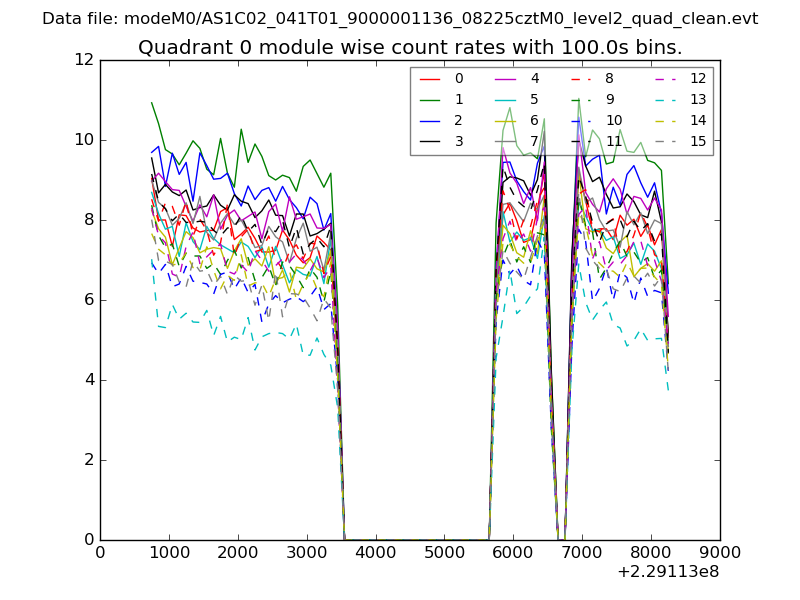 |
 |
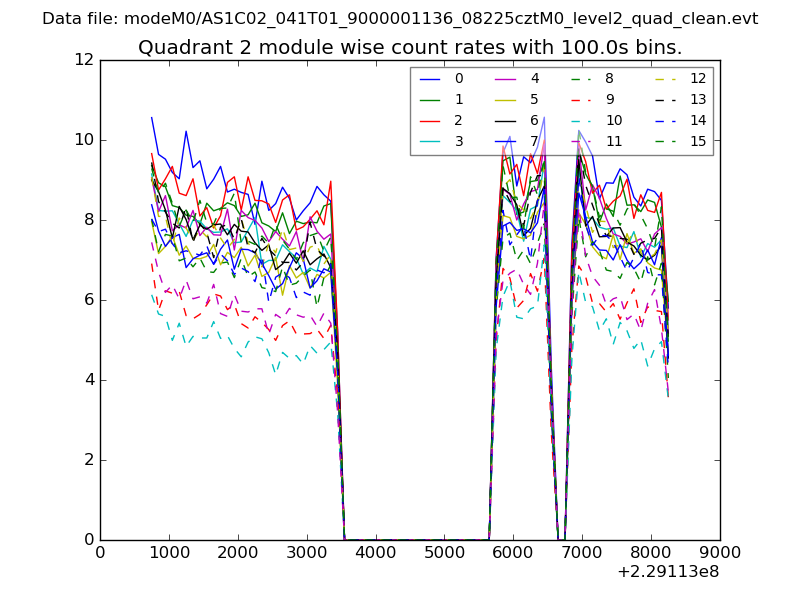
| Module-wise count rates for Quadrant B Data is divided into 100 sec bins |
 |
 |
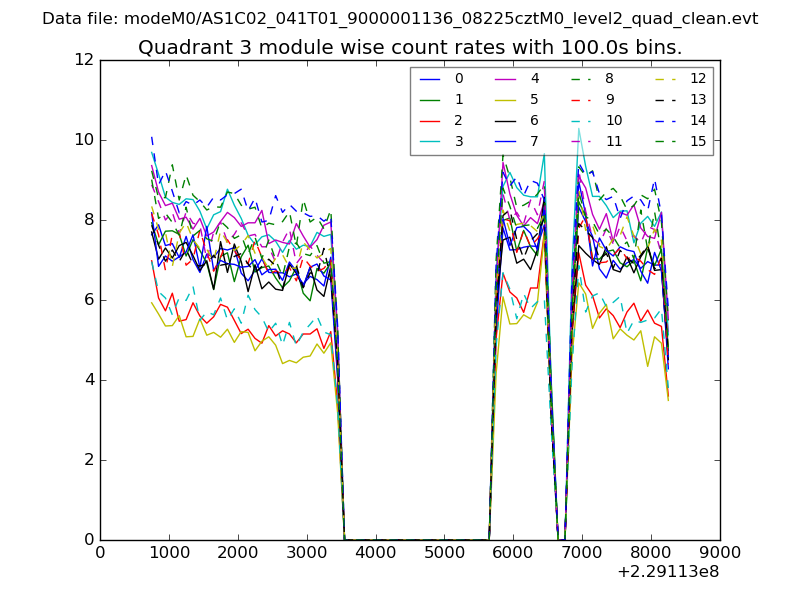
| Module-wise count rates for Quadrant C Data is divided into 100 sec bins |
 |
 |
| Module-wise count rates for Quadrant D Data is divided into 100 sec bins |
 |
 |
| Parameter | Plot |
|---|---|
| CZT HV Monitor | 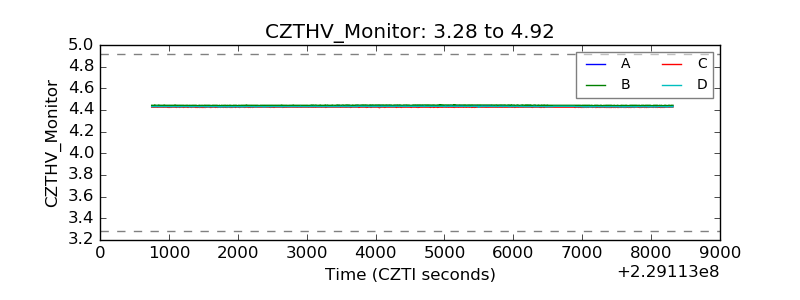 |
| D_VDD | 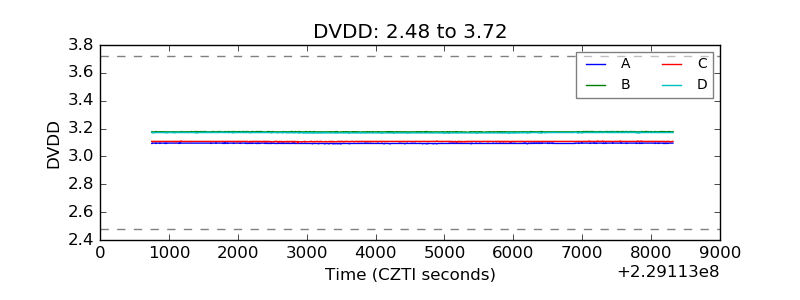 |
| Temperature 1 | 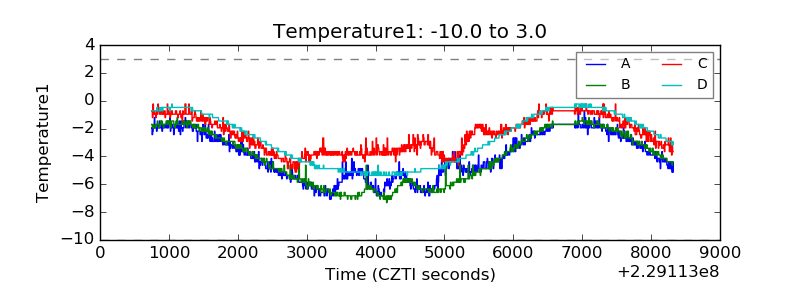 |
| Veto HV Monitor | 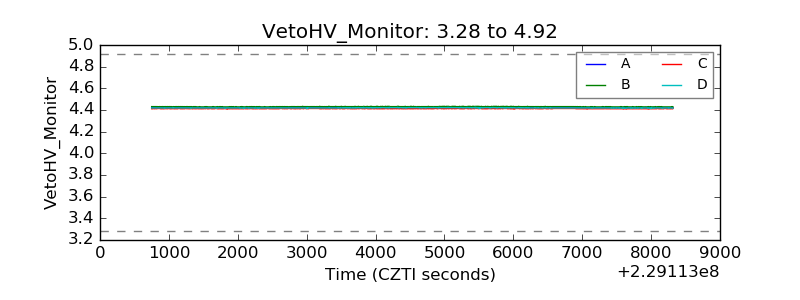 |
| Veto LLD | 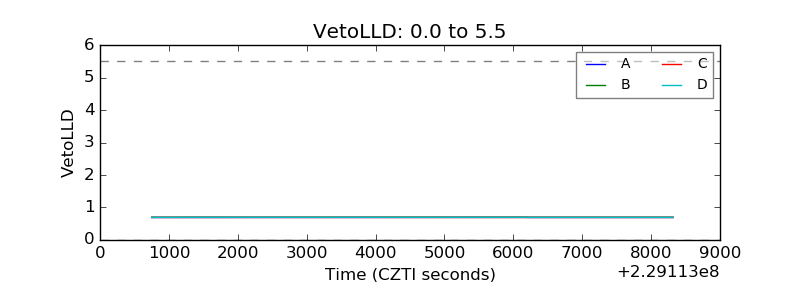 |
| Alpha Counter | 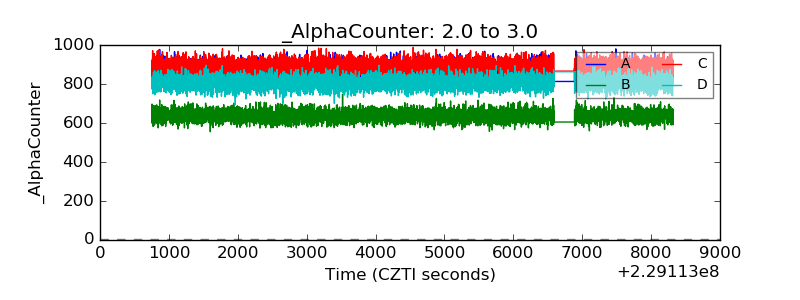 |
| _CPM_Rate | 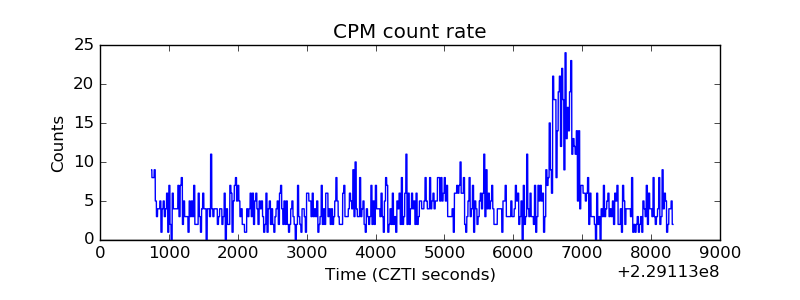 |
| CZT Counter | 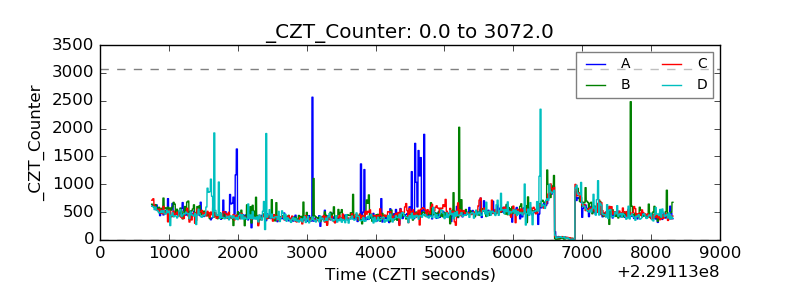 |
| +2.5 Volts monitor | 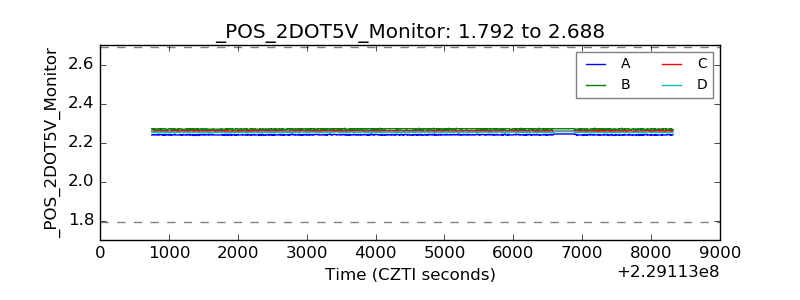 |
| +5 Volts monitor |  |
| _ROLL_ROT | 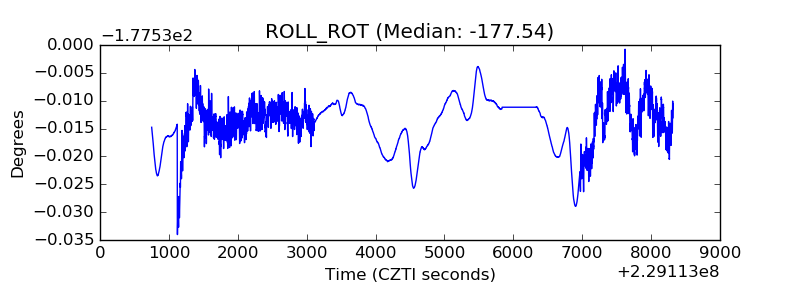 |
| _Roll_DEC | 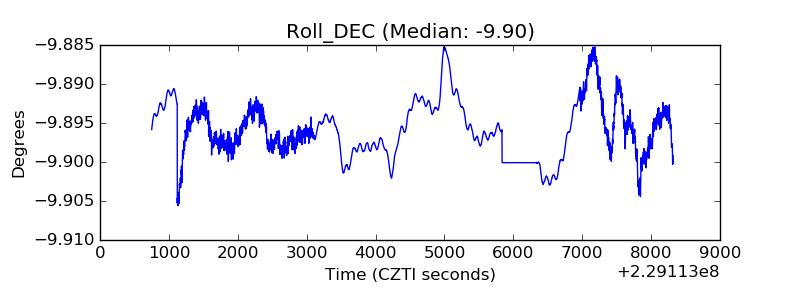 |
| _Roll_RA | 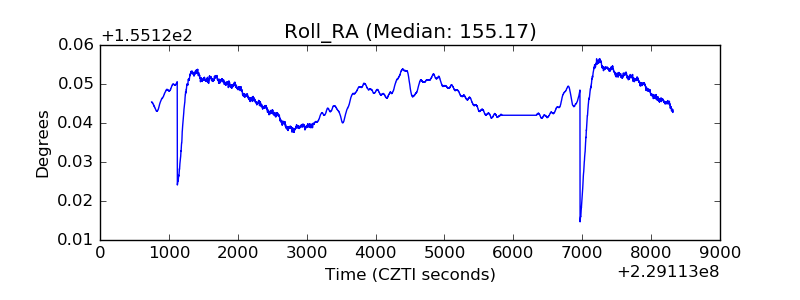 |
| Veto Counter | 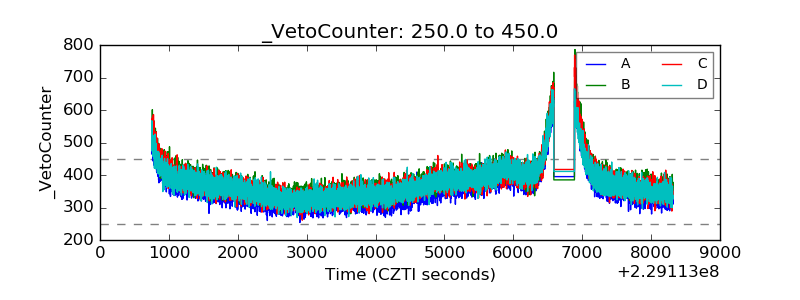 |