| Param | Original file | Final file |
|---|---|---|
| Filename | modeM0/AS1C02_041T01_9000001136_08227cztM0_level2.evt | modeM0/AS1C02_041T01_9000001136_08227cztM0_level2_quad_clean.evt |
| Size (bytes) | 503,562,240 | 98,464,320 |
| Size | 480.2 MB | 93.9 MB |
| Events in quadrant A | 3,361,975 | 626,259 |
| Events in quadrant B | 3,943,971 | 626,027 |
| Events in quadrant C | 3,715,827 | 612,989 |
| Events in quadrant D | 3,722,641 | 598,316 |
| Mode M9 | |||
|---|---|---|---|
| Quadrant | BADHDUFLAG | Total packets | Discarded packets |
| A | 0 | 4 | 0 |
| B | 0 | 4 | 0 |
| C | 0 | 4 | 0 |
| D | 0 | 4 | 0 |
| Mode SS | |||
|---|---|---|---|
| Quadrant | BADHDUFLAG | Total packets | Discarded packets |
| A | 0 | 152 | 0 |
| B | 0 | 152 | 0 |
| C | 0 | 152 | 0 |
| D | 0 | 152 | 0 |
| Mode M0 | |||
|---|---|---|---|
| Quadrant | BADHDUFLAG | Total packets | Discarded packets |
| A | 0 | 15315 | 3 |
| B | 0 | 16697 | 2 |
| C | 0 | 15695 | 2 |
| D | 0 | 16536 | 2 |
| Quadrant | Total seconds | Saturated seconds | Saturation percentage |
|---|---|---|---|
| A | 7445 | 23 | 0.308932% |
| B | 7445 | 140 | 1.880457% |
| C | 7445 | 11 | 0.147750% |
| D | 7445 | 80 | 1.074547% |
Noise dominated data is calculated using 1-second bins in cleaned event files. If a bin has >2000 counts, and if more than 50% of those come from <1% of pixels, then it is considered to be noise-dominated and hence unusable.
| Quadrant | # 1 sec bins | Bins with >0 counts | Bins with >2000 counts | High rate bins dominated by noise | Noise dominated (total time) | Noise dominated (detector-on time) | Marked lightcurve |
|---|---|---|---|---|---|---|---|
| A | 7875 | 7446 | 2 | 2 | 0.03% | 0.03% | 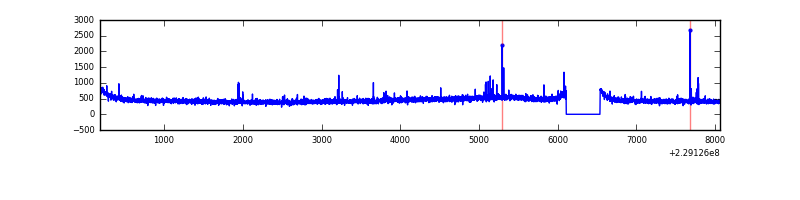 |
| B | 7875 | 7446 | 81 | 81 | 1.03% | 1.09% | 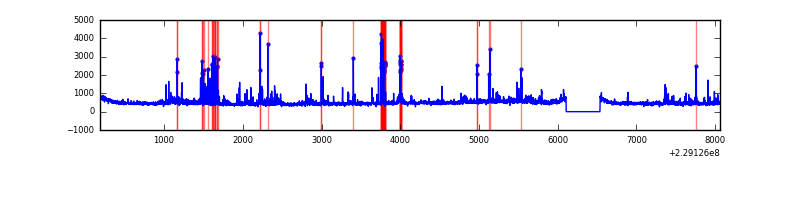 |
| C | 7875 | 7446 | 0 | 0 | 0.00% | 0.00% | 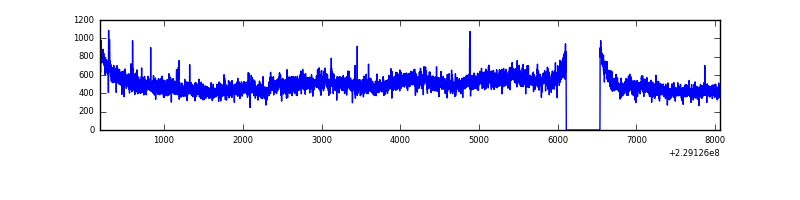 |
| D | 7875 | 7446 | 53 | 53 | 0.67% | 0.71% | 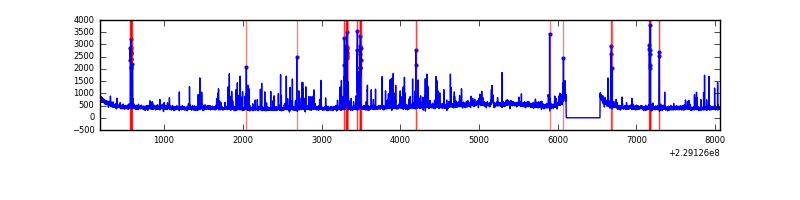 |
Top three noisy pixels from each quadrant. If the there are fewer than three noisy pixels in the level2.evt file, extra rows are filled as -1
| Pixel properties | Quadrant properties | ||||||
|---|---|---|---|---|---|---|---|
| Quadrant | DetID | PixID | Counts | Sigma | Mean | Median | Sigma |
| A | 5 | 16 | 32668 | 180.07 | 861 | 842 | 176.7 |
| A | 0 | 226 | 8140 | 41.29 | 861 | 842 | 176.7 |
| A | 12 | 194 | 7749 | 39.08 | 861 | 842 | 176.7 |
| B | 10 | 16 | 240054 | 1445.2 | 859 | 839 | 165.5 |
| B | 4 | 48 | 138252 | 830.17 | 859 | 839 | 165.5 |
| B | 0 | 214 | 74510 | 445.08 | 859 | 839 | 165.5 |
| C | 9 | 68 | 431303 | 2212.06 | 830 | 830 | 194.6 |
| C | 1 | 16 | 41259 | 207.75 | 830 | 830 | 194.6 |
| C | 13 | 61 | 6286 | 28.04 | 830 | 830 | 194.6 |
| D | 1 | 52 | 209464 | 1016.55 | 831 | 805 | 205.3 |
| D | 12 | 233 | 139485 | 675.62 | 831 | 805 | 205.3 |
| D | 7 | 55 | 63958 | 307.67 | 831 | 805 | 205.3 |
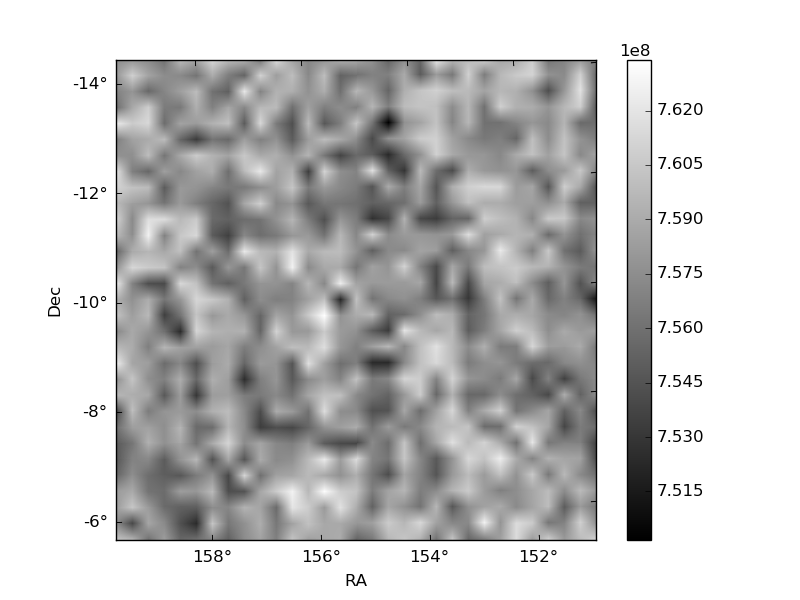
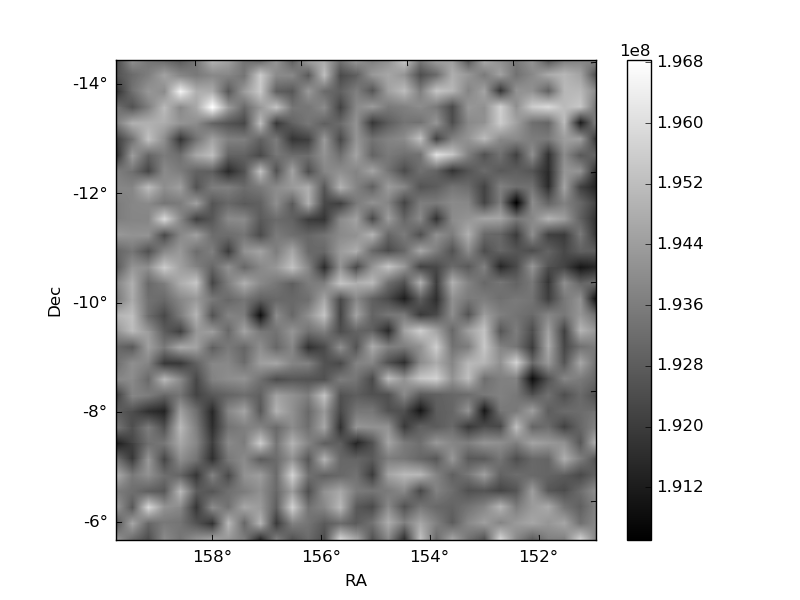
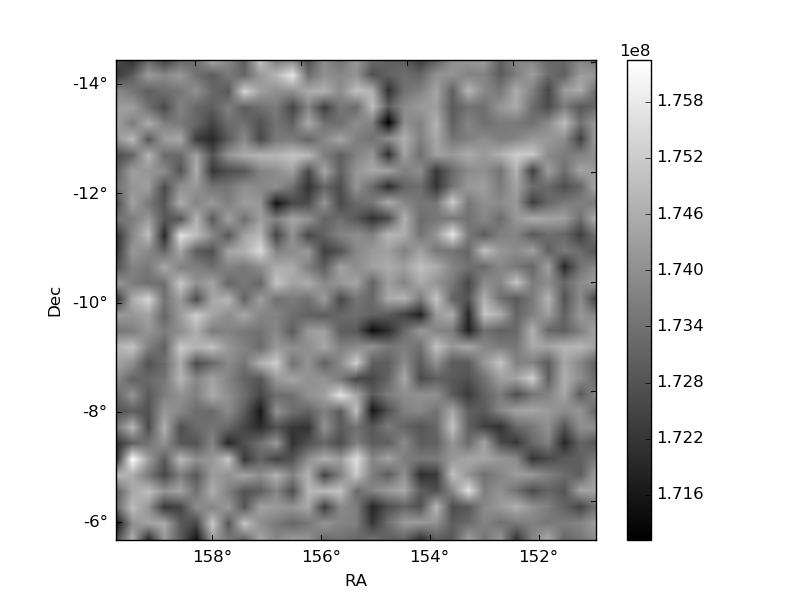
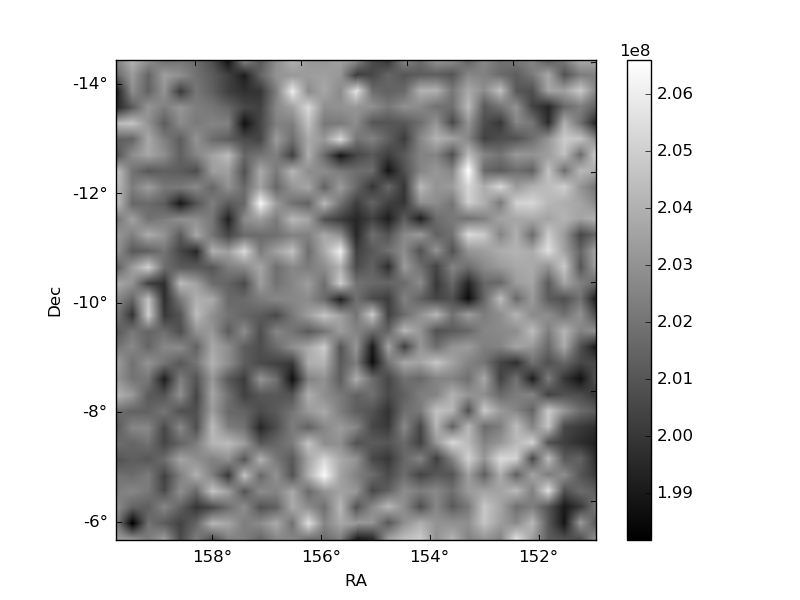
Histogram calculated using DETX and DETY for each event in the final _common_clean file
| Quadrant A | 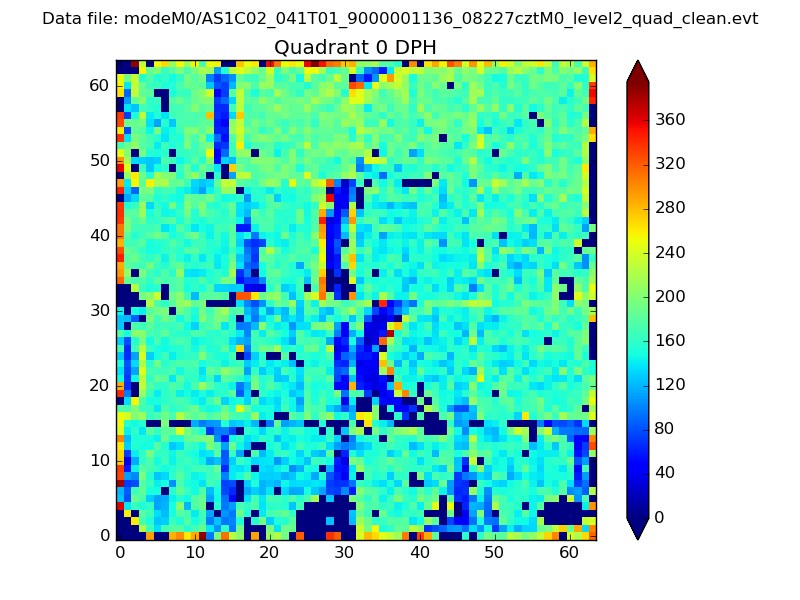 |
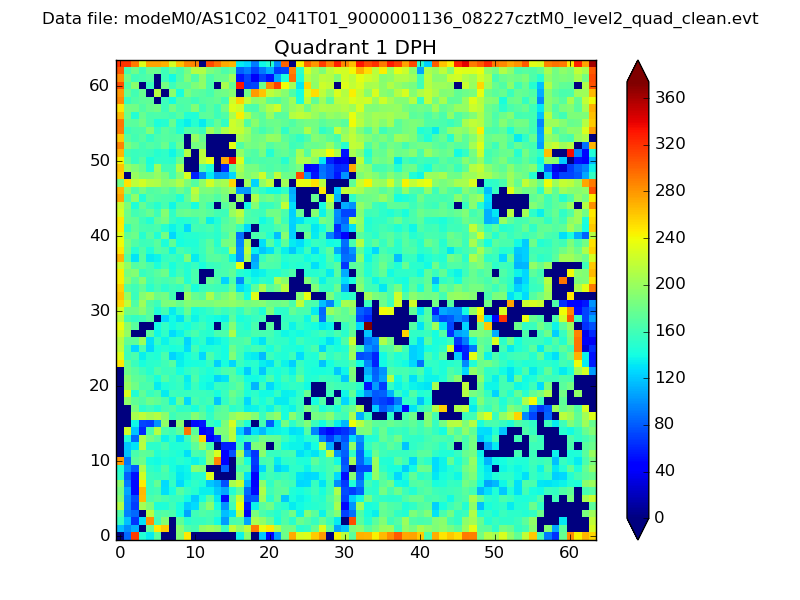 |
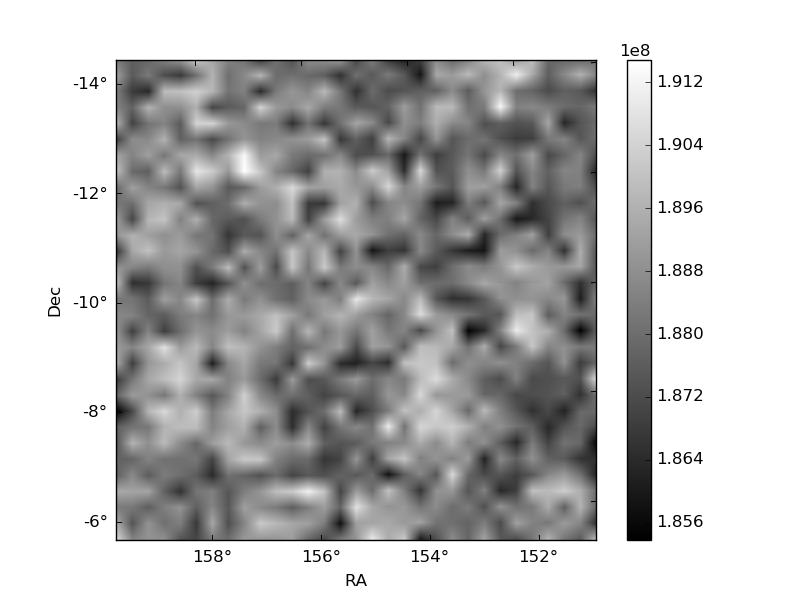
Quadrant B |
|---|---|---|---|
| Quadrant D | 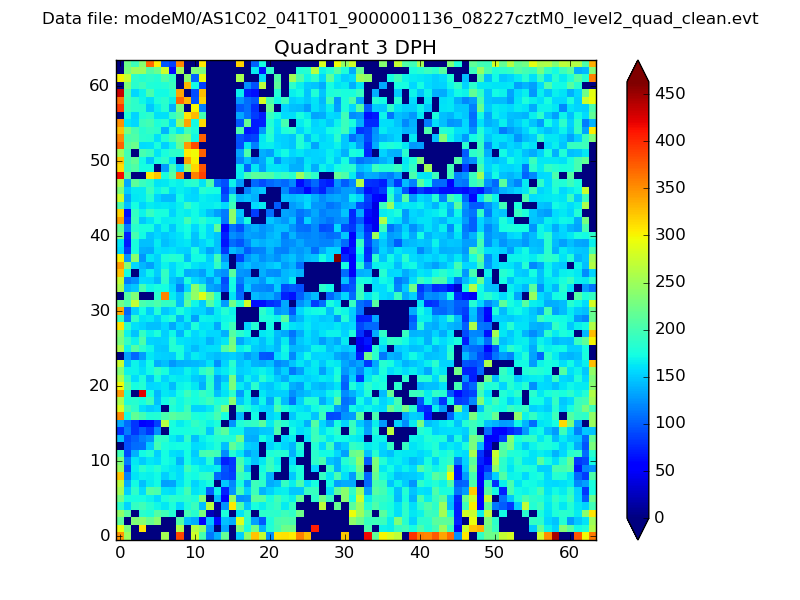 |
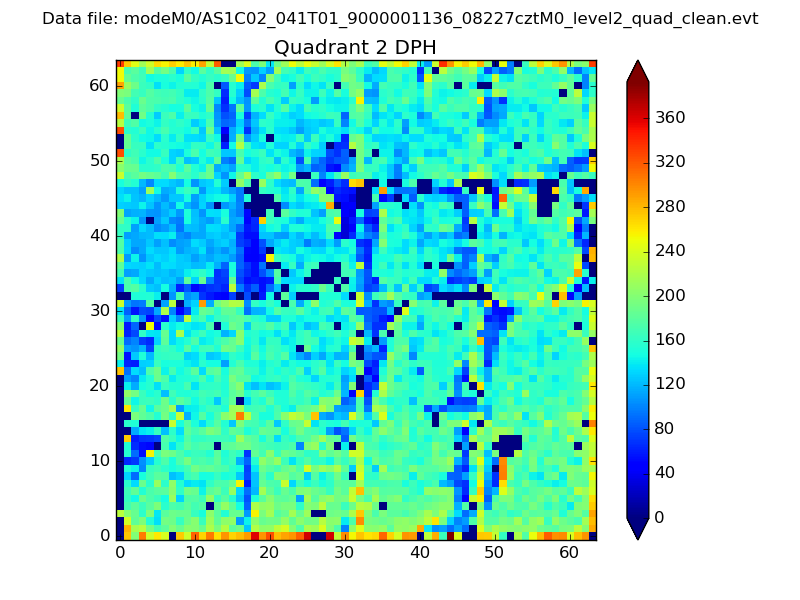 |
Quadrant C |
| Plot type | Count rate plots | Images |
|---|---|---|
| Comparison with Poisson distribution Blue bars denote a histogram of data divided into 1 sec bins. Red curve is a Poisson curve with rate = median count rate of data. |
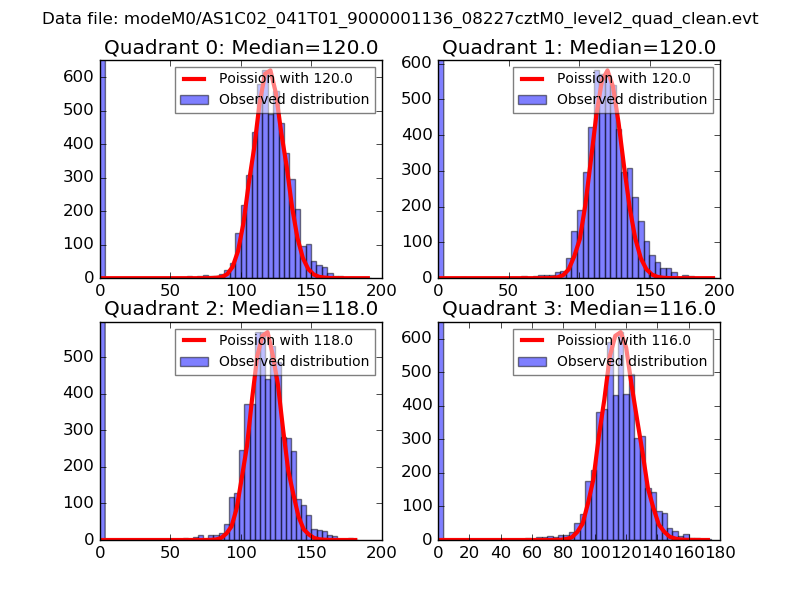 |
 |
| Quadrant-wise count rates Data is divided into 100 sec bins |
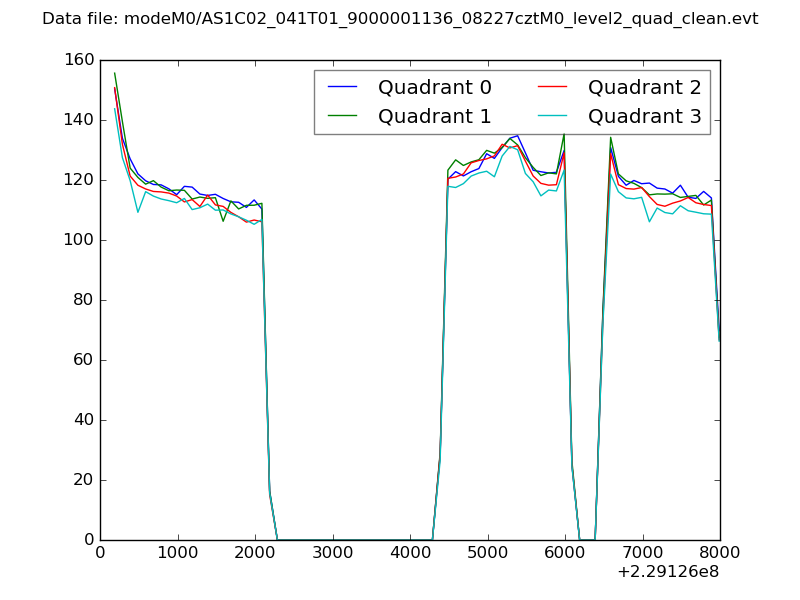 |
|
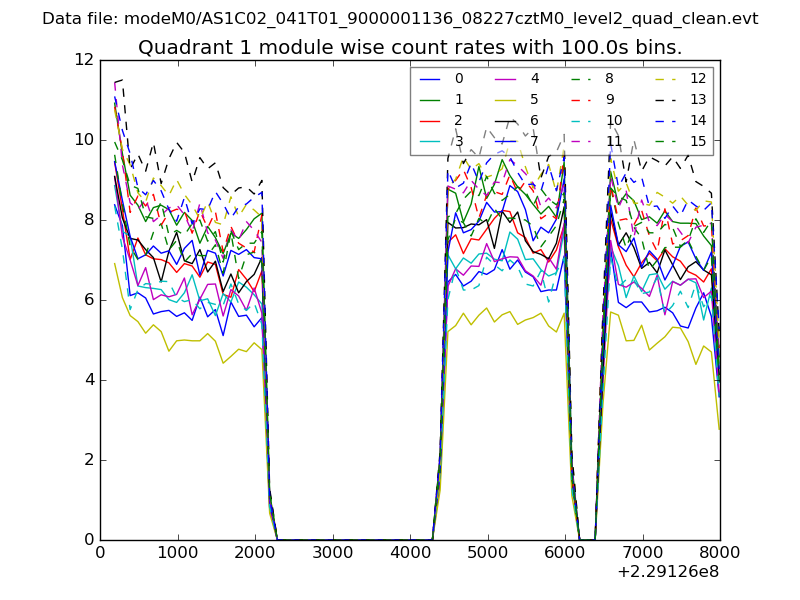
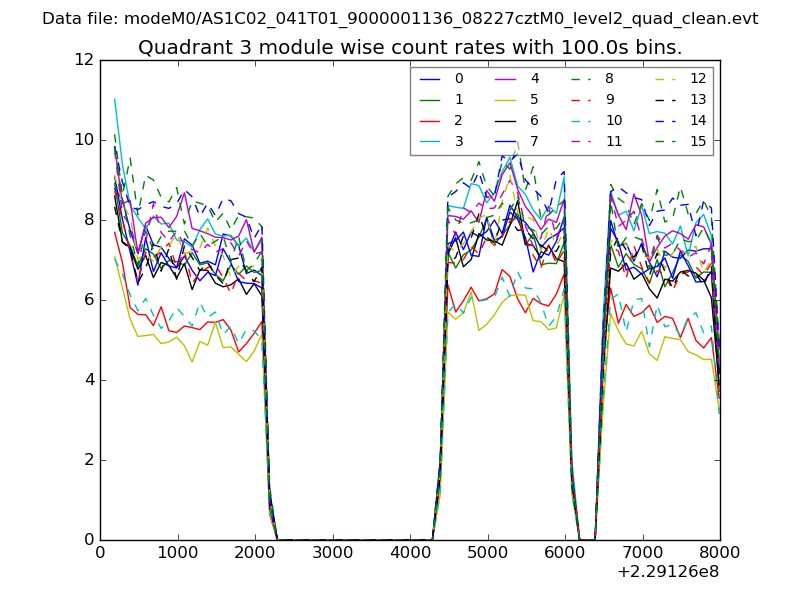
| Module-wise count rates for Quadrant A Data is divided into 100 sec bins |
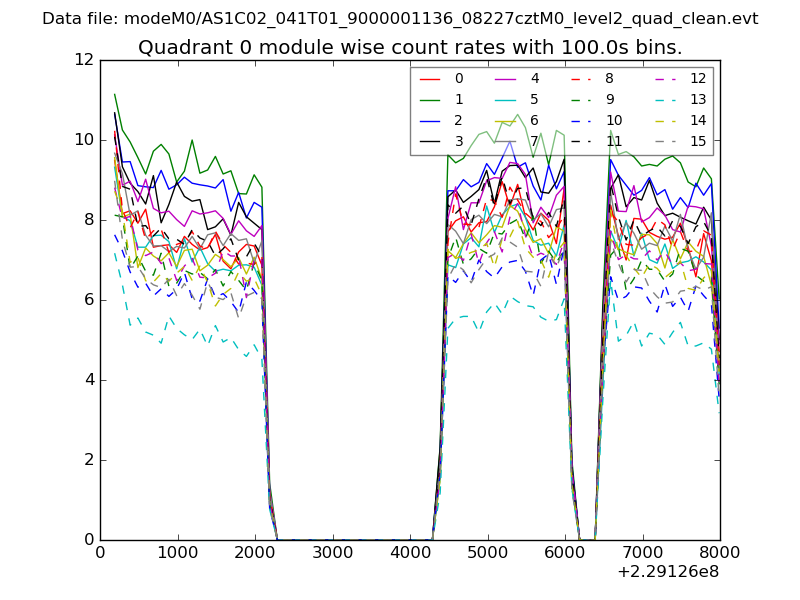 |
 |
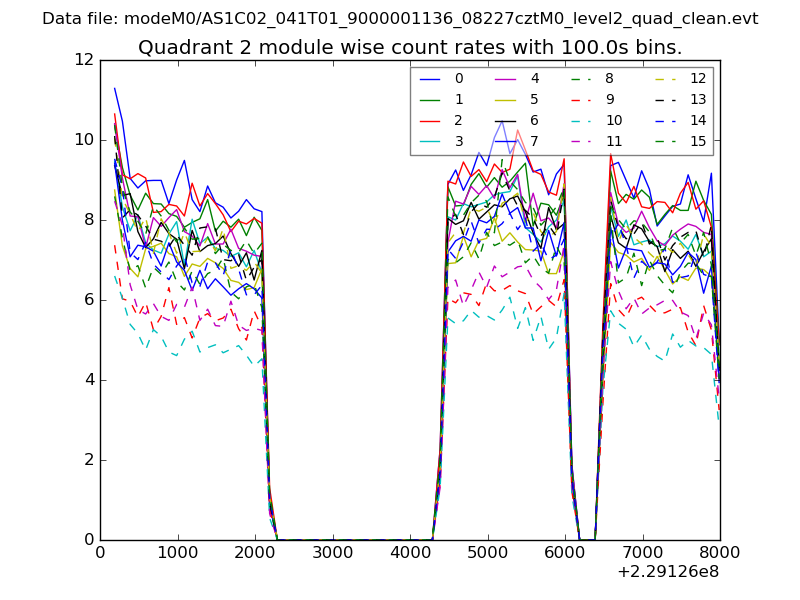
| Module-wise count rates for Quadrant B Data is divided into 100 sec bins |
 |
 |
| Module-wise count rates for Quadrant C Data is divided into 100 sec bins |
 |
 |
| Module-wise count rates for Quadrant D Data is divided into 100 sec bins |
 |
 |
| Parameter | Plot |
|---|---|
| CZT HV Monitor | 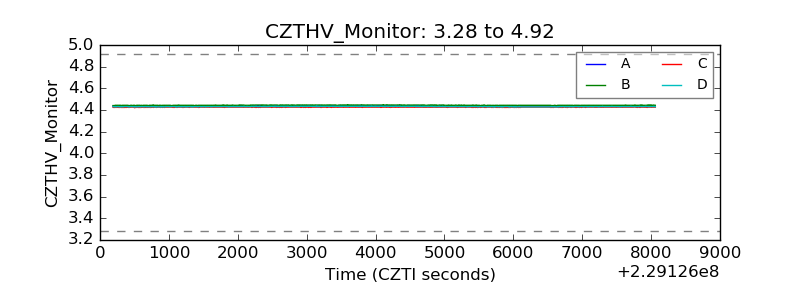 |
| D_VDD | 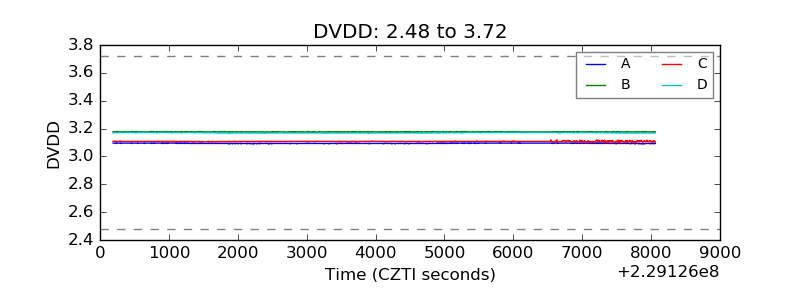 |
| Temperature 1 | 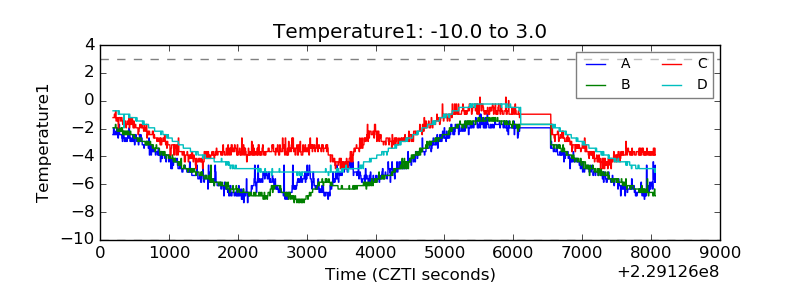 |
| Veto HV Monitor | 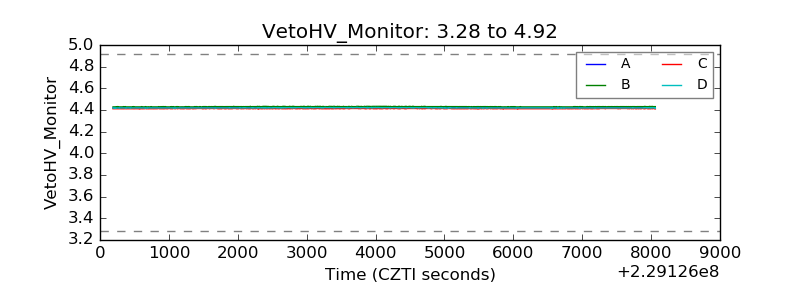 |
| Veto LLD | 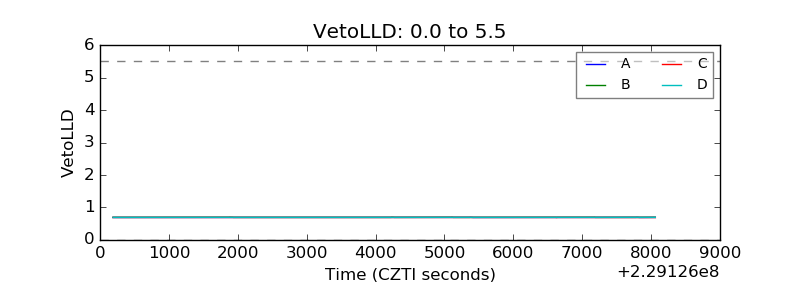 |
| Alpha Counter | 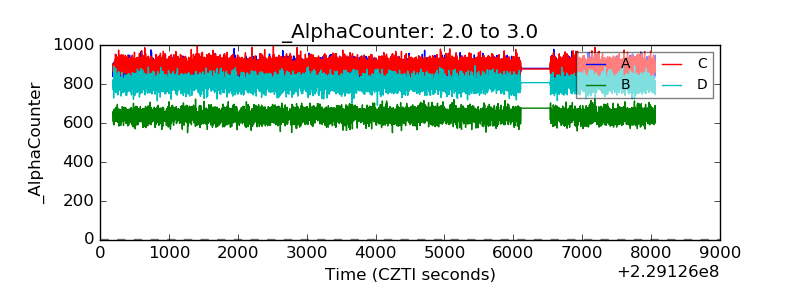 |
| _CPM_Rate | 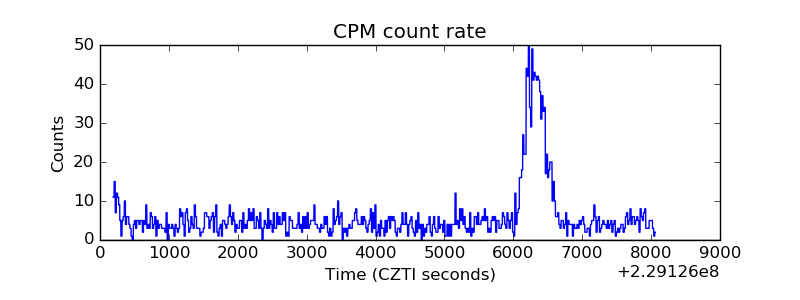 |
| CZT Counter | 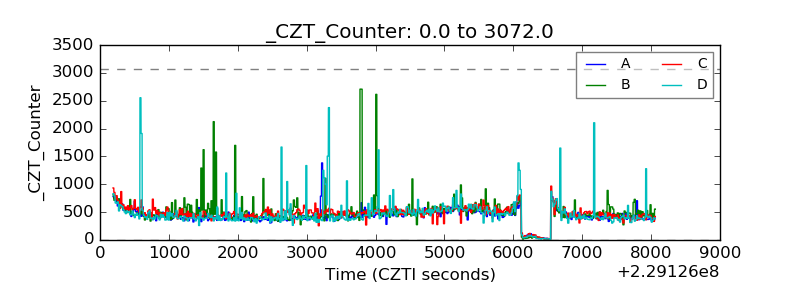 |
| +2.5 Volts monitor |  |
| +5 Volts monitor |  |
| _ROLL_ROT | 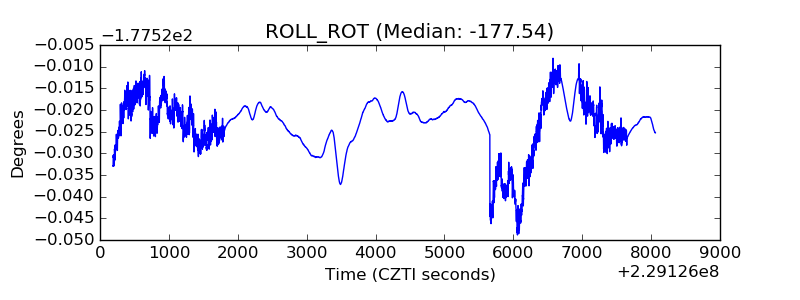 |
| _Roll_DEC | 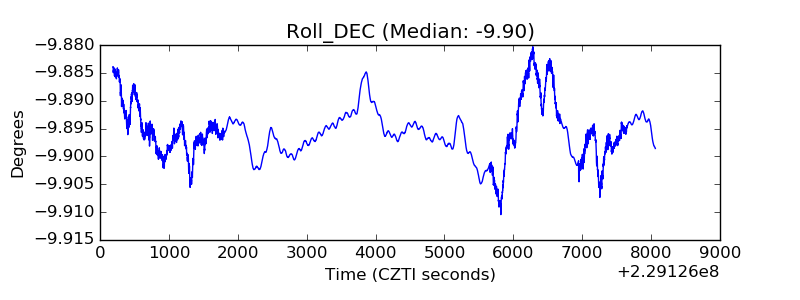 |
| _Roll_RA | 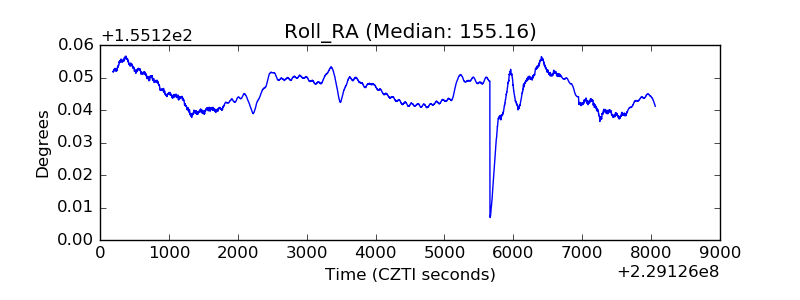 |
| Veto Counter | 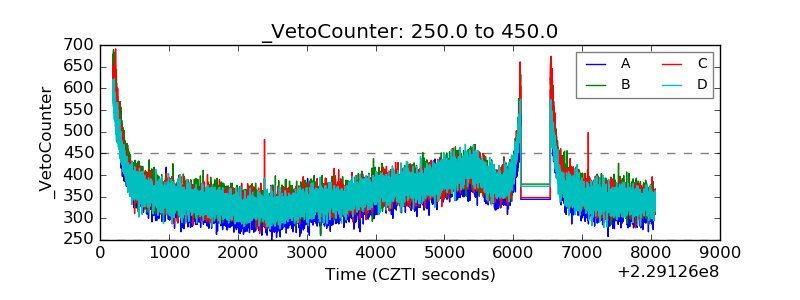 |