| Param | Original file | Final file |
|---|---|---|
| Filename | modeM0/AS1C02_041T01_9000001136_08230cztM0_level2.evt | modeM0/AS1C02_041T01_9000001136_08230cztM0_level2_quad_clean.evt |
| Size (bytes) | 588,928,320 | 83,030,400 |
| Size | 561.6 MB | 79.2 MB |
| Events in quadrant A | 4,038,439 | 483,221 |
| Events in quadrant B | 4,258,166 | 487,640 |
| Events in quadrant C | 3,821,839 | 481,421 |
| Events in quadrant D | 5,135,986 | 466,708 |
| Mode M9 | |||
|---|---|---|---|
| Quadrant | BADHDUFLAG | Total packets | Discarded packets |
| A | 0 | 6 | 0 |
| B | 0 | 6 | 0 |
| C | 0 | 6 | 0 |
| D | 0 | 6 | 0 |
| Mode SS | |||
|---|---|---|---|
| Quadrant | BADHDUFLAG | Total packets | Discarded packets |
| A | 0 | 174 | 0 |
| B | 0 | 174 | 0 |
| C | 0 | 174 | 0 |
| D | 0 | 174 | 0 |
| Mode M0 | |||
|---|---|---|---|
| Quadrant | BADHDUFLAG | Total packets | Discarded packets |
| A | 0 | 18445 | 1 |
| B | 0 | 18559 | 1 |
| C | 0 | 17291 | 1 |
| D | 0 | 21496 | 1 |
| Quadrant | Total seconds | Saturated seconds | Saturation percentage |
|---|---|---|---|
| A | 8569 | 62 | 0.723538% |
| B | 8569 | 64 | 0.746878% |
| C | 8569 | 24 | 0.280079% |
| D | 8569 | 255 | 2.975843% |
Noise dominated data is calculated using 1-second bins in cleaned event files. If a bin has >2000 counts, and if more than 50% of those come from <1% of pixels, then it is considered to be noise-dominated and hence unusable.
| Quadrant | # 1 sec bins | Bins with >0 counts | Bins with >2000 counts | High rate bins dominated by noise | Noise dominated (total time) | Noise dominated (detector-on time) | Marked lightcurve |
|---|---|---|---|---|---|---|---|
| A | 9164 | 8570 | 18 | 18 | 0.20% | 0.21% |  |
| B | 9164 | 8570 | 17 | 17 | 0.19% | 0.20% | 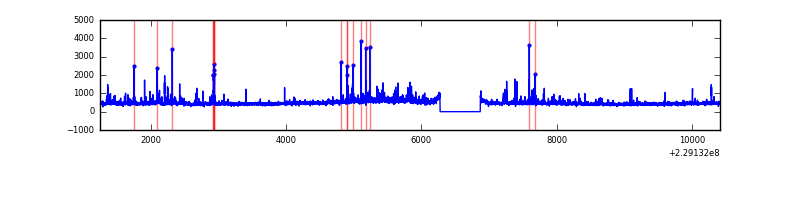 |
| C | 9164 | 8570 | 0 | 0 | 0.00% | 0.00% | 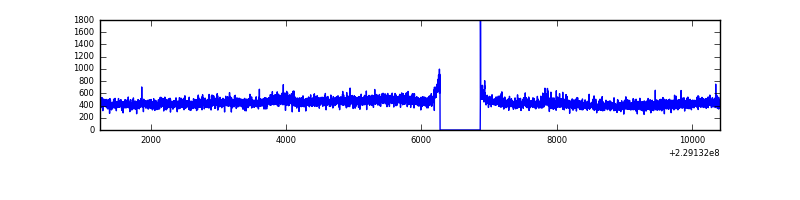 |
| D | 9164 | 8570 | 249 | 249 | 2.72% | 2.91% | 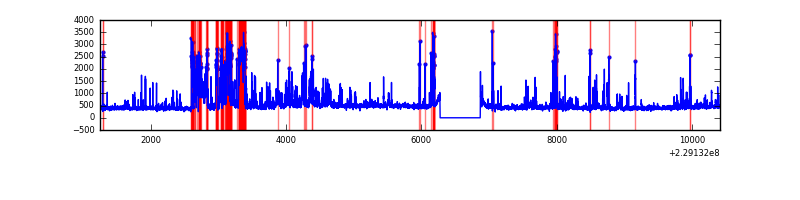 |
Top three noisy pixels from each quadrant. If the there are fewer than three noisy pixels in the level2.evt file, extra rows are filled as -1
| Pixel properties | Quadrant properties | ||||||
|---|---|---|---|---|---|---|---|
| Quadrant | DetID | PixID | Counts | Sigma | Mean | Median | Sigma |
| A | 15 | 79 | 215320 | 1082.85 | 960 | 938 | 198.0 |
| A | 5 | 16 | 106972 | 535.58 | 960 | 938 | 198.0 |
| A | 6 | 16 | 14285 | 67.42 | 960 | 938 | 198.0 |
| B | 10 | 16 | 167963 | 887.7 | 970 | 944 | 188.1 |
| B | 0 | 214 | 118593 | 625.3 | 970 | 944 | 188.1 |
| B | 4 | 48 | 79862 | 419.45 | 970 | 944 | 188.1 |
| C | 9 | 68 | 126327 | 575.76 | 933 | 936 | 217.8 |
| C | 1 | 16 | 38702 | 173.41 | 933 | 936 | 217.8 |
| C | 8 | 128 | 10265 | 42.84 | 933 | 936 | 217.8 |
| D | 1 | 52 | 1063035 | 4666.64 | 924 | 896 | 227.6 |
| D | 2 | 14 | 413391 | 1812.35 | 924 | 896 | 227.6 |
| D | 12 | 233 | 125841 | 548.96 | 924 | 896 | 227.6 |
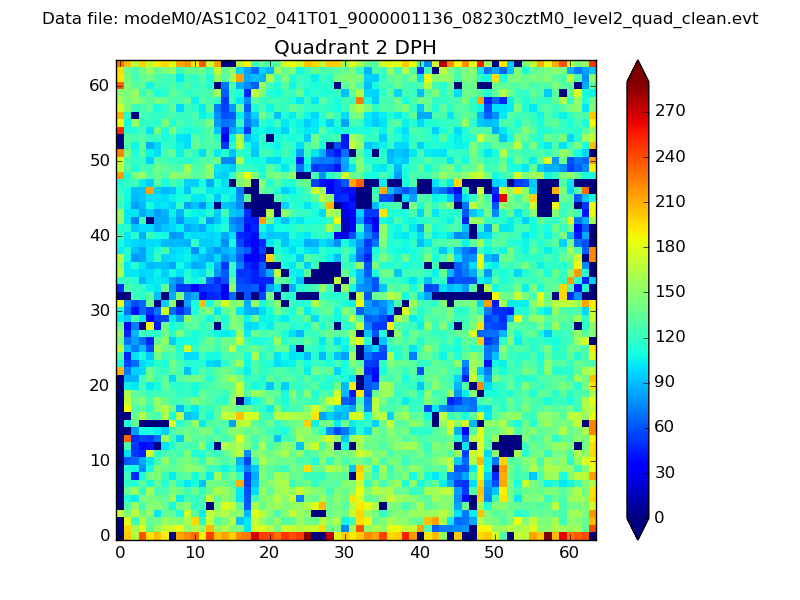
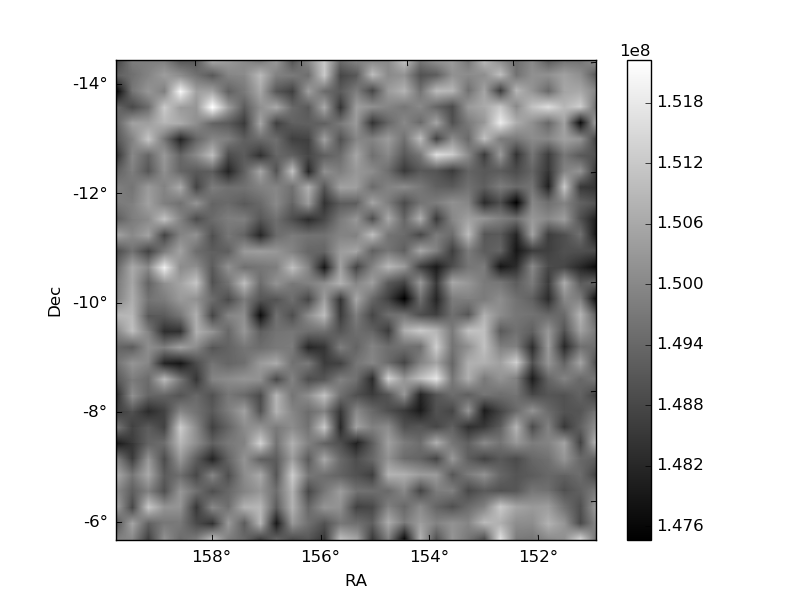
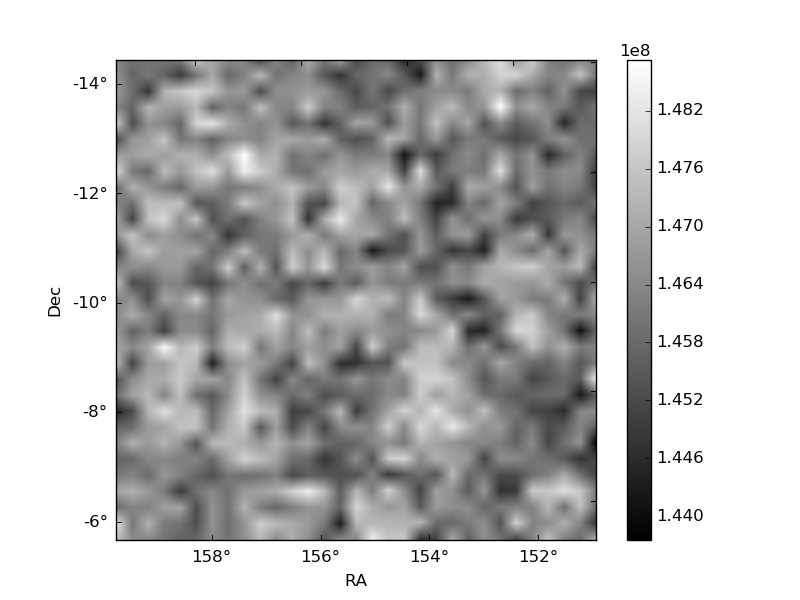
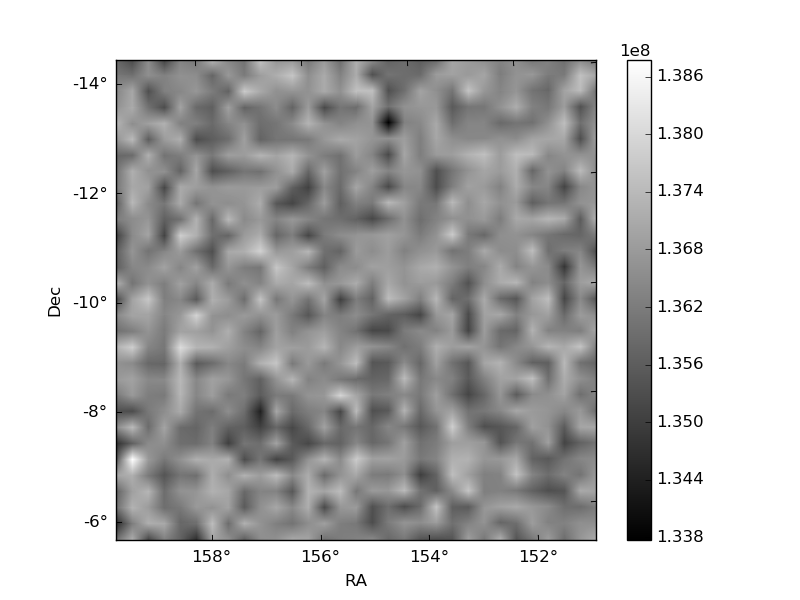
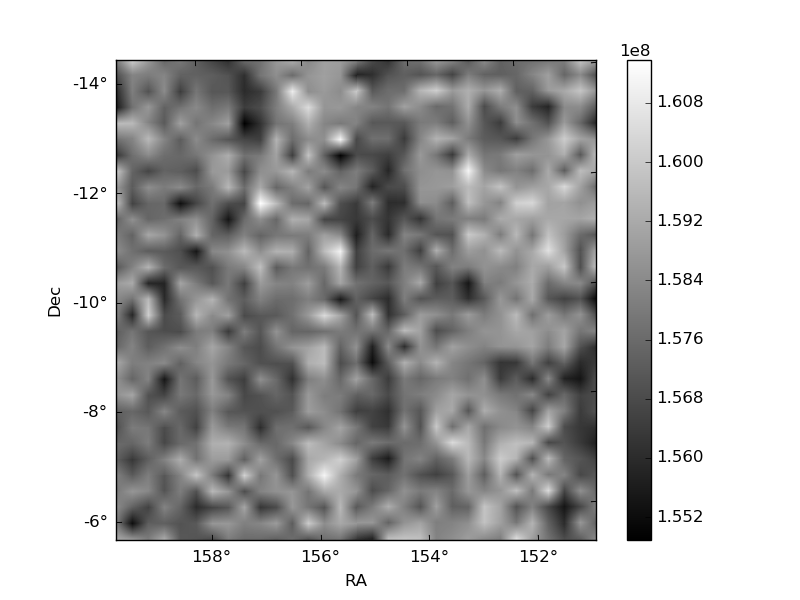
Histogram calculated using DETX and DETY for each event in the final _common_clean file
| Quadrant A | 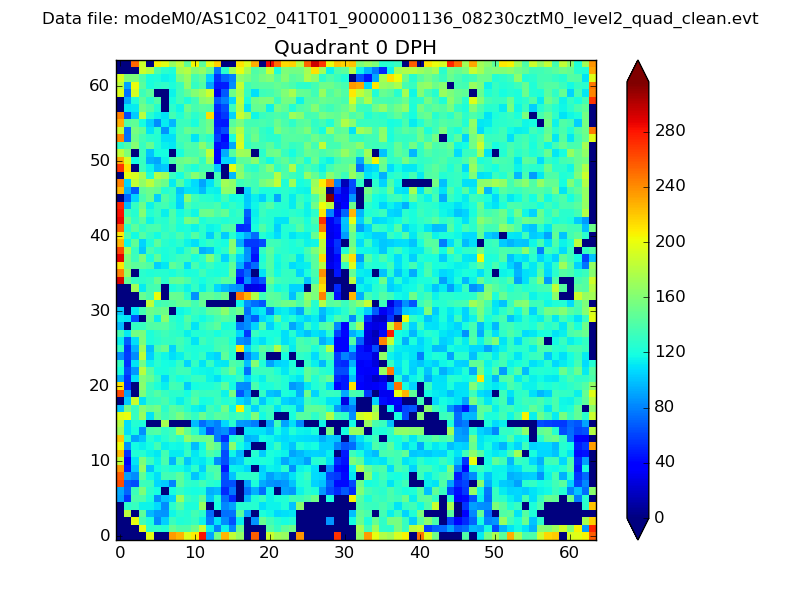 |
 |
Quadrant B |
|---|---|---|---|
| Quadrant D | 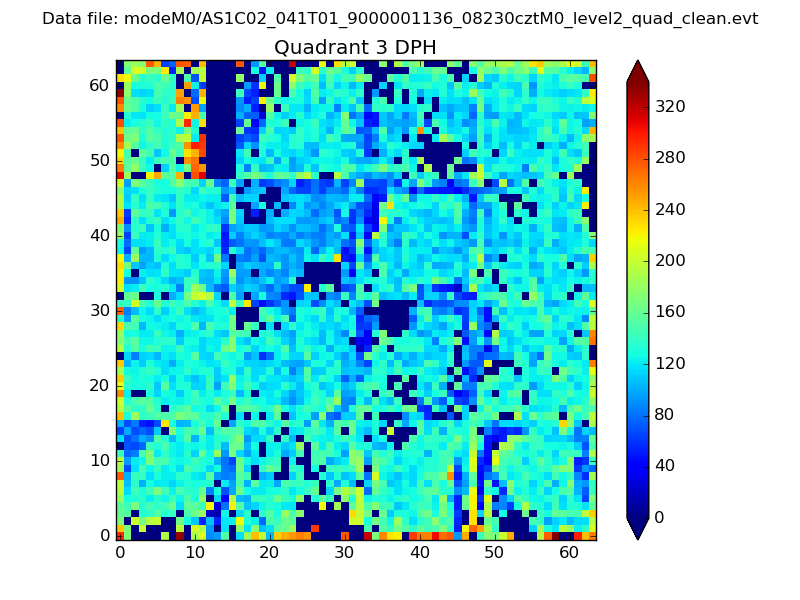 |
 |
Quadrant C |
| Plot type | Count rate plots | Images |
|---|---|---|
| Comparison with Poisson distribution Blue bars denote a histogram of data divided into 1 sec bins. Red curve is a Poisson curve with rate = median count rate of data. |
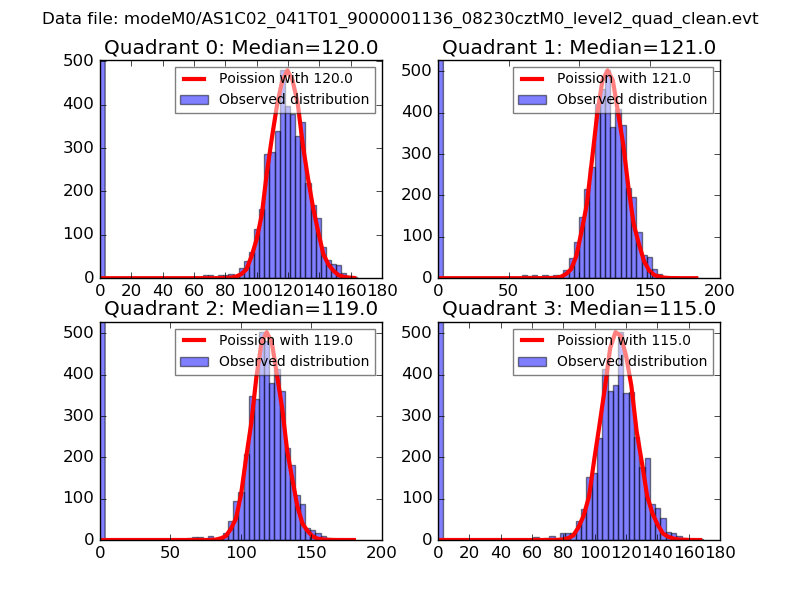 |
 |
| Quadrant-wise count rates Data is divided into 100 sec bins |
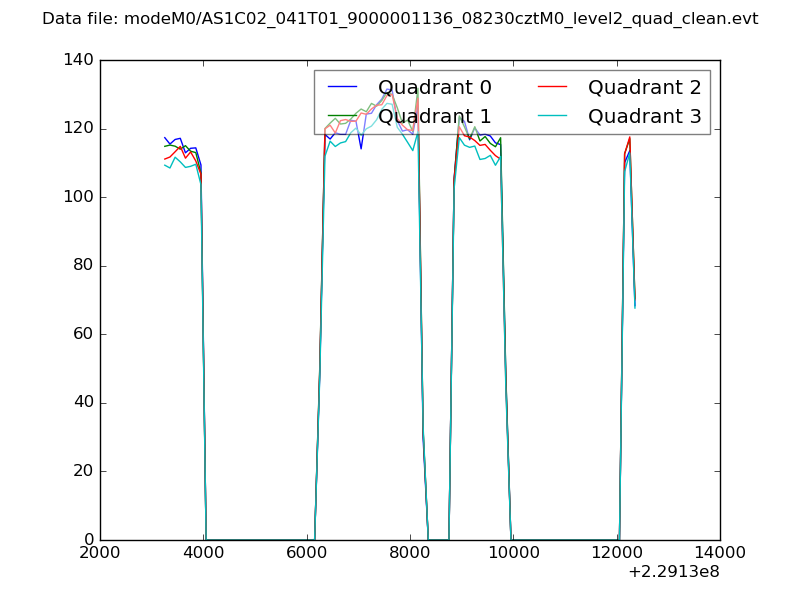 |
|
| Module-wise count rates for Quadrant A Data is divided into 100 sec bins |
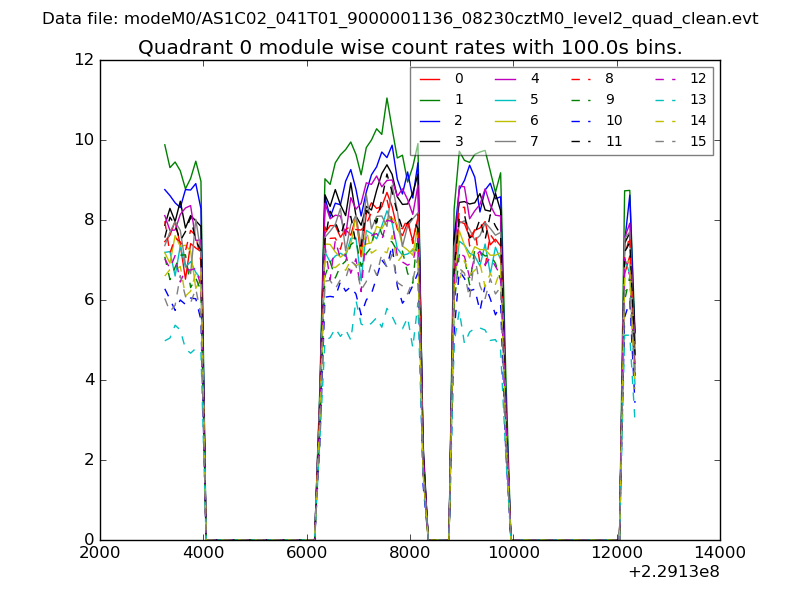 |
 |
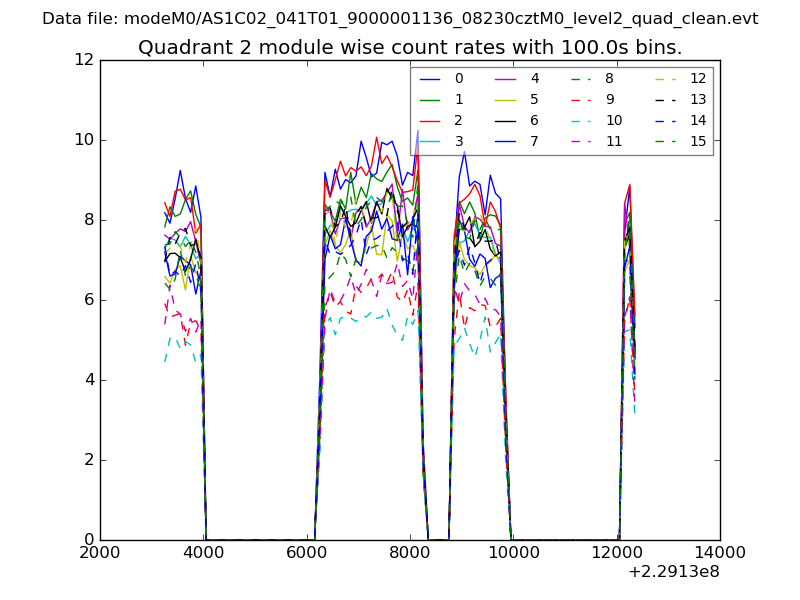
| Module-wise count rates for Quadrant B Data is divided into 100 sec bins |
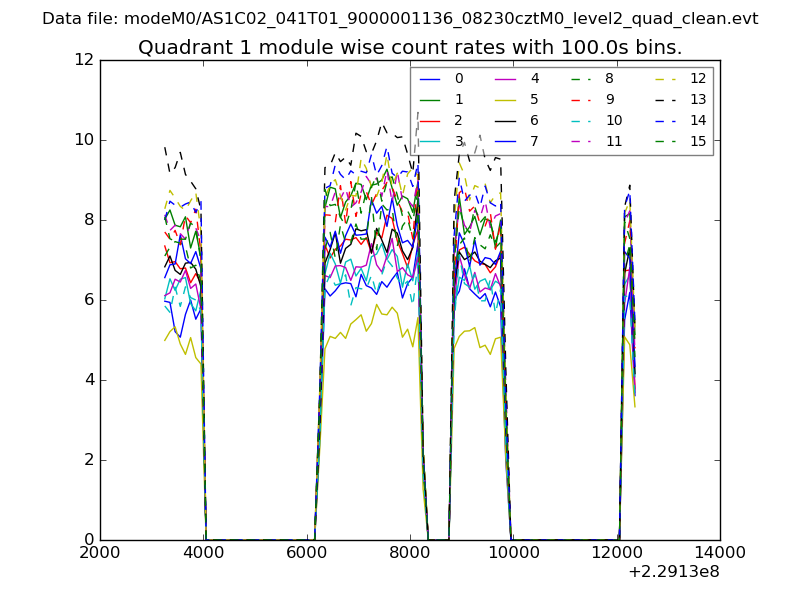 |
 |
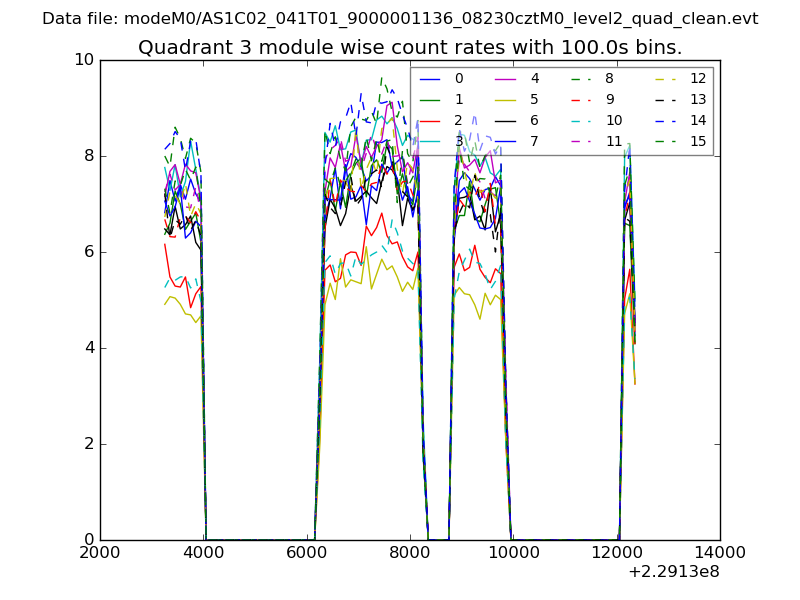
| Module-wise count rates for Quadrant C Data is divided into 100 sec bins |
 |
 |
| Module-wise count rates for Quadrant D Data is divided into 100 sec bins |
 |
 |
| Parameter | Plot |
|---|---|
| CZT HV Monitor | 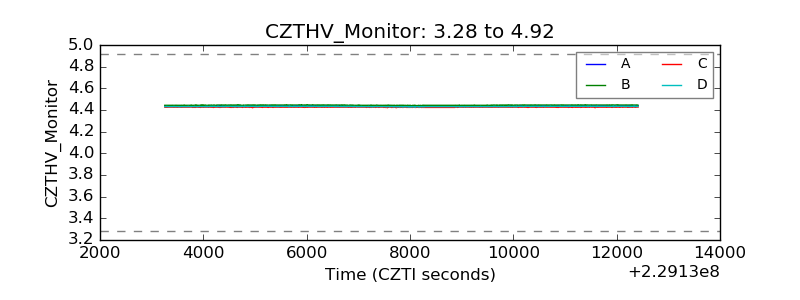 |
| D_VDD | 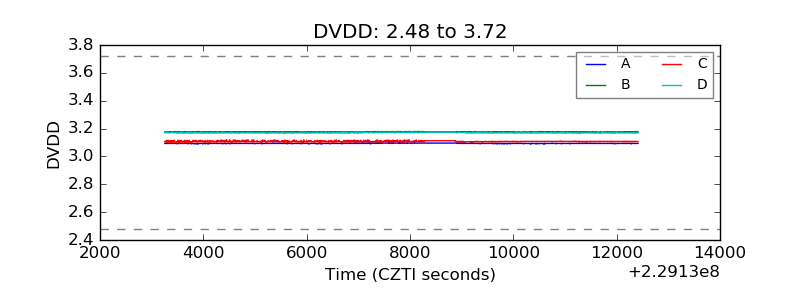 |
| Temperature 1 | 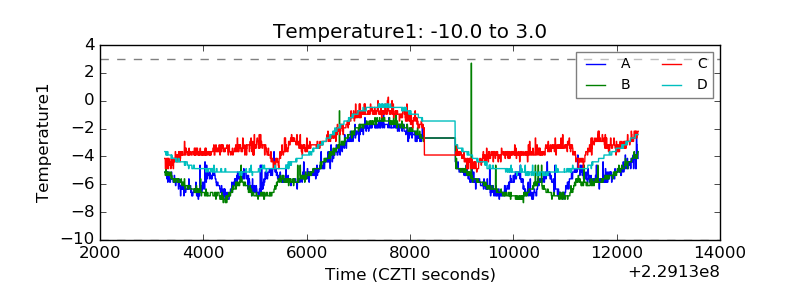 |
| Veto HV Monitor | 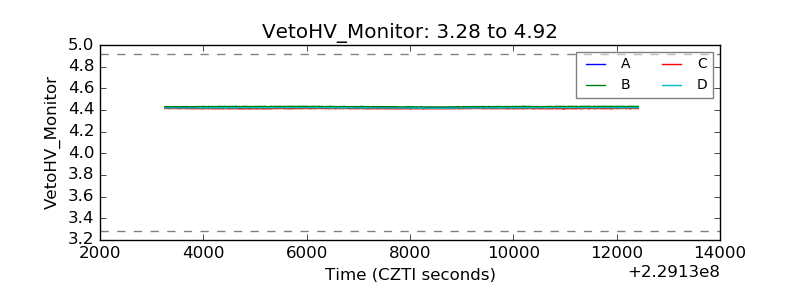 |
| Veto LLD | 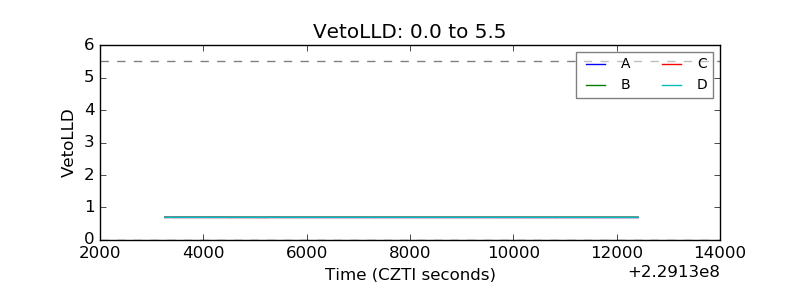 |
| Alpha Counter | 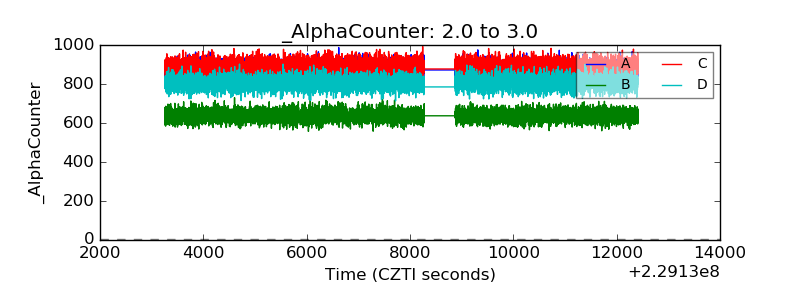 |
| _CPM_Rate | 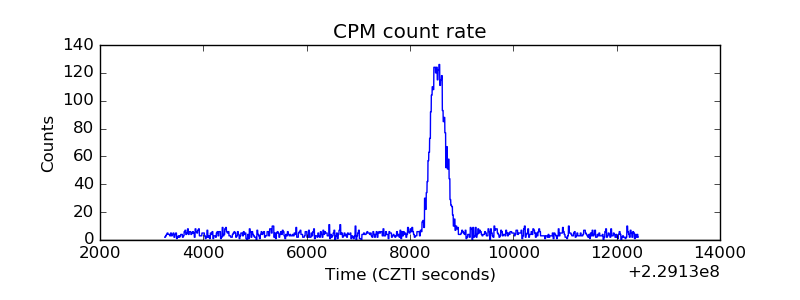 |
| CZT Counter | 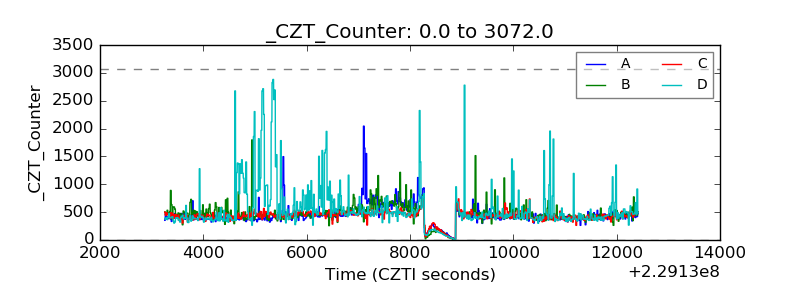 |
| +2.5 Volts monitor |  |
| +5 Volts monitor |  |
| _ROLL_ROT | 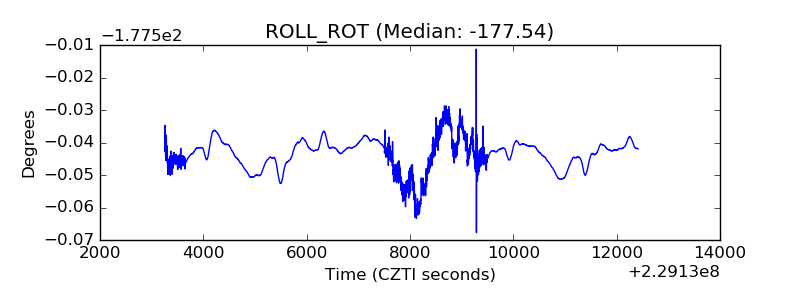 |
| _Roll_DEC | 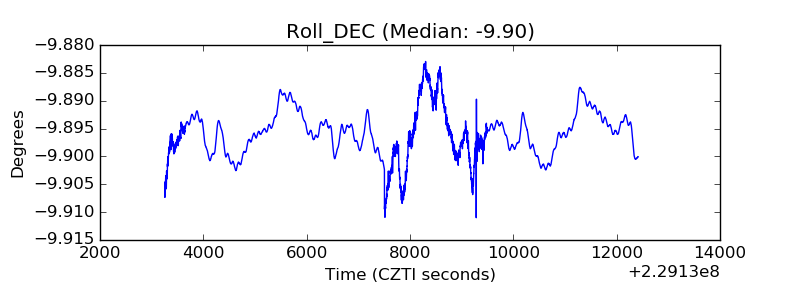 |
| _Roll_RA | 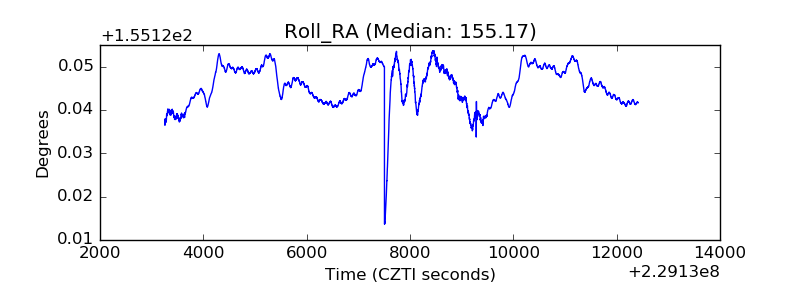 |
| Veto Counter | 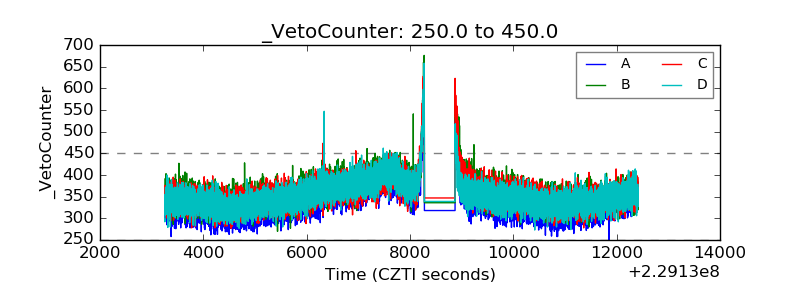 |