| Param | Original file | Final file |
|---|---|---|
| Filename | modeM0/AS1G07_034T01_9000001134cztM0_level2.fits | modeM0/AS1G07_034T01_9000001134cztM0_level2_quad_clean.evt |
| Size (bytes) | 141,503,040 | 134,403,840 |
| Size | 134.9 MB | 128.2 MB |
| Events in quadrant A | 845,480 | 771,767 |
| Events in quadrant B | 820,310 | 777,706 |
| Events in quadrant C | 838,172 | 758,019 |
| Events in quadrant D | 717,536 | 698,210 |
| Mode SS | |||
|---|---|---|---|
| Quadrant | BADHDUFLAG | Total packets | Discarded packets |
| A | 0 | 314 | 0 |
| B | 0 | 314 | 0 |
| C | 0 | 314 | 0 |
| D | 0 | 314 | 0 |
| Mode M9 | |||
|---|---|---|---|
| Quadrant | BADHDUFLAG | Total packets | Discarded packets |
| A | 0 | 15 | 0 |
| B | 0 | 15 | 0 |
| C | 0 | 15 | 0 |
| D | 0 | 15 | 0 |
| Mode M0 | |||
|---|---|---|---|
| Quadrant | BADHDUFLAG | Total packets | Discarded packets |
| A | 0 | 32772 | 0 |
| B | 0 | 32262 | 0 |
| C | 0 | 31596 | 0 |
| D | 0 | 39164 | 0 |
| Quadrant | Total seconds | Saturated seconds | Saturation percentage |
|---|---|---|---|
| A | 15422 | 131 | 0.849436% |
| B | 15422 | 143 | 0.927247% |
| C | 15422 | 58 | 0.376086% |
| D | 15422 | 548 | 3.553365% |
Noise dominated data is calculated using 1-second bins in cleaned event files. If a bin has >2000 counts, and if more than 50% of those come from <1% of pixels, then it is considered to be noise-dominated and hence unusable.
| Quadrant | # 1 sec bins | Bins with >0 counts | Bins with >2000 counts | High rate bins dominated by noise | Noise dominated (total time) | Noise dominated (detector-on time) | Marked lightcurve |
|---|---|---|---|---|---|---|---|
| A | 16957 | 15422 | 0 | 0 | 0.00% | 0.00% |  |
| B | 16957 | 15422 | 0 | 0 | 0.00% | 0.00% |  |
| C | 16957 | 15422 | 0 | 0 | 0.00% | 0.00% |  |
| D | 16957 | 15422 | 0 | 0 | 0.00% | 0.00% | 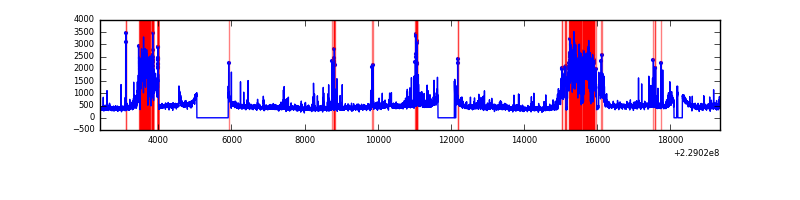 |
Top three noisy pixels from each quadrant. If the there are fewer than three noisy pixels in the level2.evt file, extra rows are filled as -1
| Pixel properties | Quadrant properties | ||||||
|---|---|---|---|---|---|---|---|
| Quadrant | DetID | PixID | Counts | Sigma | Mean | Median | Sigma |
| A | 14 | 188 | 849 | 11.24 | 219 | 204 | 57.4 |
| A | 0 | 29 | 816 | 10.66 | 219 | 204 | 57.4 |
| A | 7 | 110 | 745 | 9.43 | 219 | 204 | 57.4 |
| B | 2 | 9 | 716 | 11.16 | 216 | 205 | 45.8 |
| B | 14 | 254 | 551 | 7.55 | 216 | 205 | 45.8 |
| B | 5 | 128 | 546 | 7.44 | 216 | 205 | 45.8 |
| C | 1 | 80 | 619 | 6.94 | 221 | 205 | 59.7 |
| C | 1 | 81 | 610 | 6.79 | 221 | 205 | 59.7 |
| C | 2 | 191 | 596 | 6.55 | 221 | 205 | 59.7 |
| D | 1 | 19 | 570 | 6.81 | 204 | 185 | 56.5 |
| D | 3 | 14 | 552 | 6.5 | 204 | 185 | 56.5 |
| D | 1 | 3 | 533 | 6.16 | 204 | 185 | 56.5 |
Histogram calculated using DETX and DETY for each event in the final _common_clean file
| Quadrant A |  |
 |
Quadrant B |
|---|---|---|---|
| Quadrant D |  |
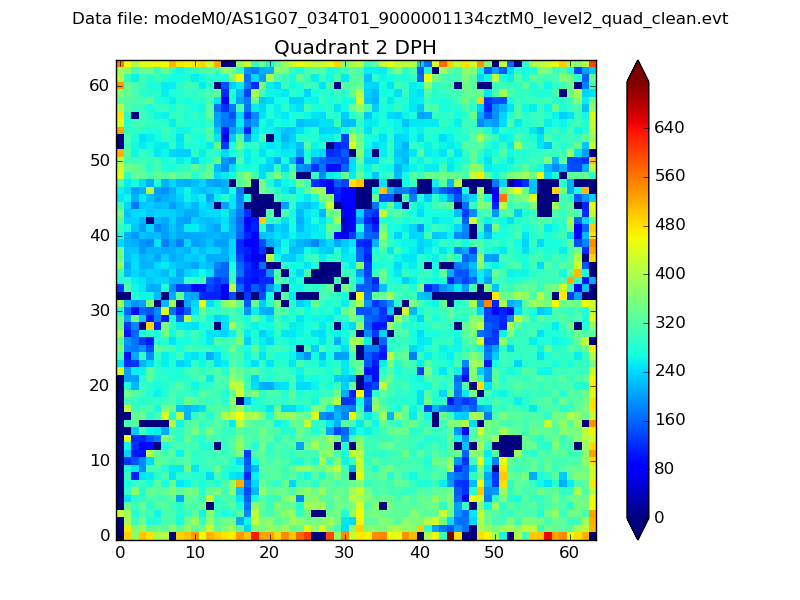 |
Quadrant C |
| Plot type | Count rate plots | Images |
|---|---|---|
| Comparison with Poisson distribution Blue bars denote a histogram of data divided into 1 sec bins. Red curve is a Poisson curve with rate = median count rate of data. |
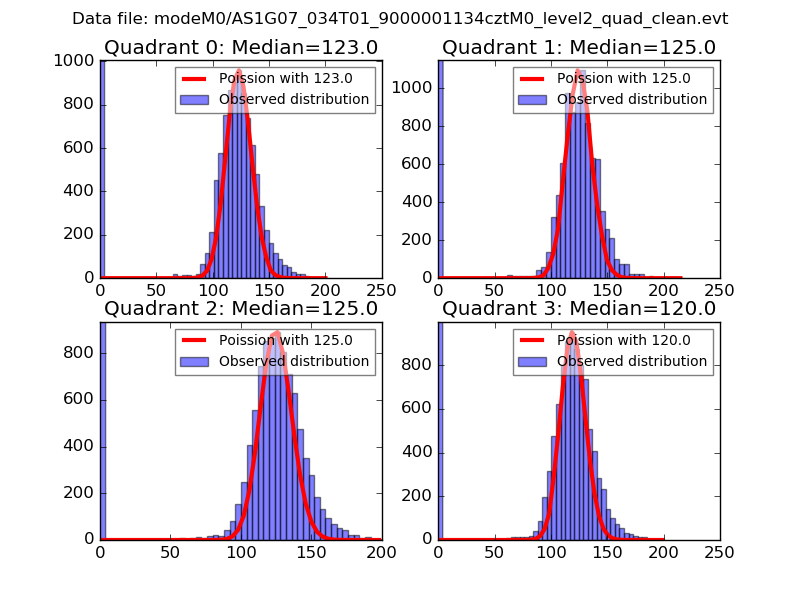 |
 |
| Quadrant-wise count rates Data is divided into 100 sec bins |
 |
|
| Module-wise count rates for Quadrant A Data is divided into 100 sec bins |
 |
 |
| Module-wise count rates for Quadrant B Data is divided into 100 sec bins |
 |
 |
| Module-wise count rates for Quadrant C Data is divided into 100 sec bins |
 |
 |
| Module-wise count rates for Quadrant D Data is divided into 100 sec bins |
 |
 |
| Parameter | Plot |
|---|---|
| CZT HV Monitor |  |
| D_VDD | 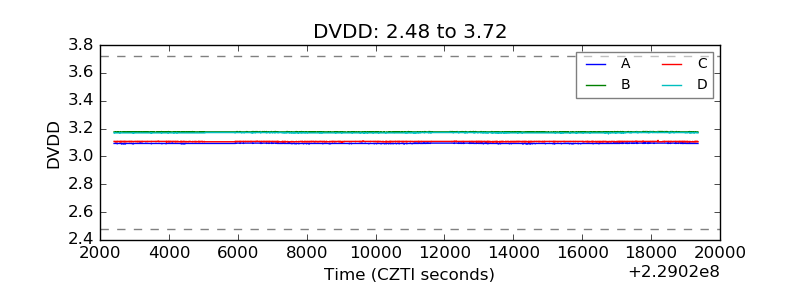 |
| Temperature 1 |  |
| Veto HV Monitor |  |
| Veto LLD |  |
| Alpha Counter |  |
| _CPM_Rate |  |
| CZT Counter | 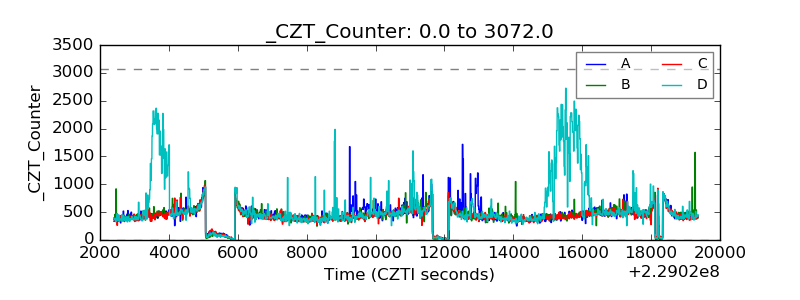 |
| +2.5 Volts monitor | 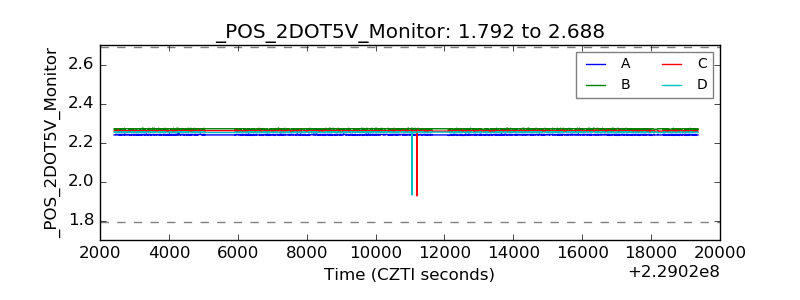 |
| +5 Volts monitor | 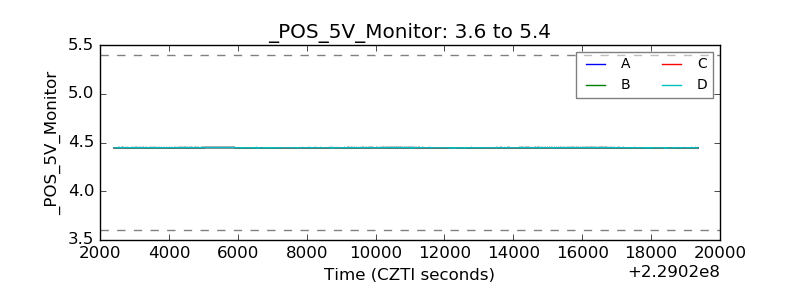 |
| _ROLL_ROT |  |
| _Roll_DEC |  |
| _Roll_RA | 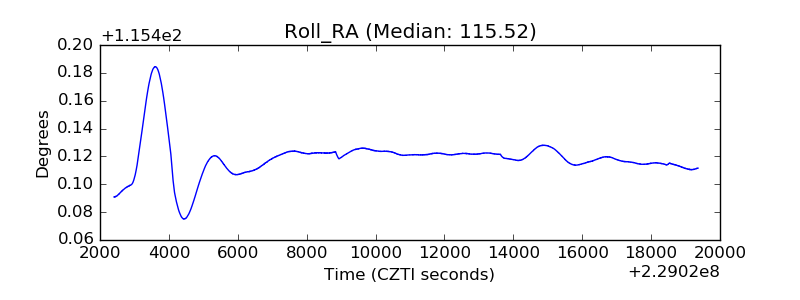 |
| Veto Counter |  |