| Param | Original file | Final file |
|---|---|---|
| Filename | modeM0/AS1G07_034T01_9000001134_08209cztM0_level2.evt | modeM0/AS1G07_034T01_9000001134_08209cztM0_level2_quad_clean.evt |
| Size (bytes) | 285,042,240 | 41,071,680 |
| Size | 271.8 MB | 39.2 MB |
| Events in quadrant A | 1,920,243 | 240,365 |
| Events in quadrant B | 1,941,875 | 243,125 |
| Events in quadrant C | 1,858,538 | 243,453 |
| Events in quadrant D | 2,638,164 | 233,503 |
| Mode SS | |||
|---|---|---|---|
| Quadrant | BADHDUFLAG | Total packets | Discarded packets |
| A | 0 | 80 | 0 |
| B | 0 | 80 | 0 |
| C | 0 | 80 | 0 |
| D | 0 | 80 | 0 |
| Mode M9 | |||
|---|---|---|---|
| Quadrant | BADHDUFLAG | Total packets | Discarded packets |
| A | 0 | 9 | 0 |
| B | 0 | 9 | 0 |
| C | 0 | 9 | 0 |
| D | 0 | 9 | 0 |
| Mode M0 | |||
|---|---|---|---|
| Quadrant | BADHDUFLAG | Total packets | Discarded packets |
| A | 0 | 8385 | 2 |
| B | 0 | 8409 | 1 |
| C | 0 | 8312 | 1 |
| D | 0 | 10644 | 1 |
| Quadrant | Total seconds | Saturated seconds | Saturation percentage |
|---|---|---|---|
| A | 4015 | 31 | 0.772105% |
| B | 4015 | 39 | 0.971357% |
| C | 4015 | 15 | 0.373599% |
| D | 4015 | 172 | 4.283935% |
Noise dominated data is calculated using 1-second bins in cleaned event files. If a bin has >2000 counts, and if more than 50% of those come from <1% of pixels, then it is considered to be noise-dominated and hence unusable.
| Quadrant | # 1 sec bins | Bins with >0 counts | Bins with >2000 counts | High rate bins dominated by noise | Noise dominated (total time) | Noise dominated (detector-on time) | Marked lightcurve |
|---|---|---|---|---|---|---|---|
| A | 4875 | 4016 | 0 | 0 | 0.00% | 0.00% | 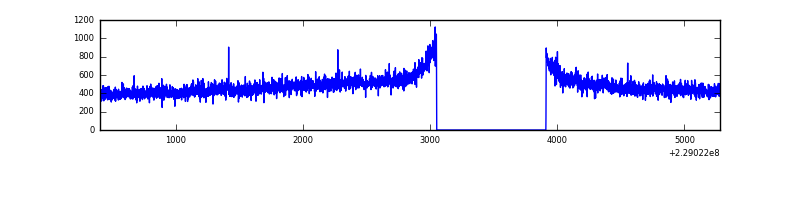 |
| B | 4875 | 4016 | 0 | 0 | 0.00% | 0.00% | 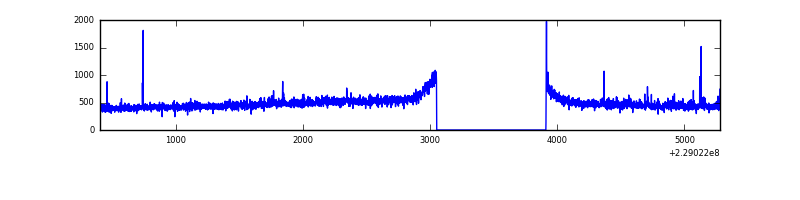 |
| C | 4875 | 4016 | 0 | 0 | 0.00% | 0.00% | 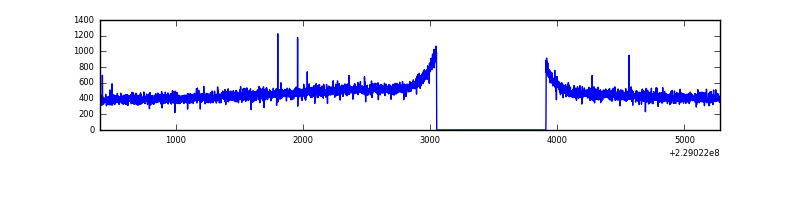 |
| D | 4875 | 4016 | 159 | 159 | 3.26% | 3.96% | 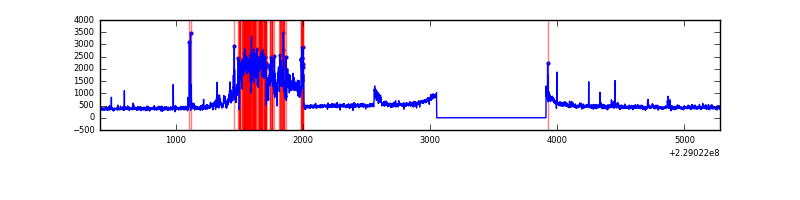 |
Top three noisy pixels from each quadrant. If the there are fewer than three noisy pixels in the level2.evt file, extra rows are filled as -1
| Pixel properties | Quadrant properties | ||||||
|---|---|---|---|---|---|---|---|
| Quadrant | DetID | PixID | Counts | Sigma | Mean | Median | Sigma |
| A | 8 | 15 | 29581 | 285.22 | 489 | 478 | 102.0 |
| A | 4 | 2 | 7007 | 63.99 | 489 | 478 | 102.0 |
| A | 0 | 226 | 4539 | 39.8 | 489 | 478 | 102.0 |
| B | 12 | 111 | 10026 | 98.99 | 493 | 480 | 96.4 |
| B | 10 | 16 | 9011 | 88.46 | 493 | 480 | 96.4 |
| B | 0 | 245 | 8404 | 82.17 | 493 | 480 | 96.4 |
| C | 13 | 61 | 3722 | 28.87 | 475 | 478 | 112.4 |
| C | 14 | 67 | 3409 | 26.08 | 475 | 478 | 112.4 |
| C | 1 | 16 | 1280 | 7.14 | 475 | 478 | 112.4 |
| D | 1 | 7 | 753933 | 6484.69 | 471 | 455 | 116.2 |
| D | 2 | 14 | 28337 | 239.96 | 471 | 455 | 116.2 |
| D | 12 | 233 | 27061 | 228.98 | 471 | 455 | 116.2 |
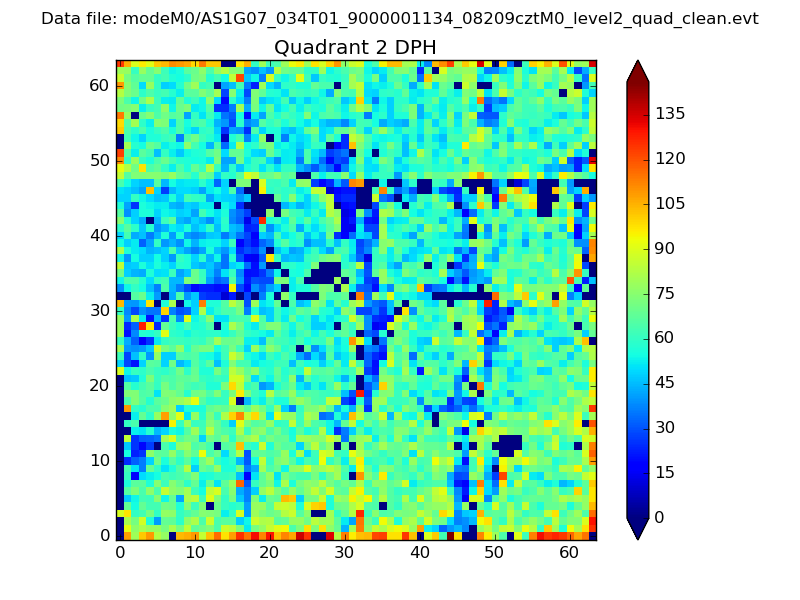
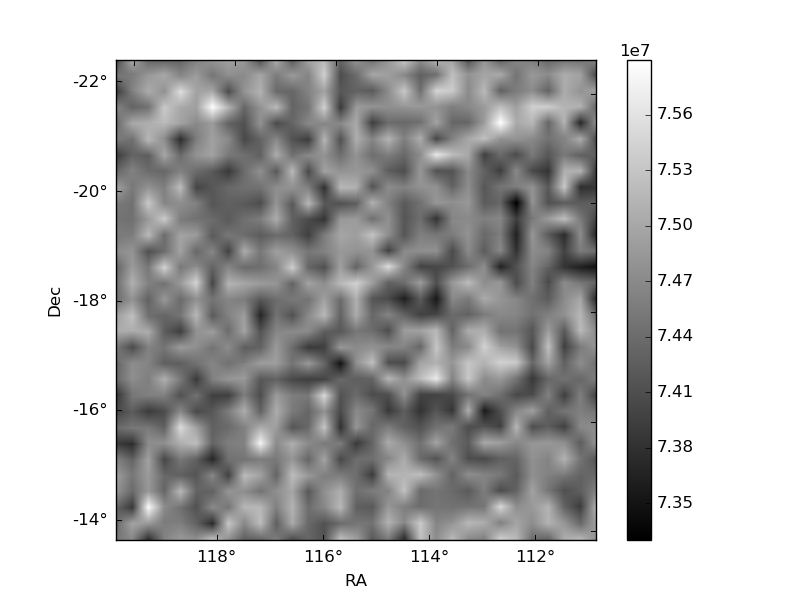
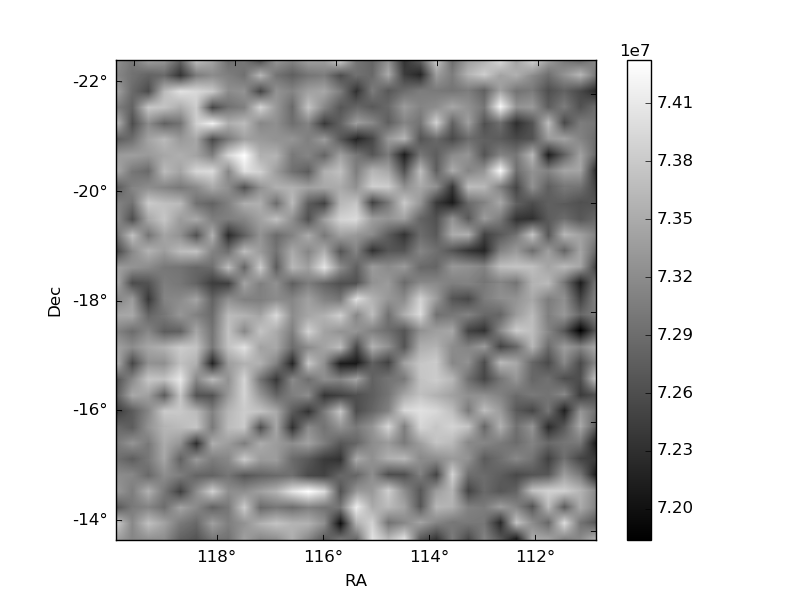
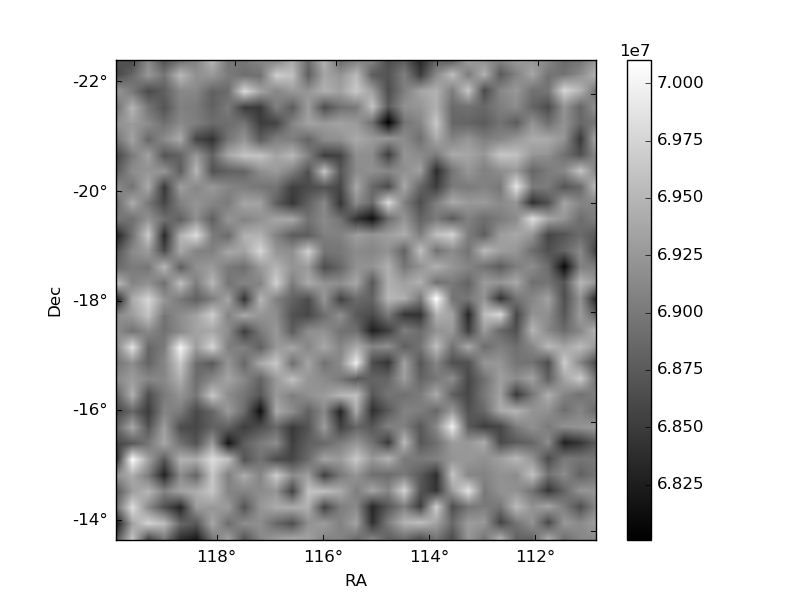
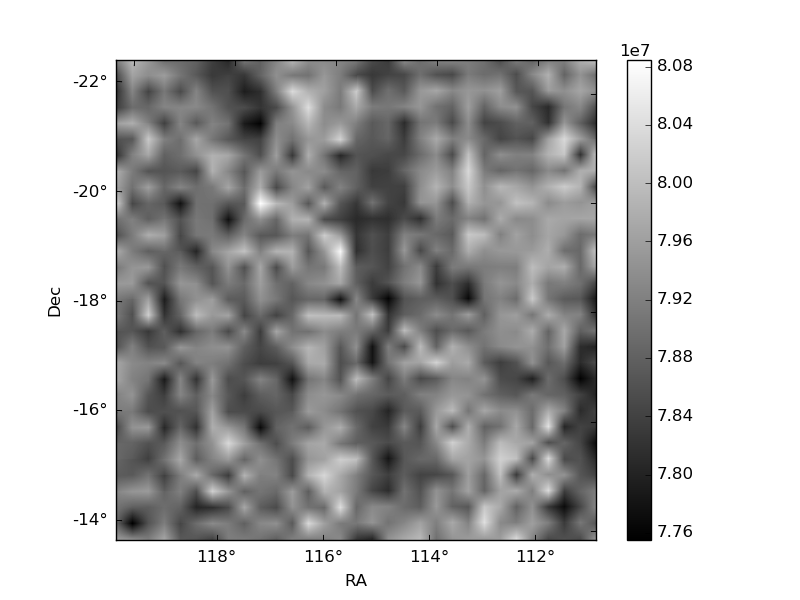
Histogram calculated using DETX and DETY for each event in the final _common_clean file
| Quadrant A | 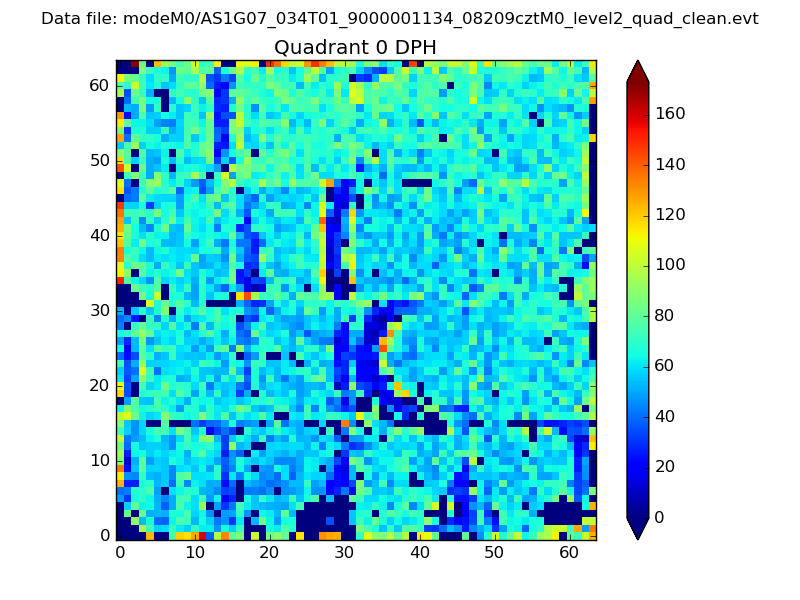 |
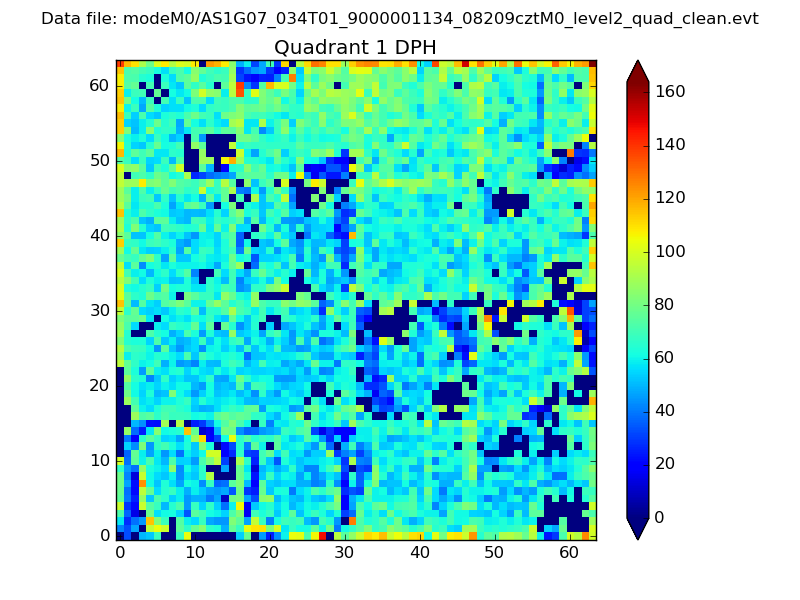 |
Quadrant B |
|---|---|---|---|
| Quadrant D | 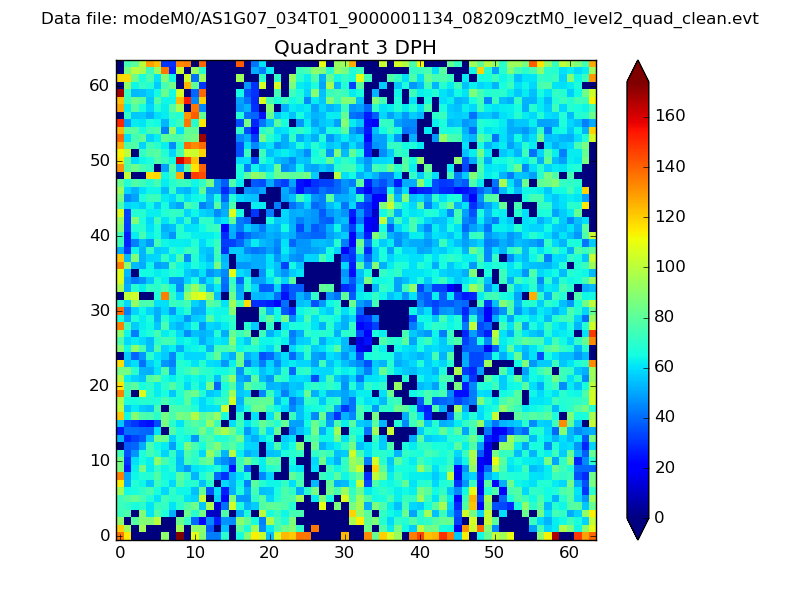 |
 |
Quadrant C |
| Plot type | Count rate plots | Images |
|---|---|---|
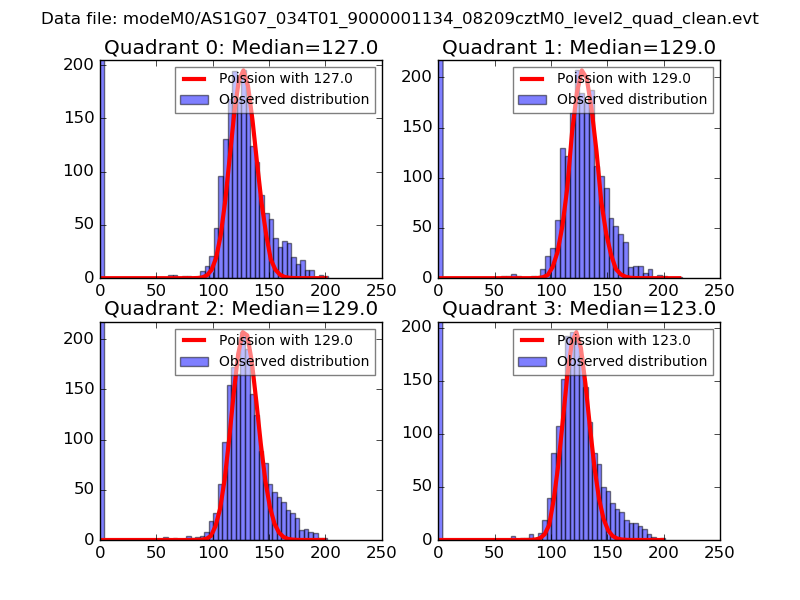
| Comparison with Poisson distribution Blue bars denote a histogram of data divided into 1 sec bins. Red curve is a Poisson curve with rate = median count rate of data. |
 |
 |
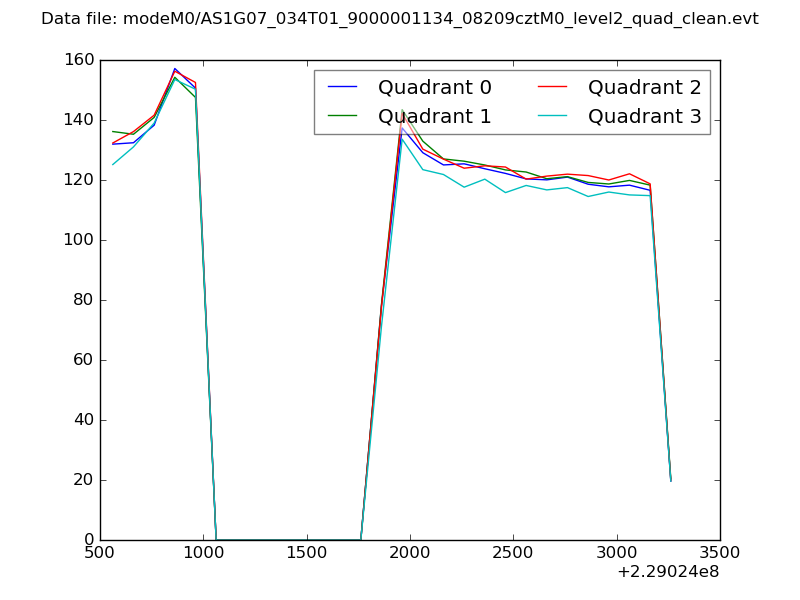
| Quadrant-wise count rates Data is divided into 100 sec bins |
 |
|
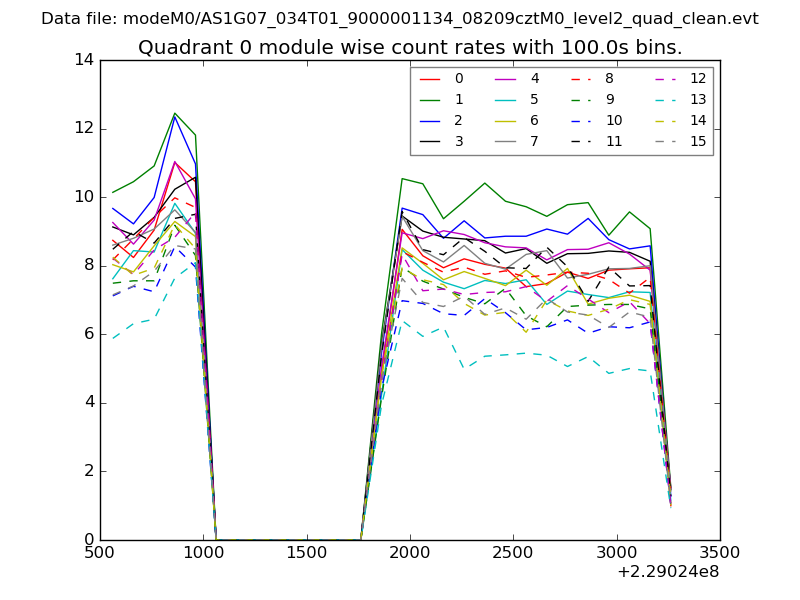
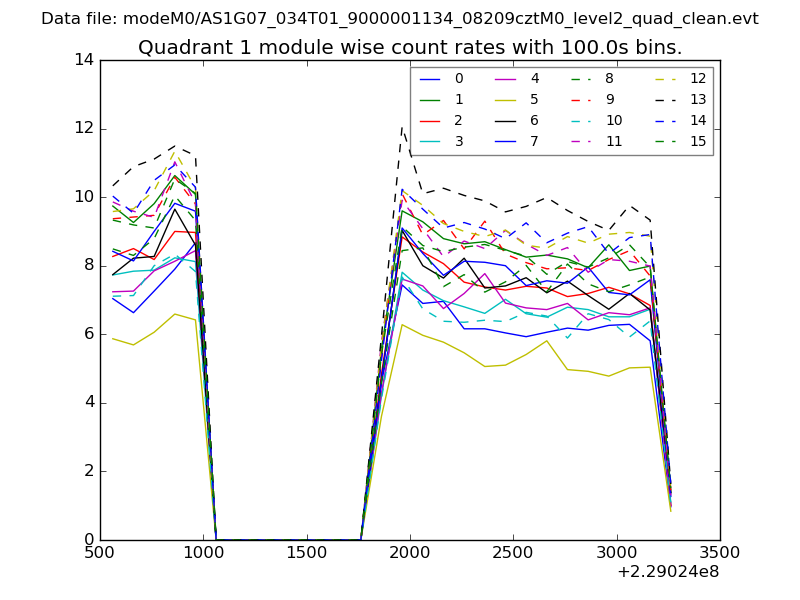
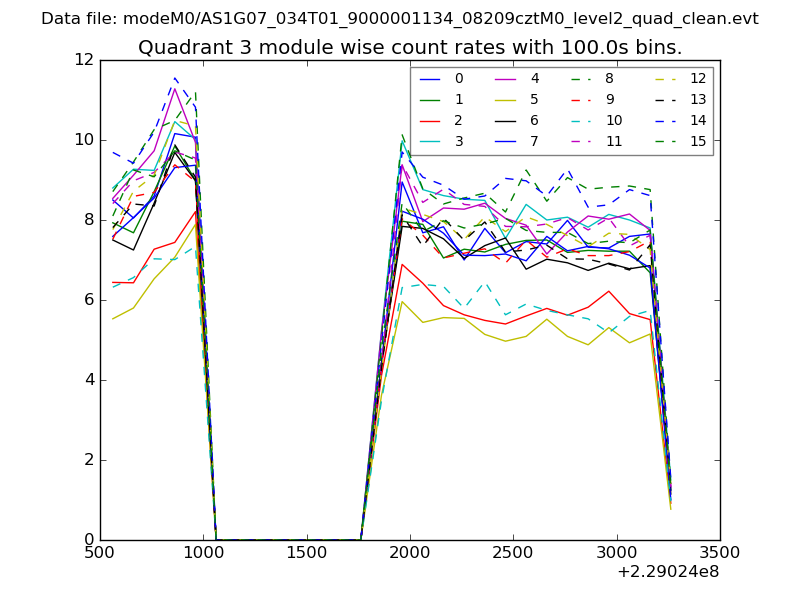
| Module-wise count rates for Quadrant A Data is divided into 100 sec bins |
 |
 |
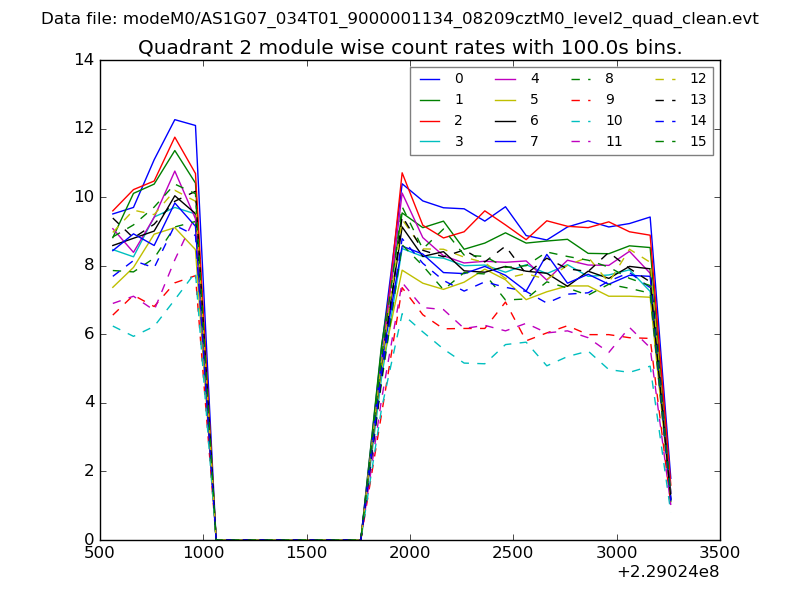
| Module-wise count rates for Quadrant B Data is divided into 100 sec bins |
 |
 |
| Module-wise count rates for Quadrant C Data is divided into 100 sec bins |
 |
 |
| Module-wise count rates for Quadrant D Data is divided into 100 sec bins |
 |
 |
| Parameter | Plot |
|---|---|
| CZT HV Monitor | 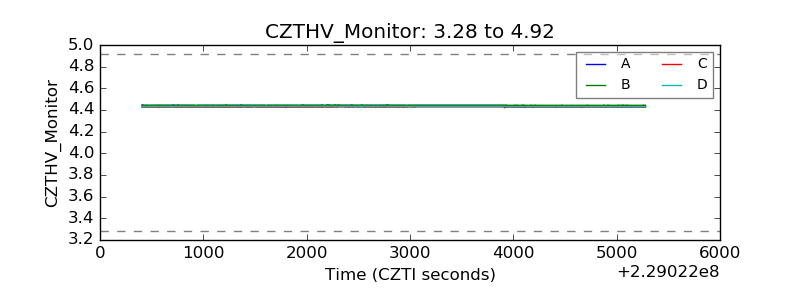 |
| D_VDD | 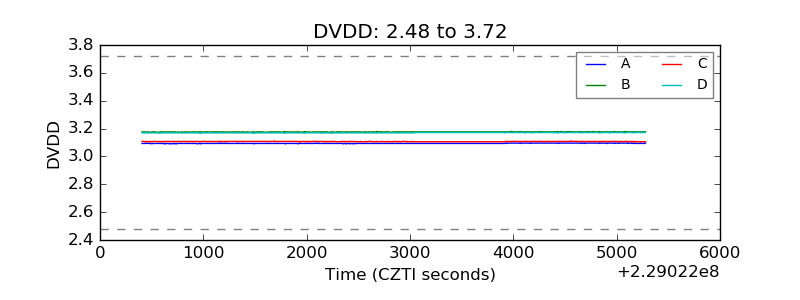 |
| Temperature 1 | 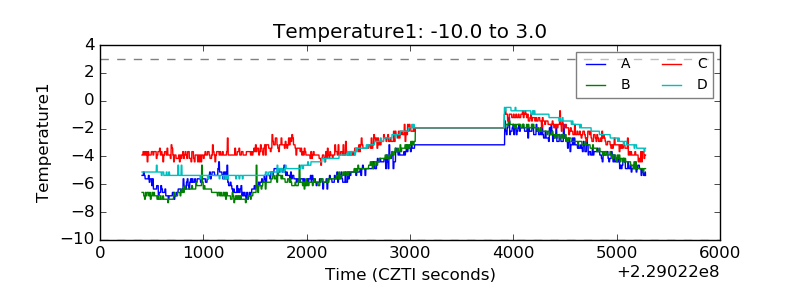 |
| Veto HV Monitor | 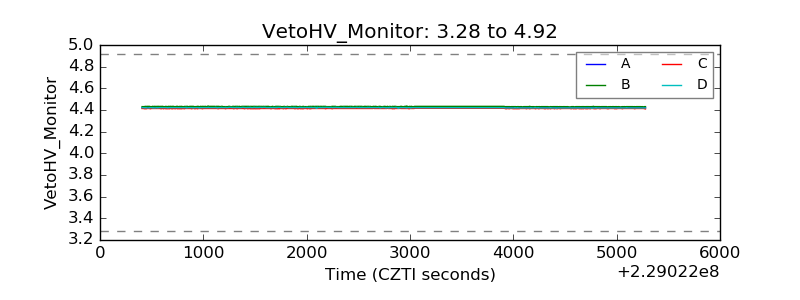 |
| Veto LLD | 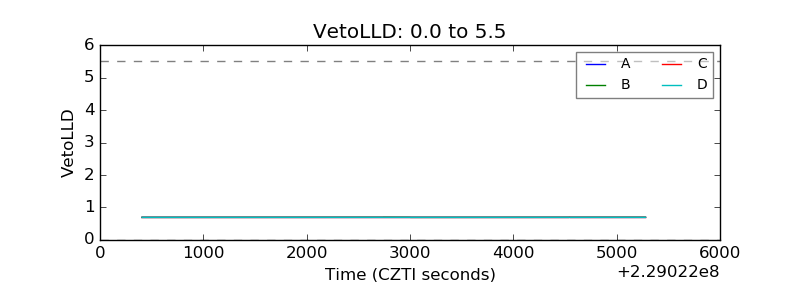 |
| Alpha Counter | 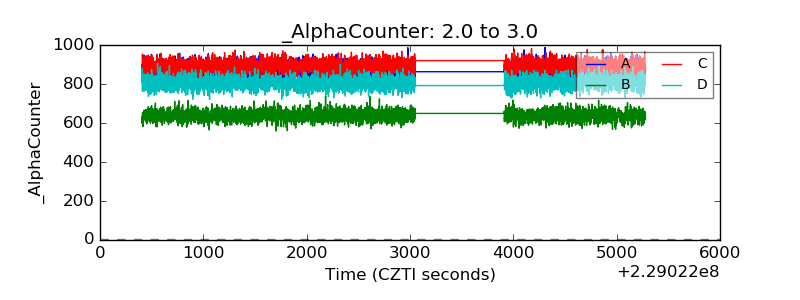 |
| _CPM_Rate | 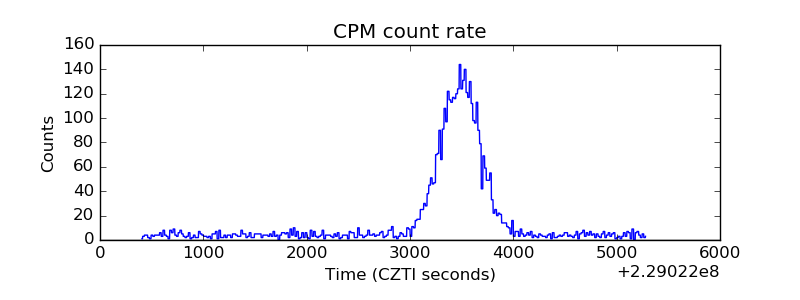 |
| CZT Counter | 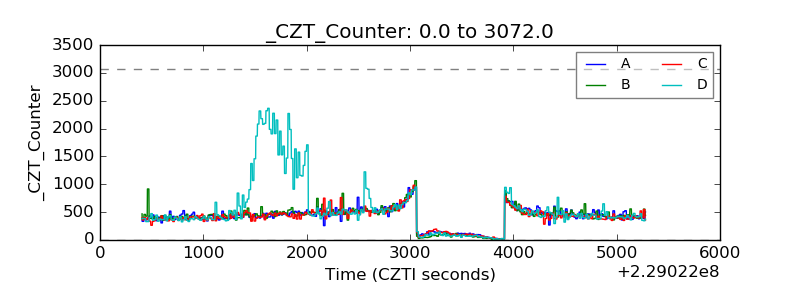 |
| +2.5 Volts monitor |  |
| +5 Volts monitor | 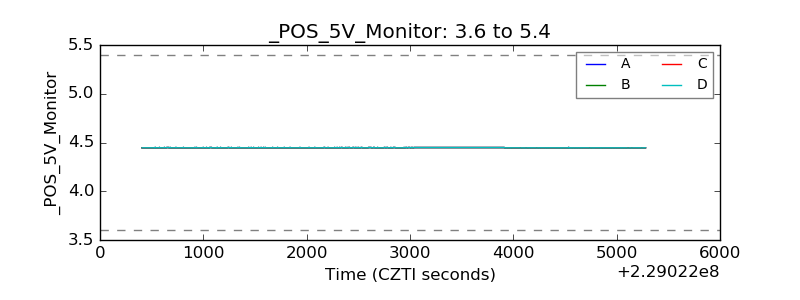 |
| _ROLL_ROT | 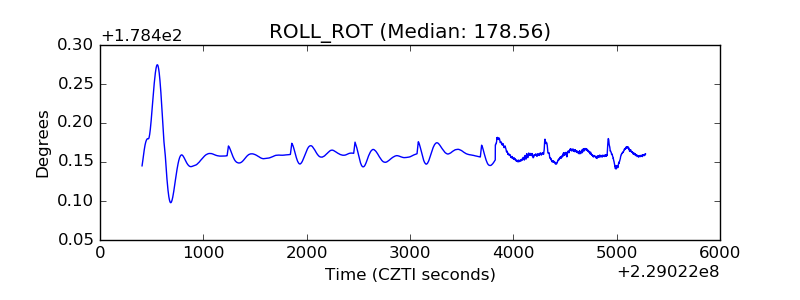 |
| _Roll_DEC | 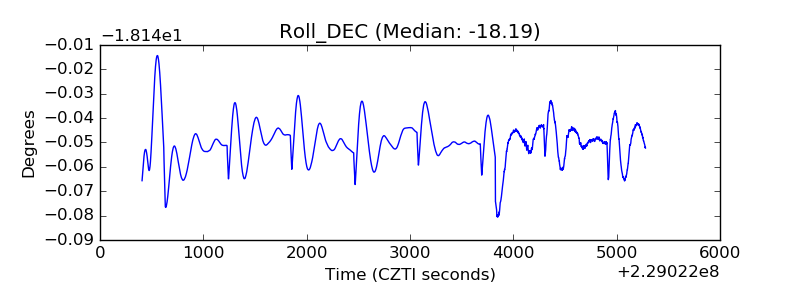 |
| _Roll_RA | 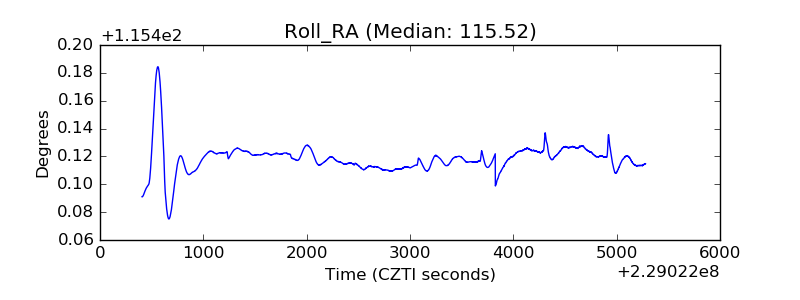 |
| Veto Counter | 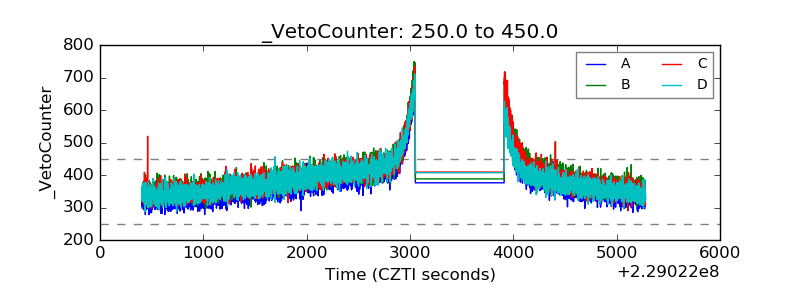 |