| Param | Original file | Final file |
|---|---|---|
| Filename | modeM0/AS1G07_034T01_9000001134_08211cztM0_level2.evt | modeM0/AS1G07_034T01_9000001134_08211cztM0_level2_quad_clean.evt |
| Size (bytes) | 546,791,040 | 106,390,080 |
| Size | 521.5 MB | 101.5 MB |
| Events in quadrant A | 3,733,772 | 668,079 |
| Events in quadrant B | 3,713,589 | 680,890 |
| Events in quadrant C | 3,467,738 | 683,653 |
| Events in quadrant D | 5,125,431 | 657,485 |
| Mode SS | |||
|---|---|---|---|
| Quadrant | BADHDUFLAG | Total packets | Discarded packets |
| A | 0 | 158 | 0 |
| B | 0 | 158 | 0 |
| C | 0 | 158 | 0 |
| D | 0 | 158 | 0 |
| Mode M9 | |||
|---|---|---|---|
| Quadrant | BADHDUFLAG | Total packets | Discarded packets |
| A | 0 | 6 | 0 |
| B | 0 | 6 | 0 |
| C | 0 | 6 | 0 |
| D | 0 | 6 | 0 |
| Mode M0 | |||
|---|---|---|---|
| Quadrant | BADHDUFLAG | Total packets | Discarded packets |
| A | 0 | 16417 | 3 |
| B | 0 | 16241 | 3 |
| C | 0 | 15752 | 3 |
| D | 0 | 20567 | 3 |
| Quadrant | Total seconds | Saturated seconds | Saturation percentage |
|---|---|---|---|
| A | 7645 | 85 | 1.111838% |
| B | 7645 | 102 | 1.334205% |
| C | 7645 | 41 | 0.536298% |
| D | 7645 | 364 | 4.761282% |
Noise dominated data is calculated using 1-second bins in cleaned event files. If a bin has >2000 counts, and if more than 50% of those come from <1% of pixels, then it is considered to be noise-dominated and hence unusable.
| Quadrant | # 1 sec bins | Bins with >0 counts | Bins with >2000 counts | High rate bins dominated by noise | Noise dominated (total time) | Noise dominated (detector-on time) | Marked lightcurve |
|---|---|---|---|---|---|---|---|
| A | 8320 | 7649 | 7 | 7 | 0.08% | 0.09% | 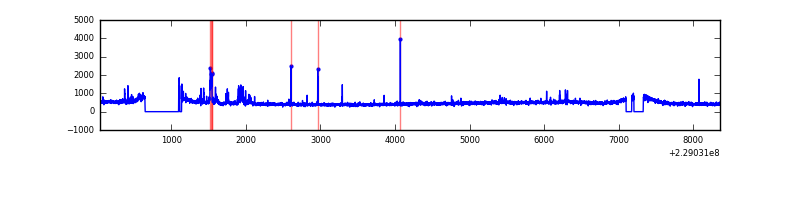 |
| B | 8320 | 7649 | 6 | 6 | 0.07% | 0.08% | 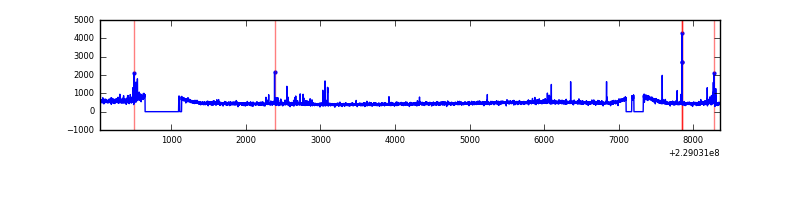 |
| C | 8320 | 7649 | 0 | 0 | 0.00% | 0.00% | 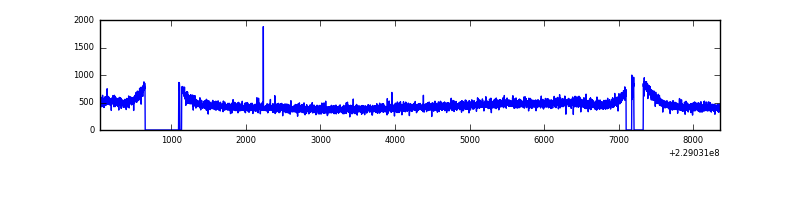 |
| D | 8320 | 7649 | 335 | 335 | 4.03% | 4.38% |  |
Top three noisy pixels from each quadrant. If the there are fewer than three noisy pixels in the level2.evt file, extra rows are filled as -1
| Pixel properties | Quadrant properties | ||||||
|---|---|---|---|---|---|---|---|
| Quadrant | DetID | PixID | Counts | Sigma | Mean | Median | Sigma |
| A | 5 | 112 | 174441 | 926.74 | 913 | 889 | 187.3 |
| A | 5 | 16 | 27920 | 144.34 | 913 | 889 | 187.3 |
| A | 8 | 15 | 20836 | 106.51 | 913 | 889 | 187.3 |
| B | 0 | 214 | 57166 | 315.42 | 918 | 893 | 178.4 |
| B | 0 | 213 | 38790 | 212.42 | 918 | 893 | 178.4 |
| B | 12 | 111 | 18270 | 97.4 | 918 | 893 | 178.4 |
| C | 13 | 61 | 6763 | 28.53 | 887 | 890 | 205.8 |
| C | 14 | 67 | 4572 | 17.89 | 887 | 890 | 205.8 |
| C | 12 | 4 | 3273 | 11.58 | 887 | 890 | 205.8 |
| D | 1 | 7 | 1422454 | 5966.53 | 873 | 854 | 238.3 |
| D | 1 | 52 | 124867 | 520.49 | 873 | 854 | 238.3 |
| D | 2 | 152 | 105752 | 440.26 | 873 | 854 | 238.3 |
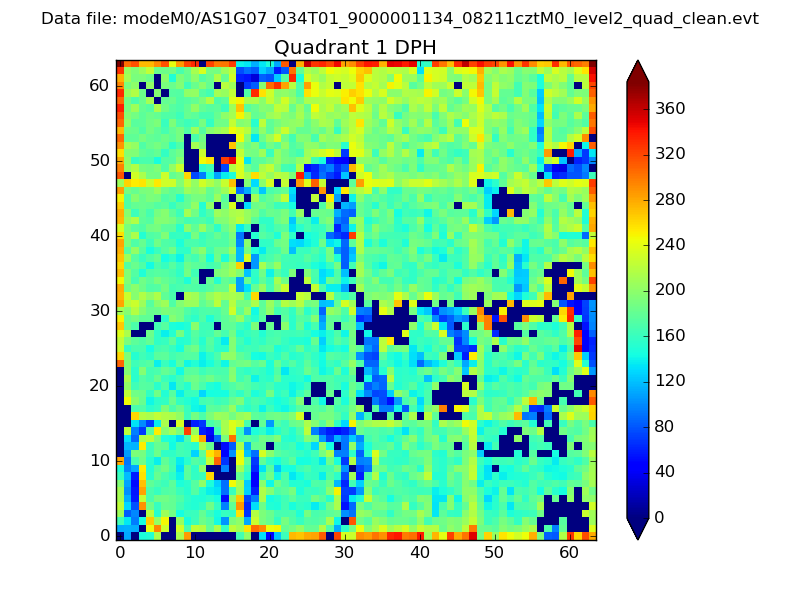
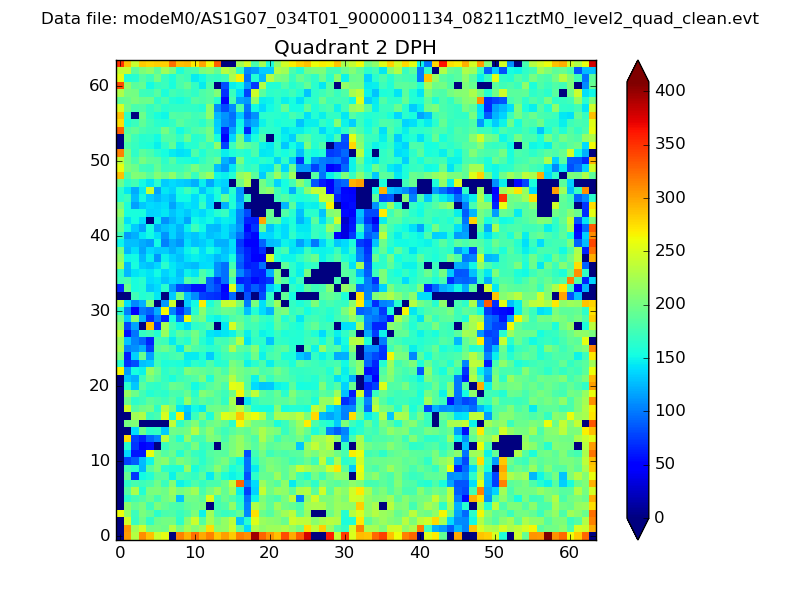
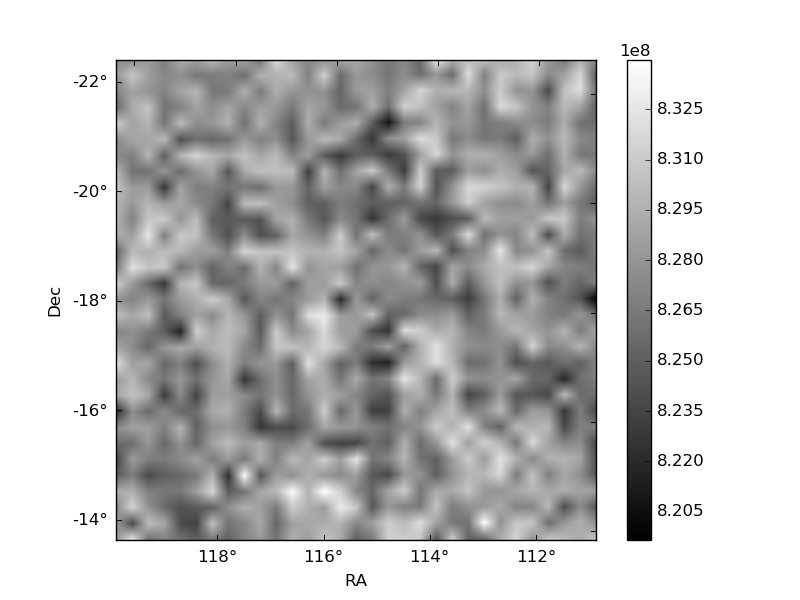
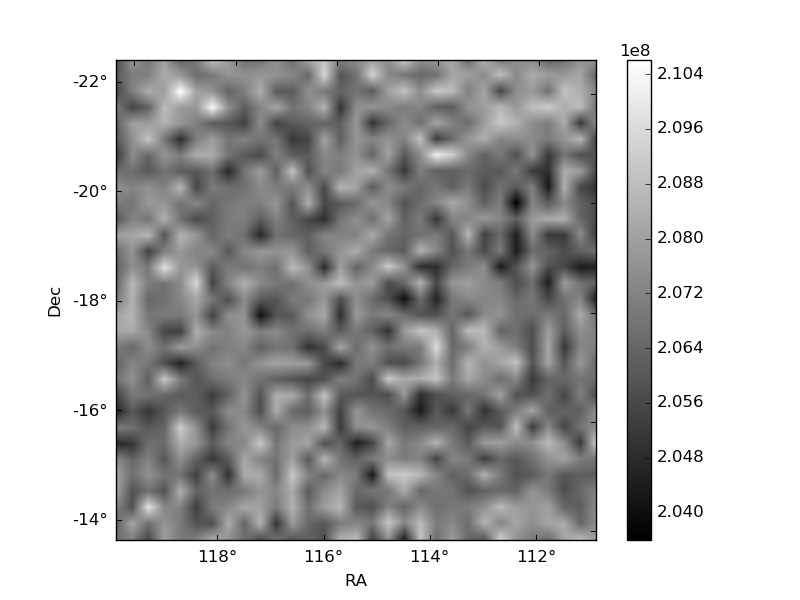
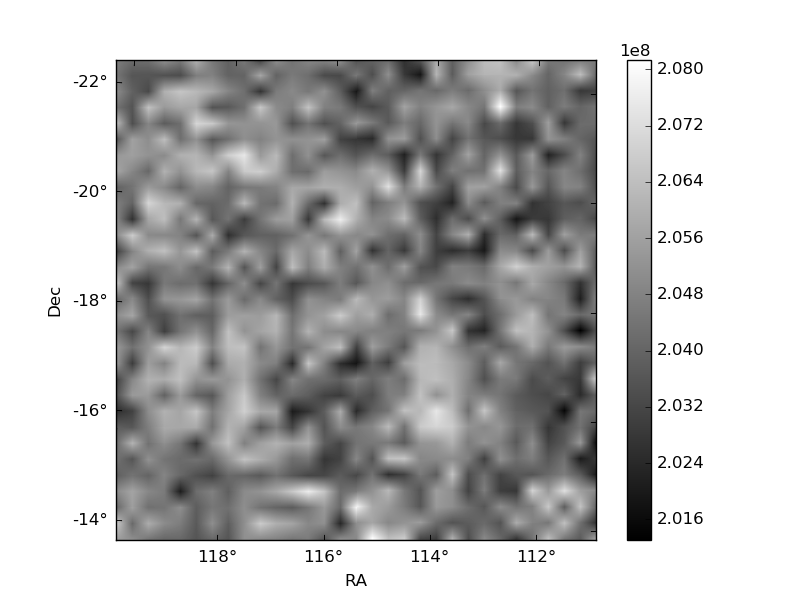
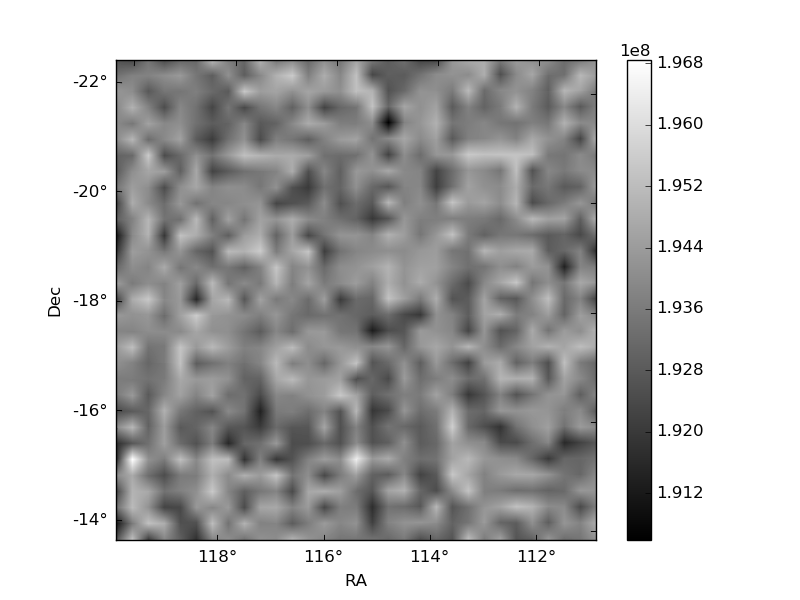
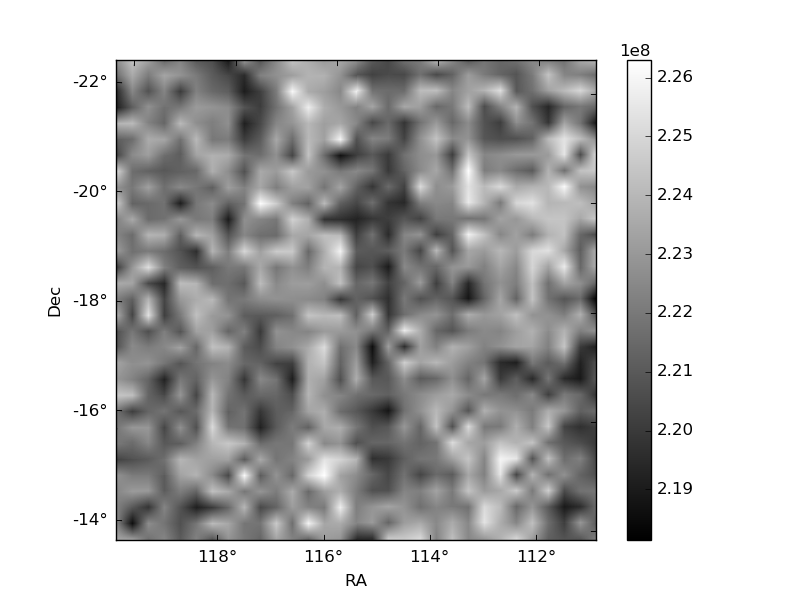
Histogram calculated using DETX and DETY for each event in the final _common_clean file
| Quadrant A | 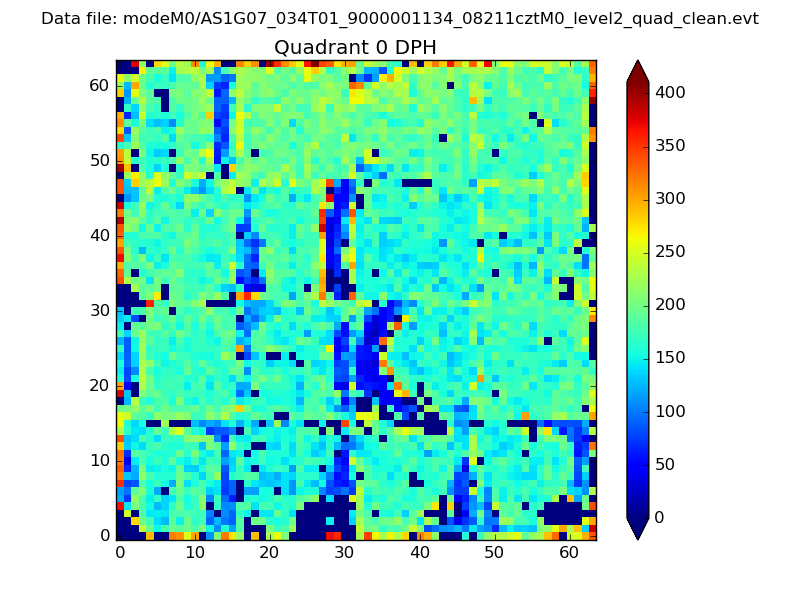 |
 |
Quadrant B |
|---|---|---|---|
| Quadrant D | 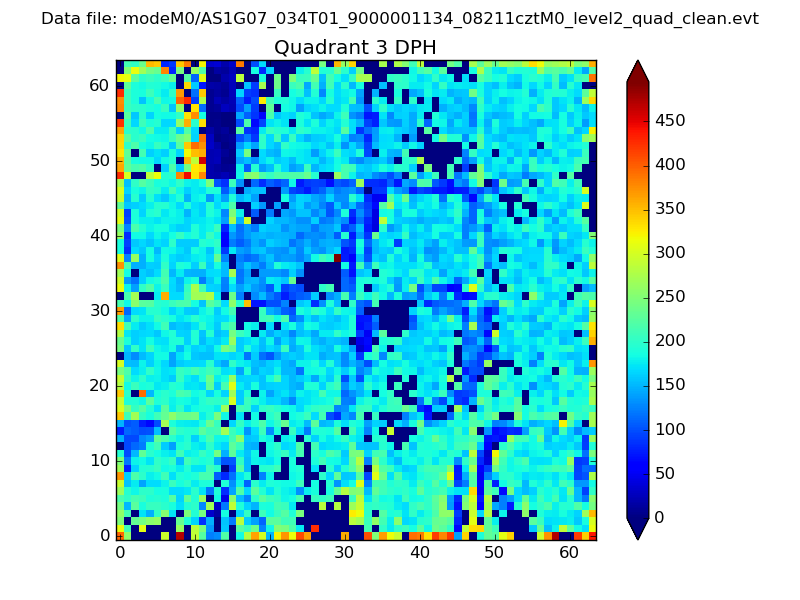 |
 |
Quadrant C |
| Plot type | Count rate plots | Images |
|---|---|---|
| Comparison with Poisson distribution Blue bars denote a histogram of data divided into 1 sec bins. Red curve is a Poisson curve with rate = median count rate of data. |
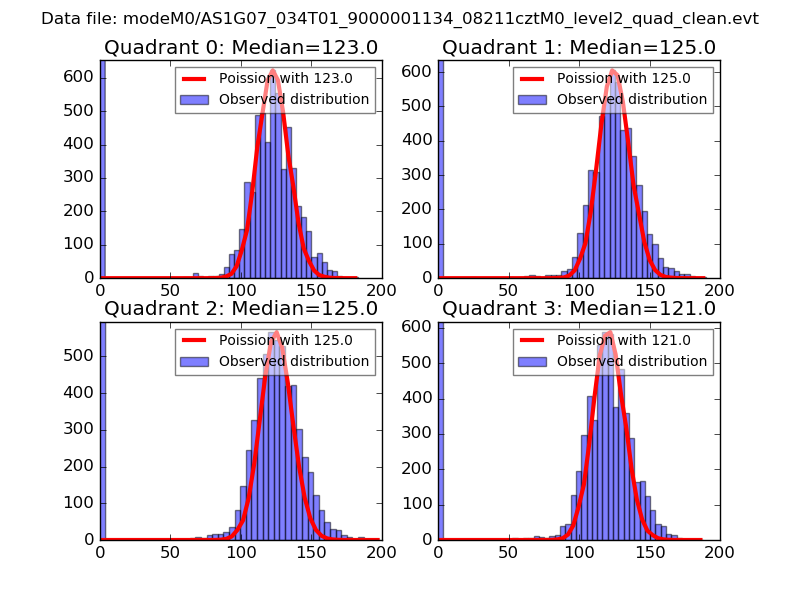 |
 |
| Quadrant-wise count rates Data is divided into 100 sec bins |
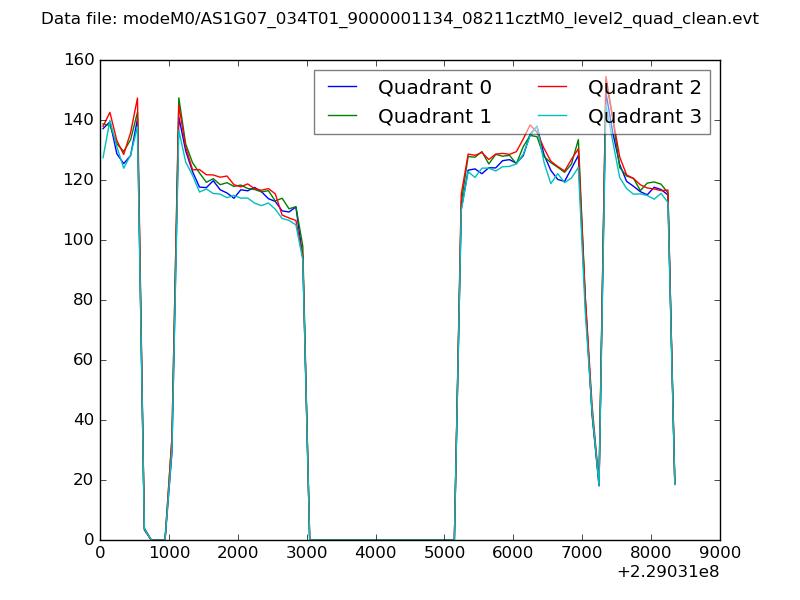 |
|
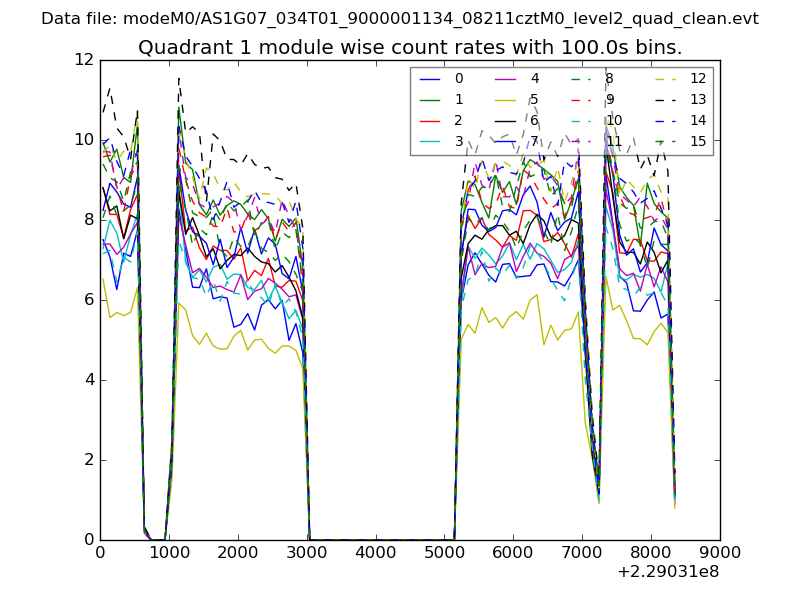
| Module-wise count rates for Quadrant A Data is divided into 100 sec bins |
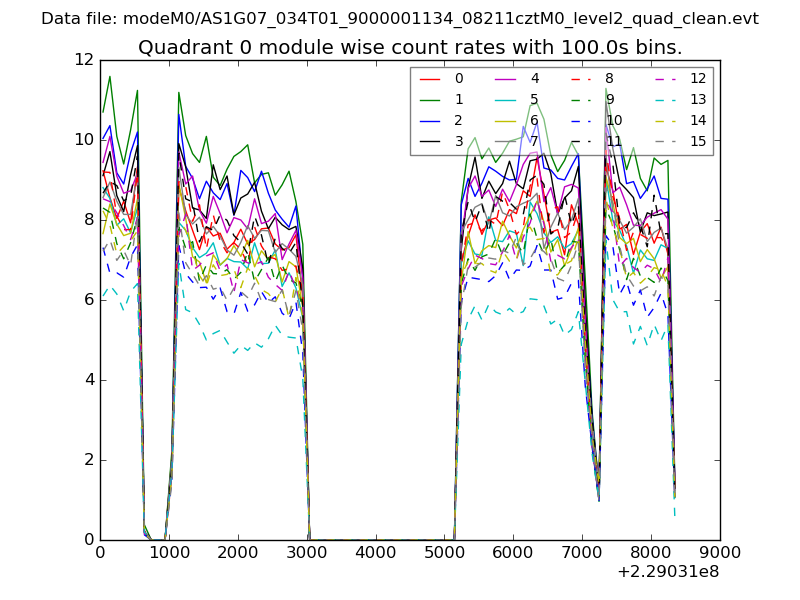 |
 |
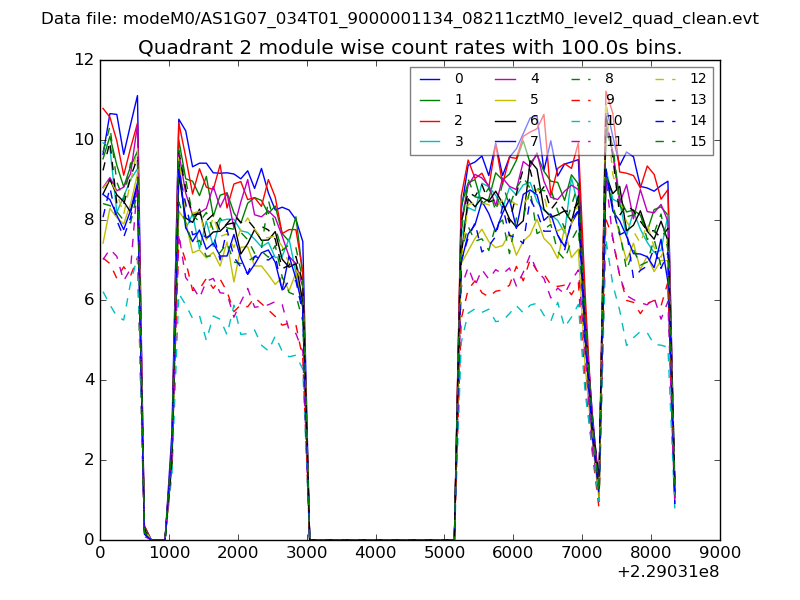
| Module-wise count rates for Quadrant B Data is divided into 100 sec bins |
 |
 |
| Module-wise count rates for Quadrant C Data is divided into 100 sec bins |
 |
 |
| Module-wise count rates for Quadrant D Data is divided into 100 sec bins |
 |
 |
| Parameter | Plot |
|---|---|
| CZT HV Monitor | 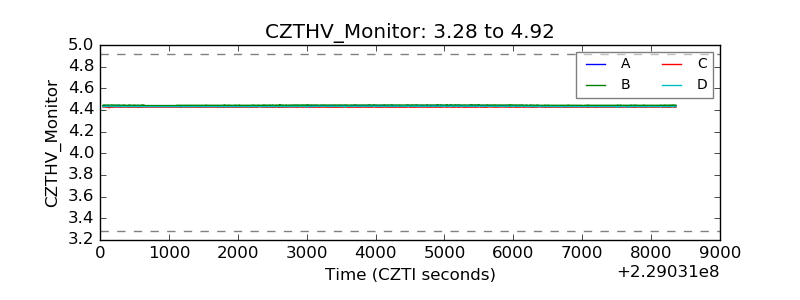 |
| D_VDD |  |
| Temperature 1 | 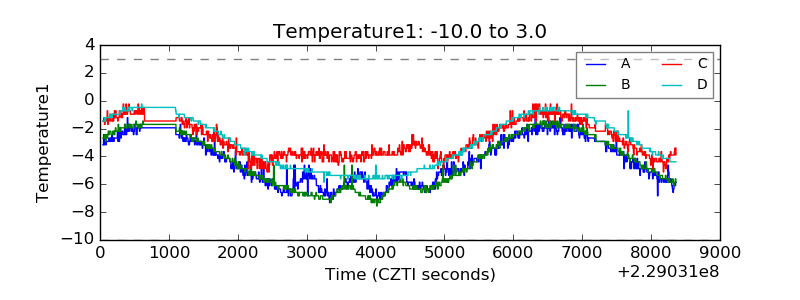 |
| Veto HV Monitor | 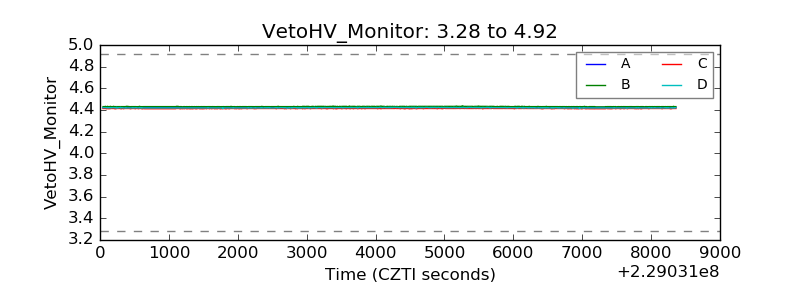 |
| Veto LLD | 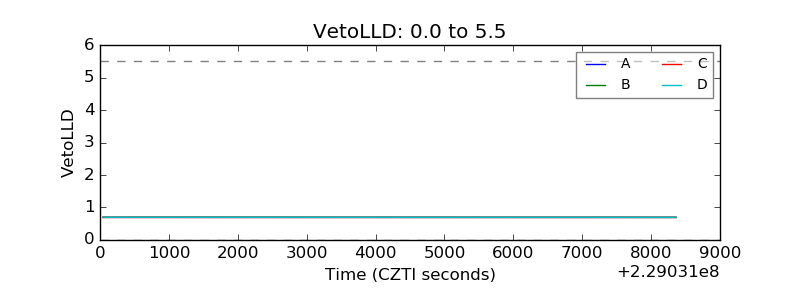 |
| Alpha Counter | 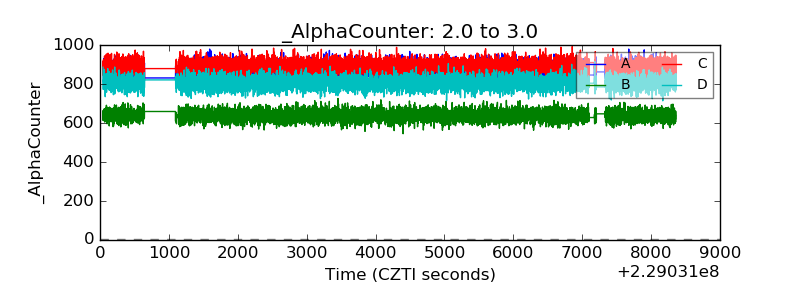 |
| _CPM_Rate | 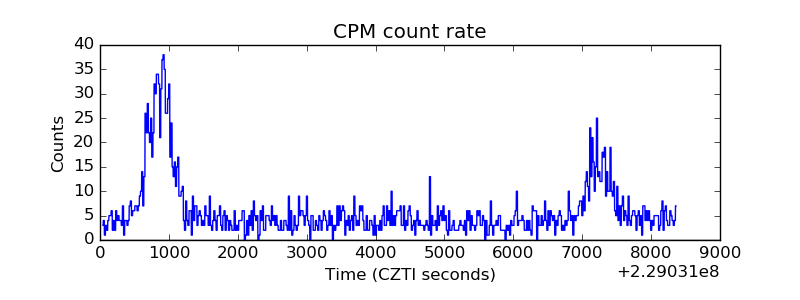 |
| CZT Counter | 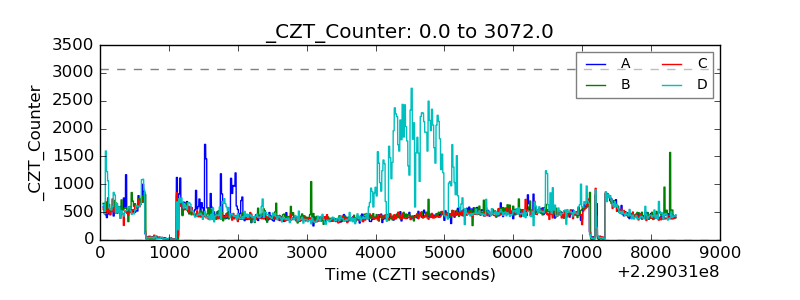 |
| +2.5 Volts monitor |  |
| +5 Volts monitor |  |
| _ROLL_ROT | 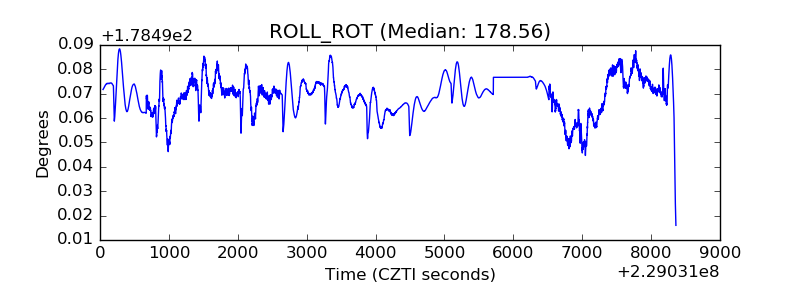 |
| _Roll_DEC | 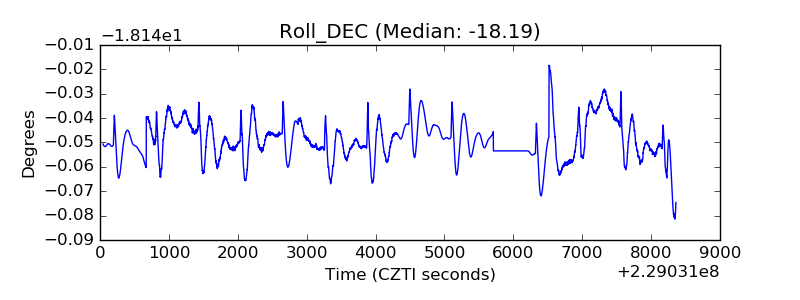 |
| _Roll_RA | 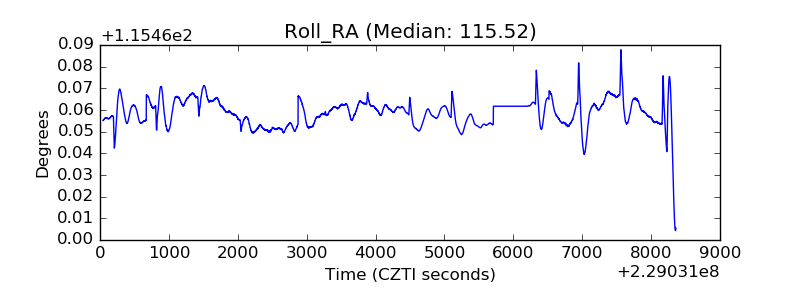 |
| Veto Counter | 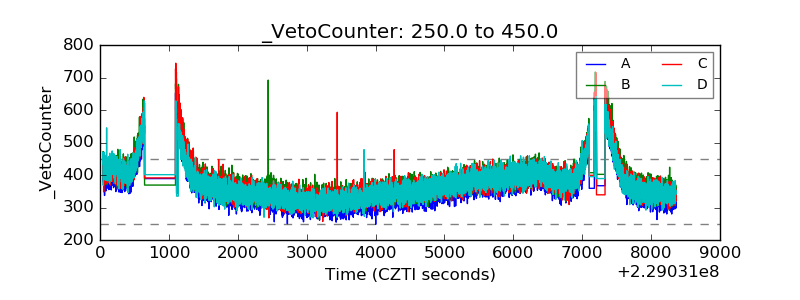 |