| Param | Original file | Final file |
|---|---|---|
| Filename | modeM0/AS1G07_034T01_9000001134_08212cztM0_level2.evt | modeM0/AS1G07_034T01_9000001134_08212cztM0_level2_quad_clean.evt |
| Size (bytes) | 136,762,560 | 37,103,040 |
| Size | 130.4 MB | 35.4 MB |
| Events in quadrant A | 978,295 | 244,529 |
| Events in quadrant B | 1,025,282 | 248,163 |
| Events in quadrant C | 955,780 | 249,181 |
| Events in quadrant D | 1,047,009 | 239,112 |
| Mode SS | |||
|---|---|---|---|
| Quadrant | BADHDUFLAG | Total packets | Discarded packets |
| A | 0 | 42 | 0 |
| B | 0 | 42 | 0 |
| C | 0 | 42 | 0 |
| D | 0 | 42 | 0 |
| Mode M9 | |||
|---|---|---|---|
| Quadrant | BADHDUFLAG | Total packets | Discarded packets |
| A | 0 | 1 | 0 |
| B | 0 | 1 | 0 |
| C | 0 | 1 | 0 |
| D | 0 | 1 | 0 |
| Mode M0 | |||
|---|---|---|---|
| Quadrant | BADHDUFLAG | Total packets | Discarded packets |
| A | 0 | 4209 | 2 |
| B | 0 | 4294 | 2 |
| C | 0 | 4144 | 2 |
| D | 0 | 4387 | 2 |
| Quadrant | Total seconds | Saturated seconds | Saturation percentage |
|---|---|---|---|
| A | 1951 | 46 | 2.357765% |
| B | 1951 | 69 | 3.536648% |
| C | 1951 | 30 | 1.537673% |
| D | 1951 | 25 | 1.281394% |
Noise dominated data is calculated using 1-second bins in cleaned event files. If a bin has >2000 counts, and if more than 50% of those come from <1% of pixels, then it is considered to be noise-dominated and hence unusable.
| Quadrant | # 1 sec bins | Bins with >0 counts | Bins with >2000 counts | High rate bins dominated by noise | Noise dominated (total time) | Noise dominated (detector-on time) | Marked lightcurve |
|---|---|---|---|---|---|---|---|
| A | 2151 | 1953 | 0 | 0 | 0.00% | 0.00% | 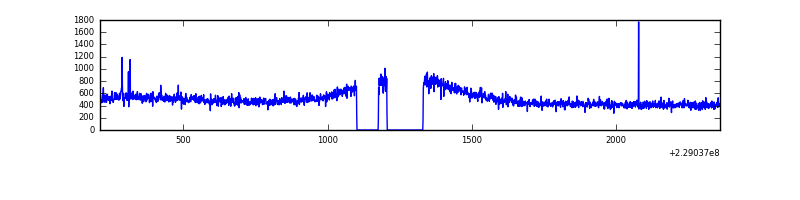 |
| B | 2151 | 1953 | 4 | 4 | 0.19% | 0.20% | 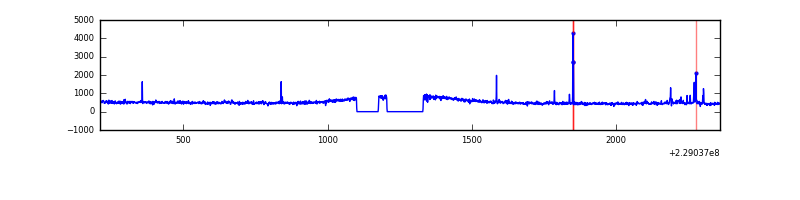 |
| C | 2151 | 1953 | 0 | 0 | 0.00% | 0.00% | 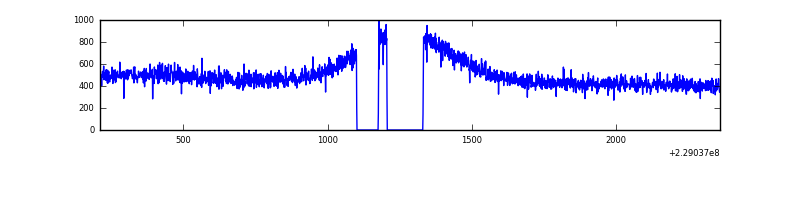 |
| D | 2151 | 1953 | 4 | 4 | 0.19% | 0.20% | 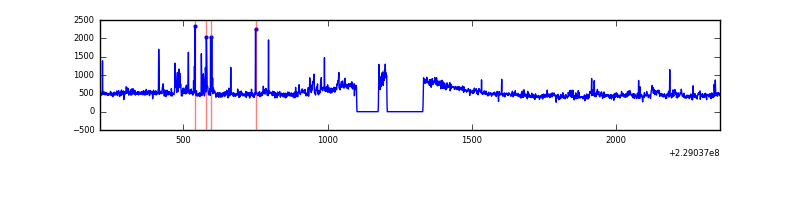 |
Top three noisy pixels from each quadrant. If the there are fewer than three noisy pixels in the level2.evt file, extra rows are filled as -1
| Pixel properties | Quadrant properties | ||||||
|---|---|---|---|---|---|---|---|
| Quadrant | DetID | PixID | Counts | Sigma | Mean | Median | Sigma |
| A | 8 | 15 | 3692 | 63.94 | 252 | 245 | 53.9 |
| A | 5 | 16 | 3134 | 53.59 | 252 | 245 | 53.9 |
| A | 0 | 226 | 2426 | 40.46 | 252 | 245 | 53.9 |
| B | 0 | 213 | 27571 | 531.43 | 252 | 245 | 51.4 |
| B | 0 | 230 | 8669 | 163.83 | 252 | 245 | 51.4 |
| B | 12 | 111 | 4690 | 86.44 | 252 | 245 | 51.4 |
| C | 9 | 68 | 1900 | 28.51 | 244 | 244 | 58.1 |
| C | 13 | 61 | 1869 | 27.98 | 244 | 244 | 58.1 |
| C | 7 | 159 | 1003 | 13.07 | 244 | 244 | 58.1 |
| D | 13 | 105 | 58495 | 934.24 | 246 | 238 | 62.4 |
| D | 2 | 152 | 28906 | 459.74 | 246 | 238 | 62.4 |
| D | 2 | 234 | 7730 | 120.15 | 246 | 238 | 62.4 |
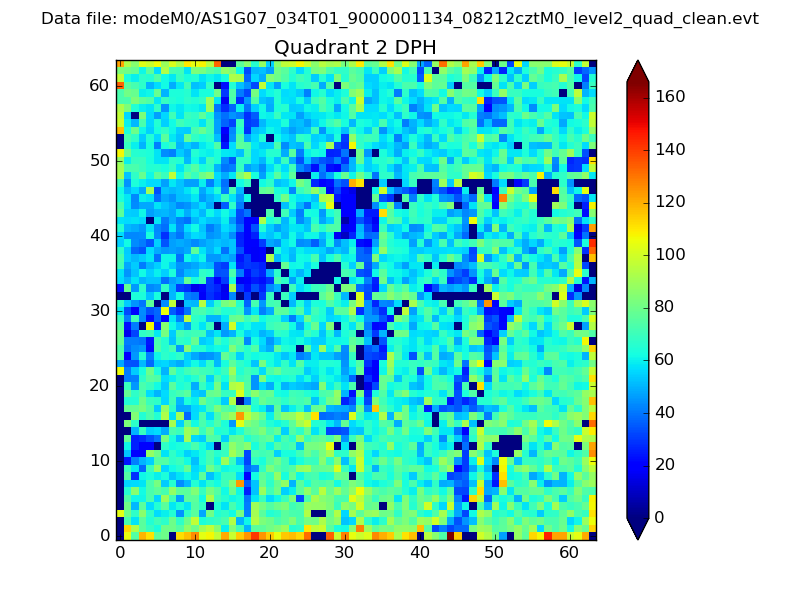
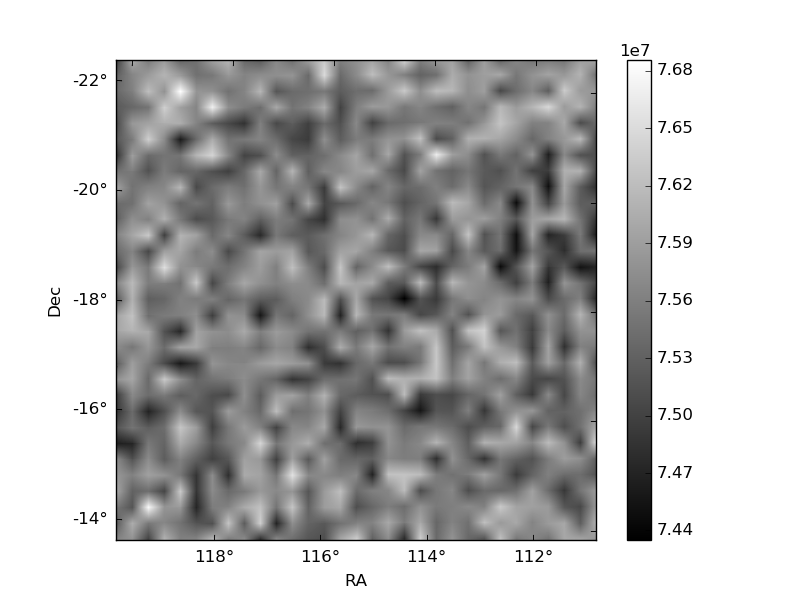
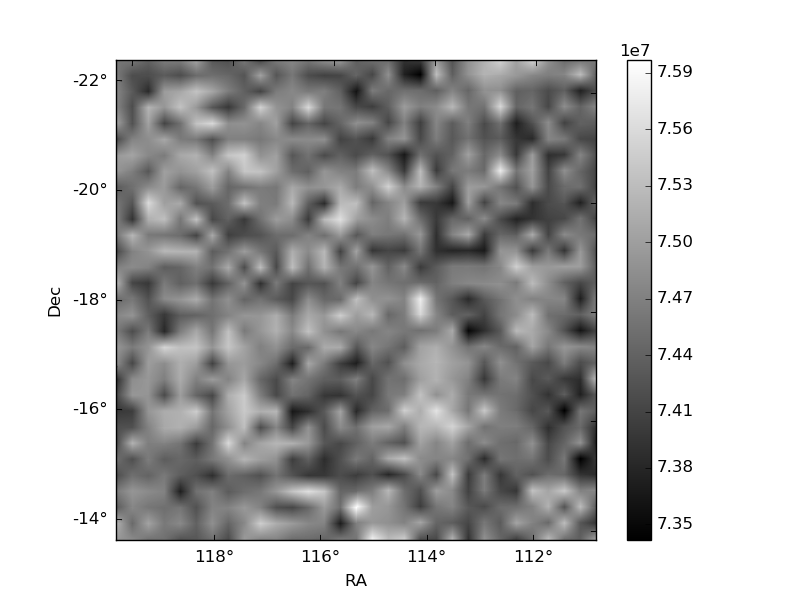
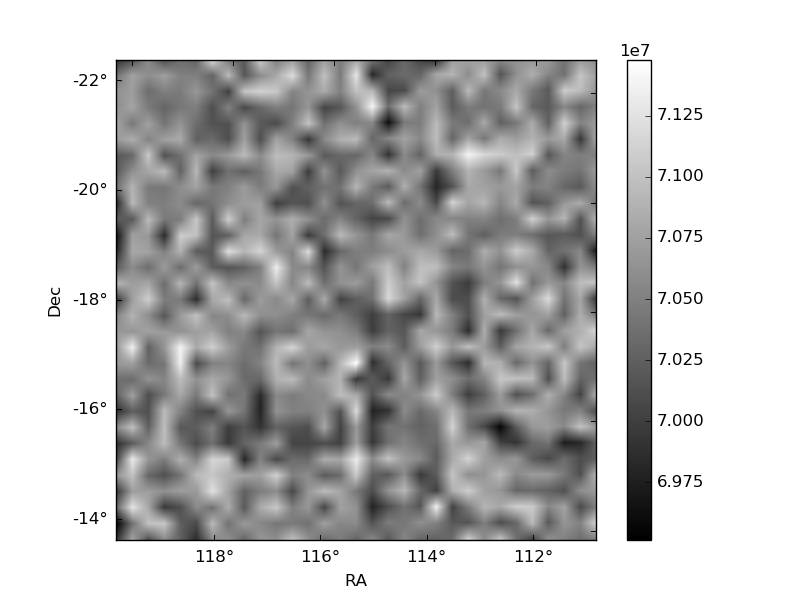
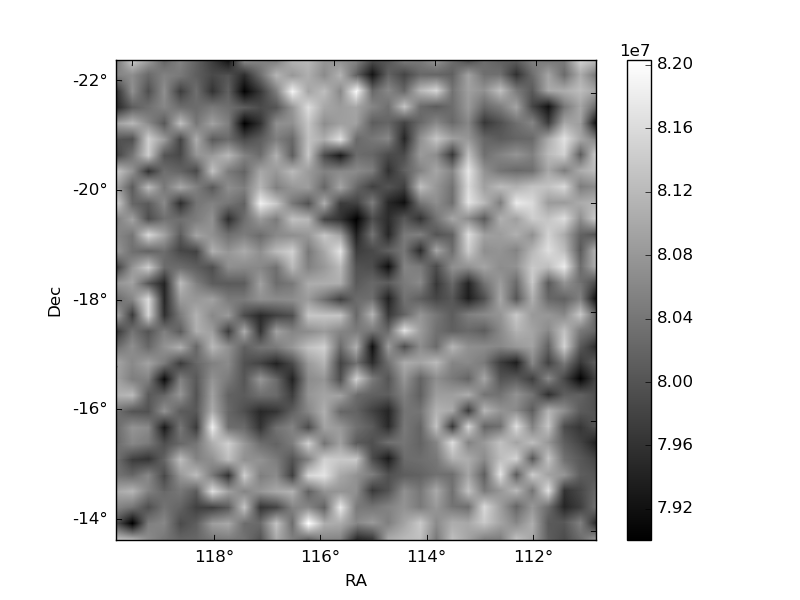
Histogram calculated using DETX and DETY for each event in the final _common_clean file
| Quadrant A | 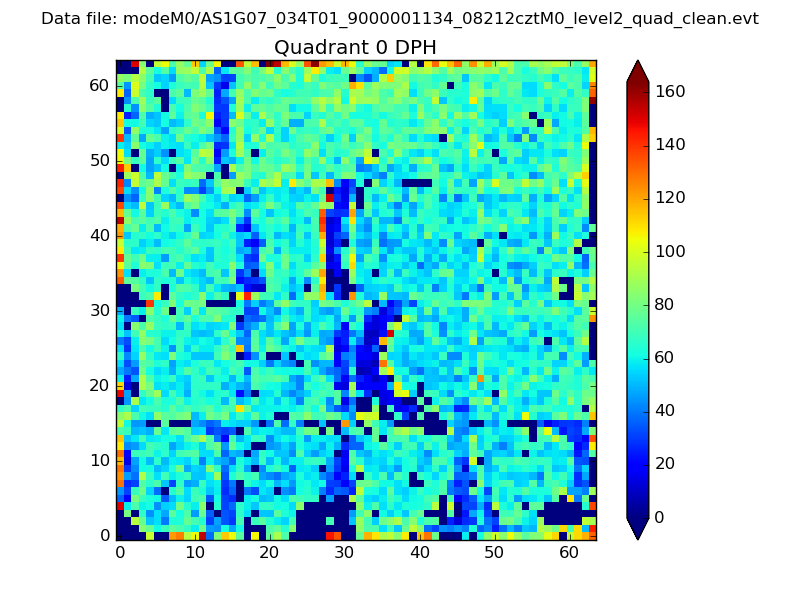 |
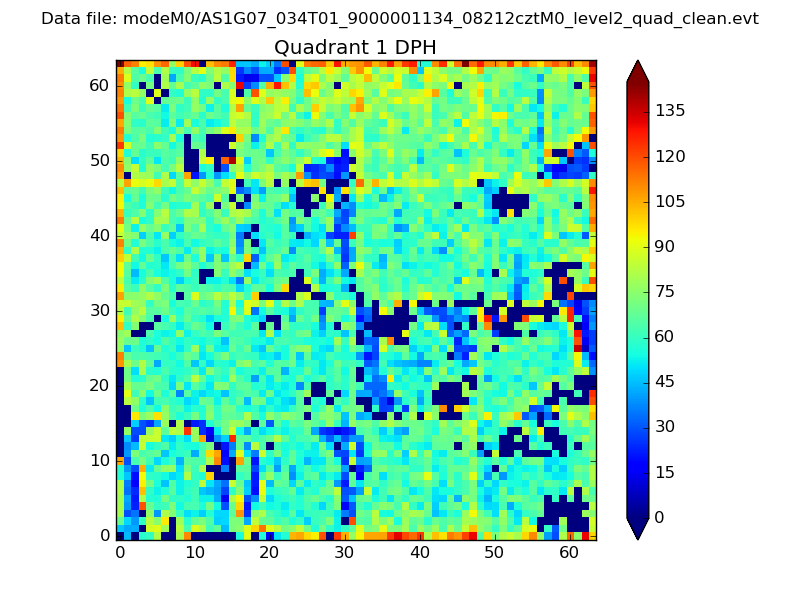 |
Quadrant B |
|---|---|---|---|
| Quadrant D | 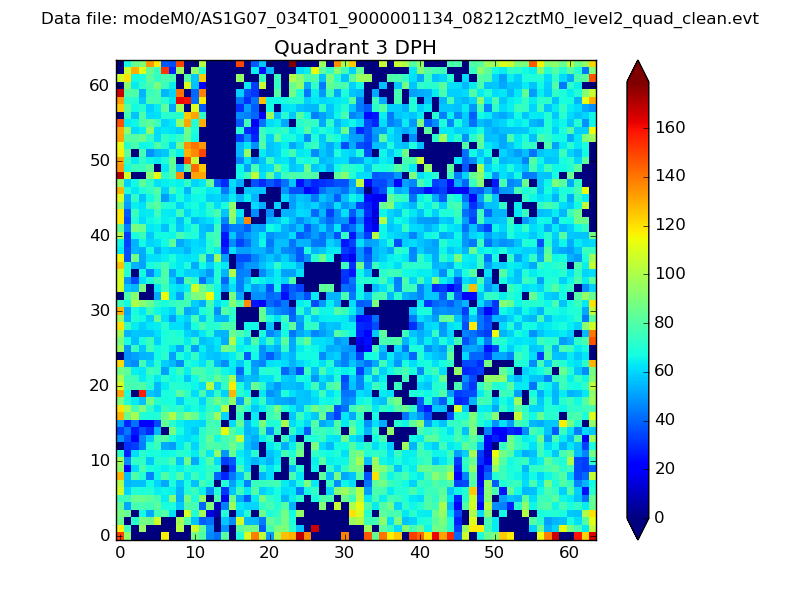 |
 |
Quadrant C |
| Plot type | Count rate plots | Images |
|---|---|---|
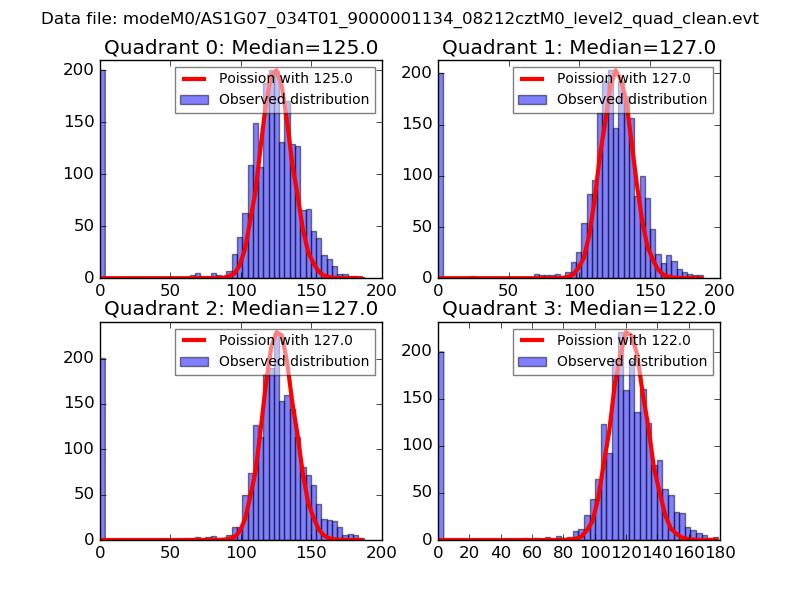
| Comparison with Poisson distribution Blue bars denote a histogram of data divided into 1 sec bins. Red curve is a Poisson curve with rate = median count rate of data. |
 |
 |
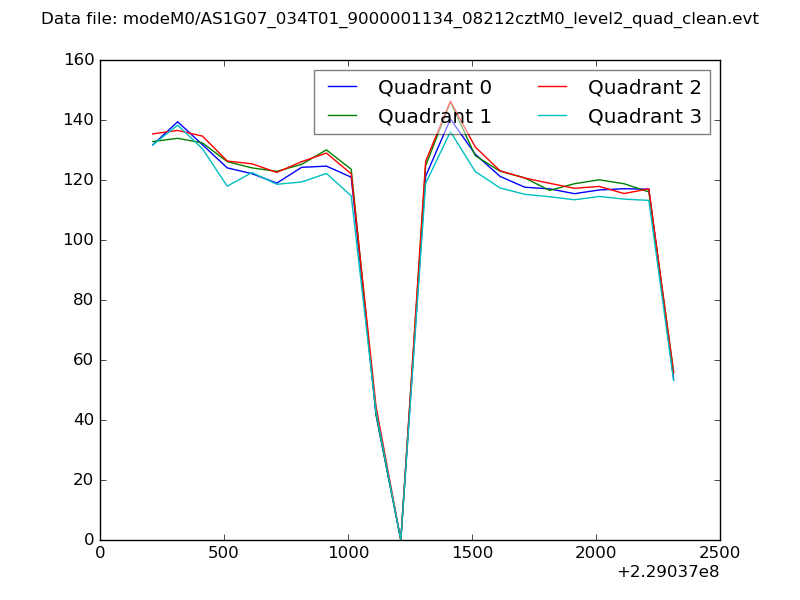
| Quadrant-wise count rates Data is divided into 100 sec bins |
 |
|
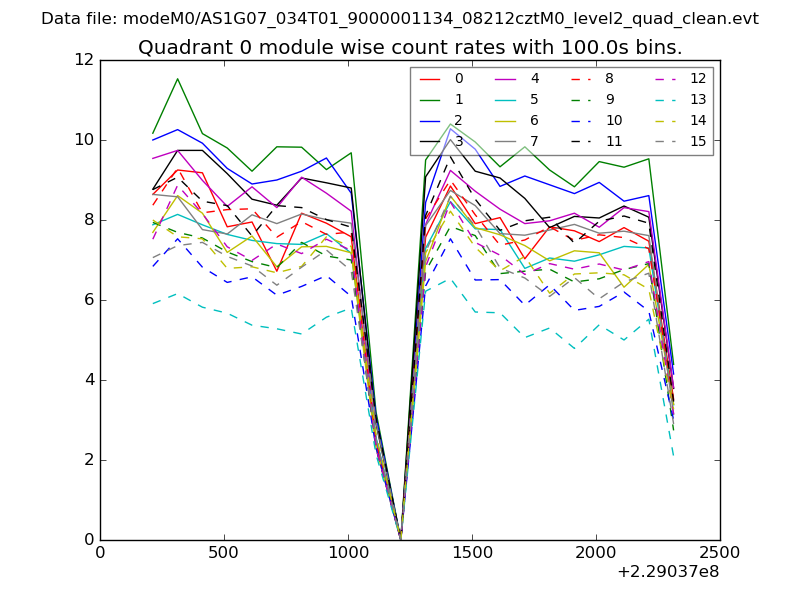
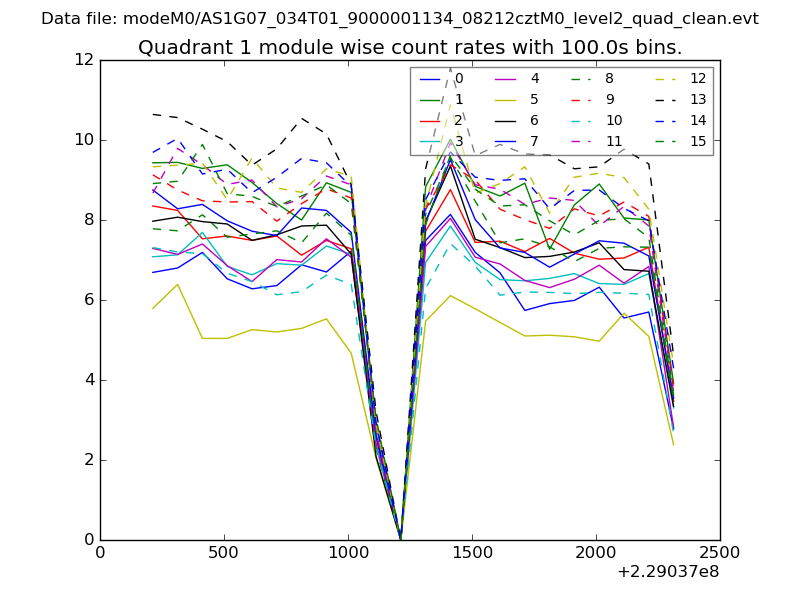
| Module-wise count rates for Quadrant A Data is divided into 100 sec bins |
 |
 |
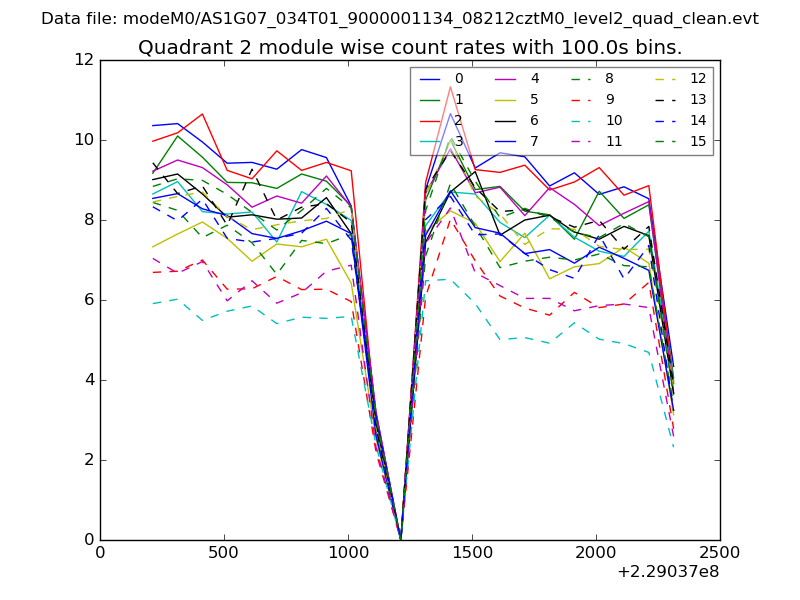
| Module-wise count rates for Quadrant B Data is divided into 100 sec bins |
 |
 |
| Module-wise count rates for Quadrant C Data is divided into 100 sec bins |
 |
 |
| Module-wise count rates for Quadrant D Data is divided into 100 sec bins |
 |
 |
| Parameter | Plot |
|---|---|
| CZT HV Monitor | 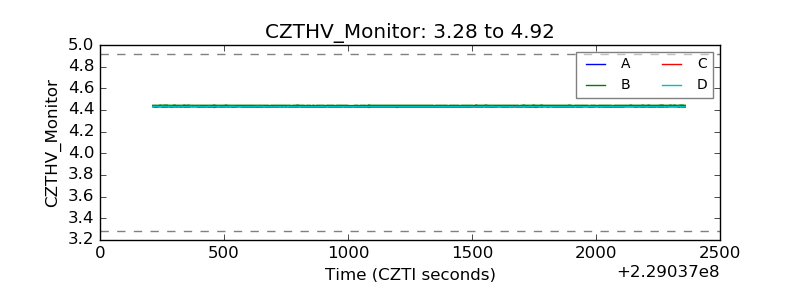 |
| D_VDD | 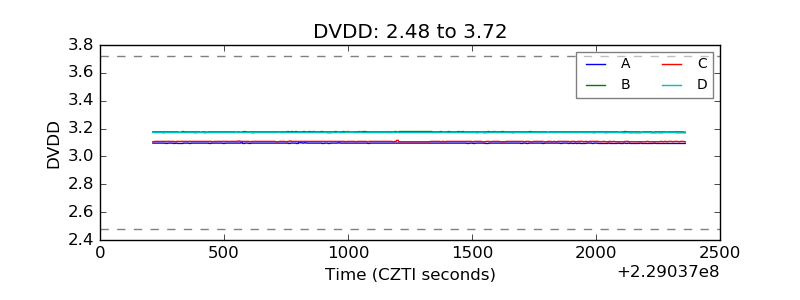 |
| Temperature 1 | 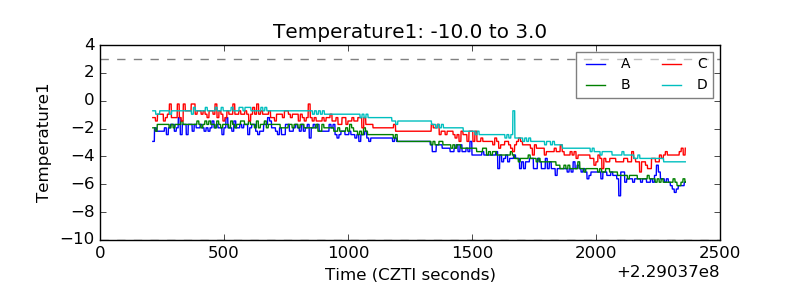 |
| Veto HV Monitor | 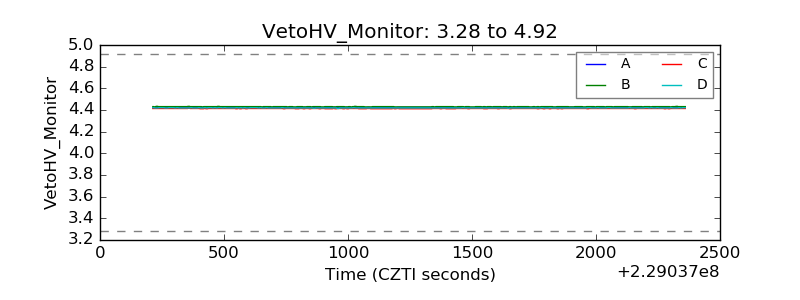 |
| Veto LLD | 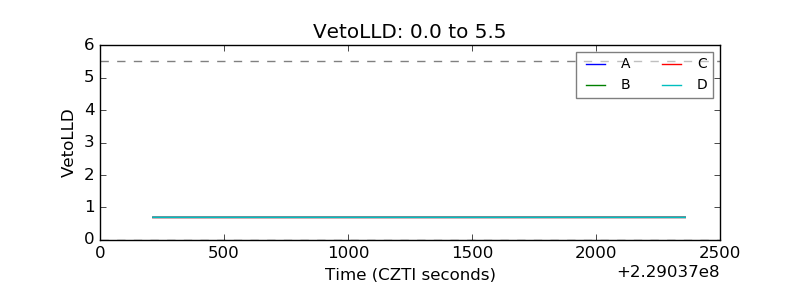 |
| Alpha Counter | 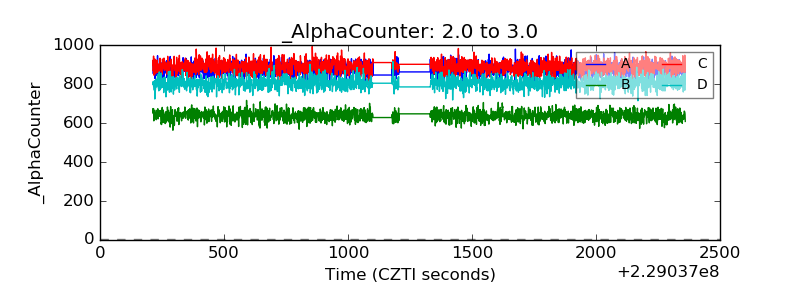 |
| _CPM_Rate | 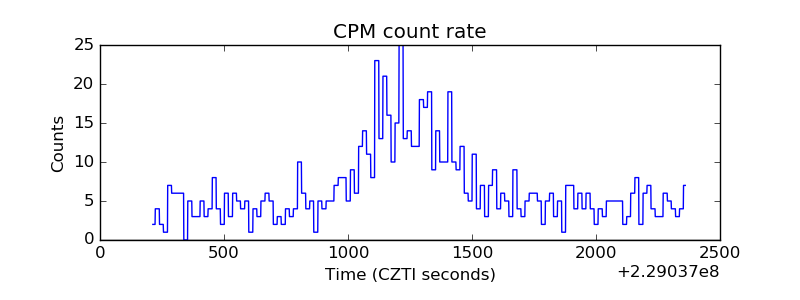 |
| CZT Counter | 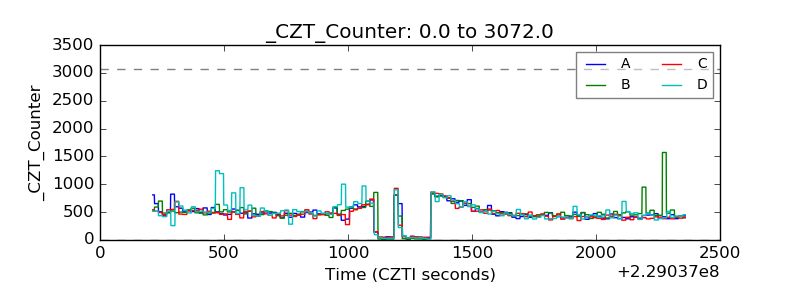 |
| +2.5 Volts monitor |  |
| +5 Volts monitor |  |
| _ROLL_ROT | 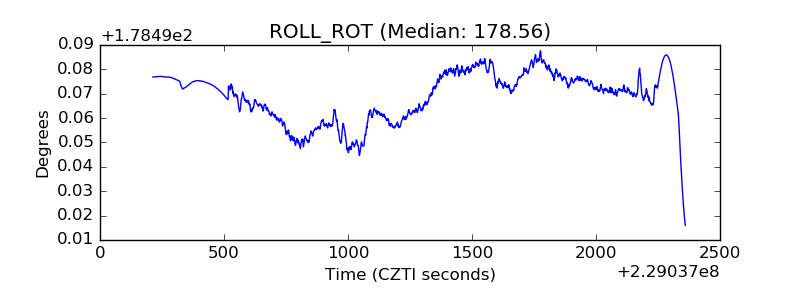 |
| _Roll_DEC | 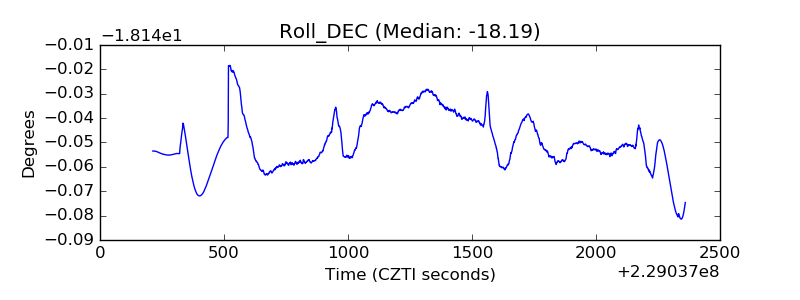 |
| _Roll_RA | 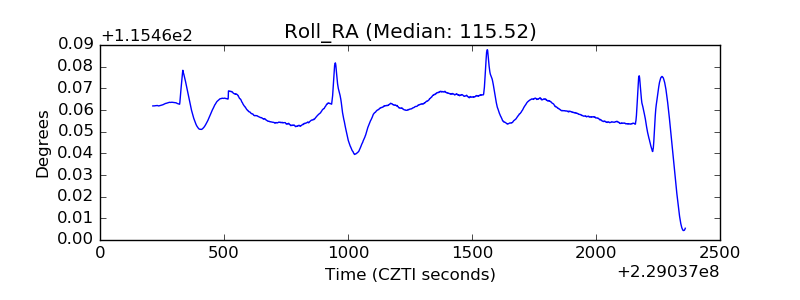 |
| Veto Counter | 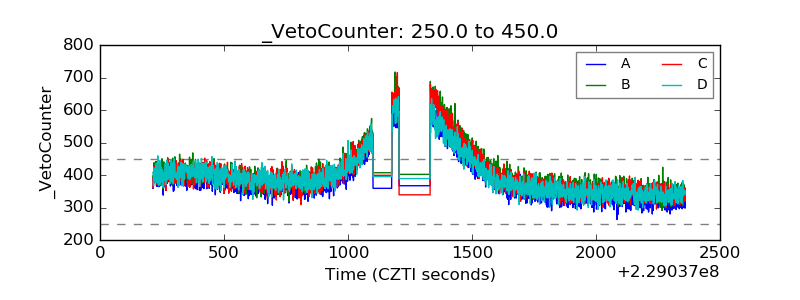 |