| Param | Original file | Final file |
|---|---|---|
| Filename | modeM0/AS1G07_070T01_9000001138cztM0_level2.fits | modeM0/AS1G07_070T01_9000001138cztM0_level2_quad_clean.evt |
| Size (bytes) | 346,184,640 | 353,280,960 |
| Size | 330.1 MB | 336.9 MB |
| Events in quadrant A | 2,125,662 | 2,157,801 |
| Events in quadrant B | 2,041,402 | 2,147,851 |
| Events in quadrant C | 2,065,258 | 2,053,757 |
| Events in quadrant D | 1,790,994 | 1,879,106 |
| Mode SS | |||
|---|---|---|---|
| Quadrant | BADHDUFLAG | Total packets | Discarded packets |
| A | 0 | 730 | 0 |
| B | 0 | 730 | 0 |
| C | 0 | 730 | 0 |
| D | 0 | 730 | 0 |
| Mode M9 | |||
|---|---|---|---|
| Quadrant | BADHDUFLAG | Total packets | Discarded packets |
| A | 0 | 76 | 0 |
| B | 0 | 76 | 0 |
| C | 0 | 76 | 0 |
| D | 0 | 76 | 0 |
| Mode M0 | |||
|---|---|---|---|
| Quadrant | BADHDUFLAG | Total packets | Discarded packets |
| A | 0 | 76480 | 0 |
| B | 0 | 77945 | 0 |
| C | 0 | 75272 | 0 |
| D | 0 | 90289 | 0 |
| Quadrant | Total seconds | Saturated seconds | Saturation percentage |
|---|---|---|---|
| A | 35822 | 580 | 1.619117% |
| B | 35823 | 582 | 1.624655% |
| C | 35823 | 384 | 1.071937% |
| D | 35823 | 1285 | 3.587081% |
Noise dominated data is calculated using 1-second bins in cleaned event files. If a bin has >2000 counts, and if more than 50% of those come from <1% of pixels, then it is considered to be noise-dominated and hence unusable.
| Quadrant | # 1 sec bins | Bins with >0 counts | Bins with >2000 counts | High rate bins dominated by noise | Noise dominated (total time) | Noise dominated (detector-on time) | Marked lightcurve |
|---|---|---|---|---|---|---|---|
| A | 43358 | 35818 | 0 | 0 | 0.00% | 0.00% |  |
| B | 43358 | 35818 | 0 | 0 | 0.00% | 0.00% | 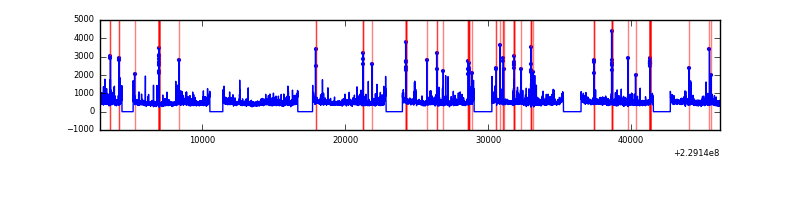 |
| C | 43358 | 35818 | 0 | 0 | 0.00% | 0.00% |  |
| D | 43358 | 35815 | 0 | 0 | 0.00% | 0.00% |  |
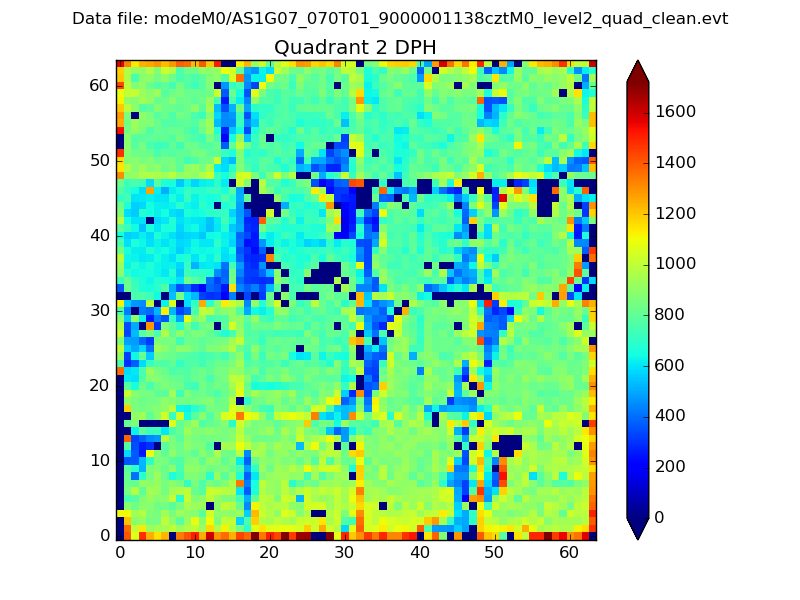
Top three noisy pixels from each quadrant. If the there are fewer than three noisy pixels in the level2.evt file, extra rows are filled as -1
| Pixel properties | Quadrant properties | ||||||
|---|---|---|---|---|---|---|---|
| Quadrant | DetID | PixID | Counts | Sigma | Mean | Median | Sigma |
| A | 0 | 29 | 2051 | 11.06 | 551 | 516 | 138.8 |
| A | 7 | 110 | 1746 | 8.86 | 551 | 516 | 138.8 |
| A | 12 | 109 | 1520 | 7.23 | 551 | 516 | 138.8 |
| B | 2 | 9 | 1707 | 11.12 | 538 | 513 | 107.3 |
| B | 14 | 254 | 1356 | 7.85 | 538 | 513 | 107.3 |
| B | 12 | 226 | 1350 | 7.8 | 538 | 513 | 107.3 |
| C | 1 | 81 | 1469 | 6.68 | 546 | 508 | 143.9 |
| C | 1 | 80 | 1464 | 6.64 | 546 | 508 | 143.9 |
| C | 12 | 241 | 1410 | 6.27 | 546 | 508 | 143.9 |
| D | 3 | 14 | 1308 | 6.23 | 510 | 465 | 135.4 |
| D | 10 | 189 | 1293 | 6.12 | 510 | 465 | 135.4 |
| D | 6 | 231 | 1274 | 5.97 | 510 | 465 | 135.4 |
Histogram calculated using DETX and DETY for each event in the final _common_clean file
| Quadrant A | 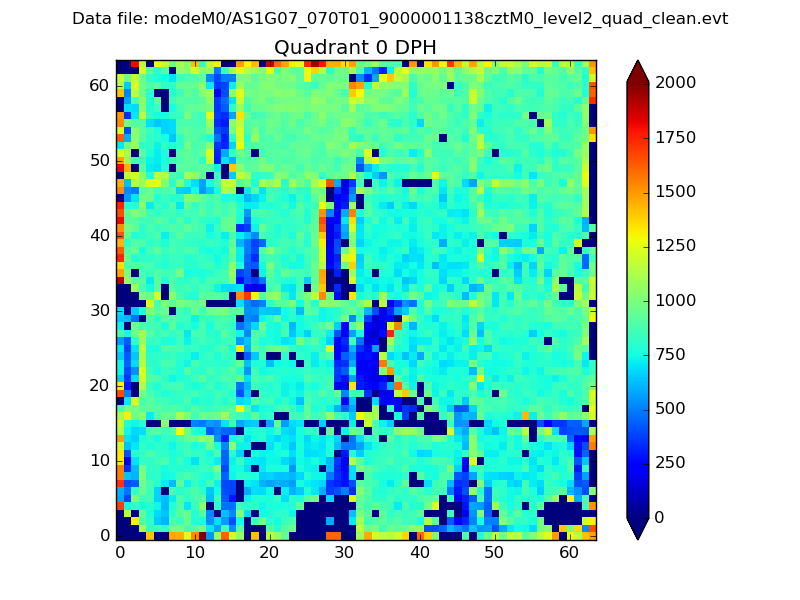 |
 |
Quadrant B |
|---|---|---|---|
| Quadrant D | 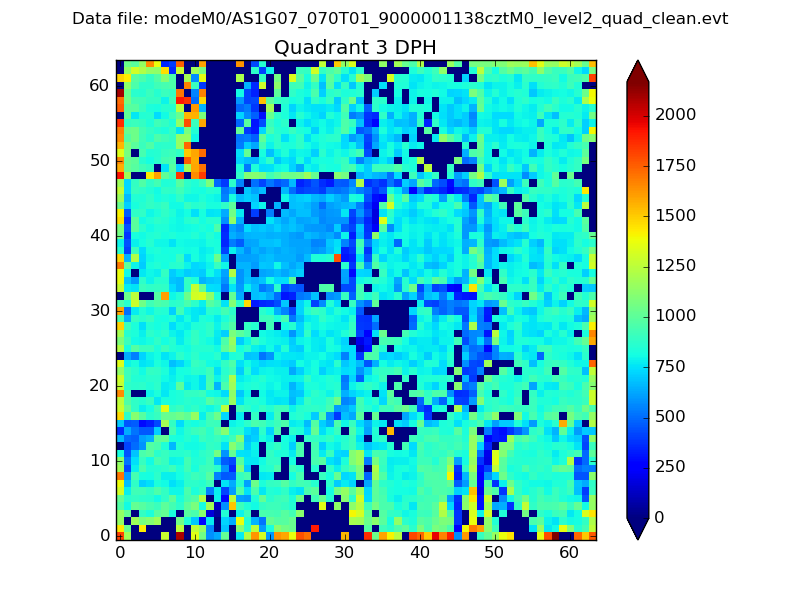 |
 |
Quadrant C |
| Plot type | Count rate plots | Images |
|---|---|---|
| Comparison with Poisson distribution Blue bars denote a histogram of data divided into 1 sec bins. Red curve is a Poisson curve with rate = median count rate of data. |
 |
 |
| Quadrant-wise count rates Data is divided into 100 sec bins |
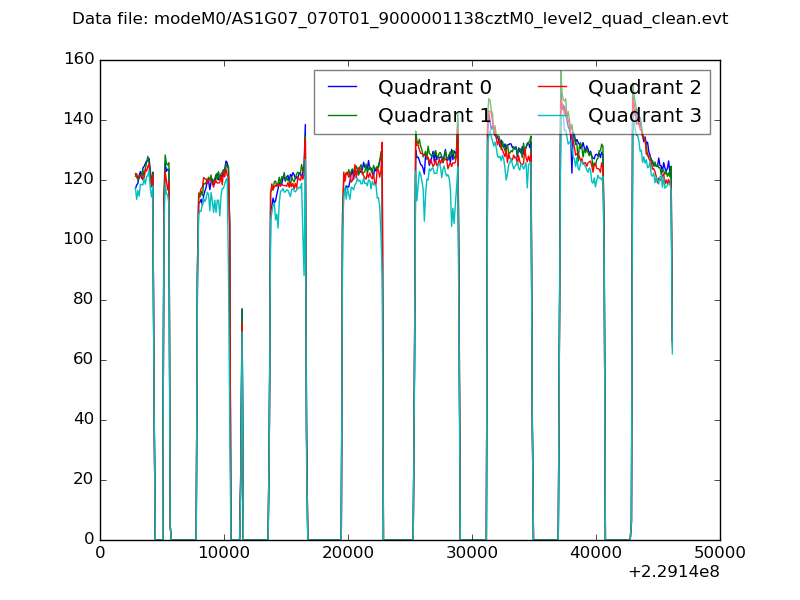 |
|
| Module-wise count rates for Quadrant A Data is divided into 100 sec bins |
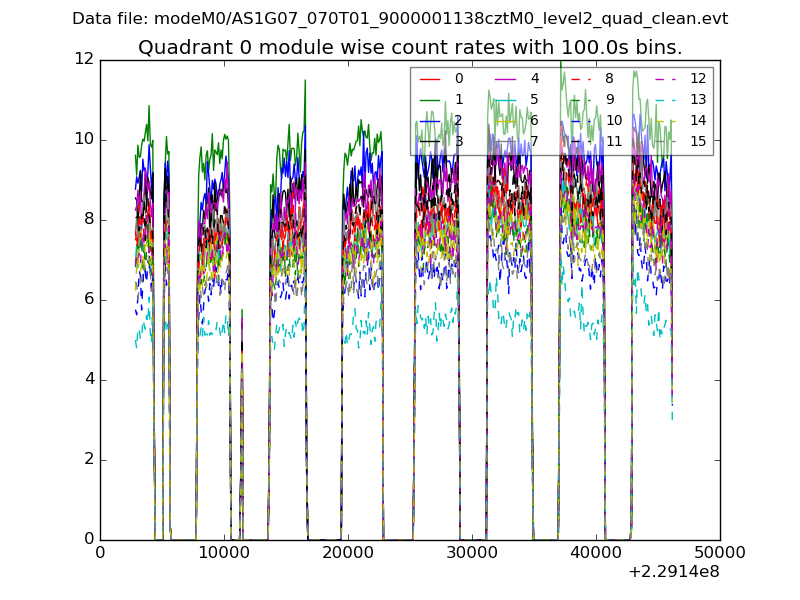 |
 |
| Module-wise count rates for Quadrant B Data is divided into 100 sec bins |
 |
 |
| Module-wise count rates for Quadrant C Data is divided into 100 sec bins |
 |
 |
| Module-wise count rates for Quadrant D Data is divided into 100 sec bins |
 |
 |
| Parameter | Plot |
|---|---|
| CZT HV Monitor | 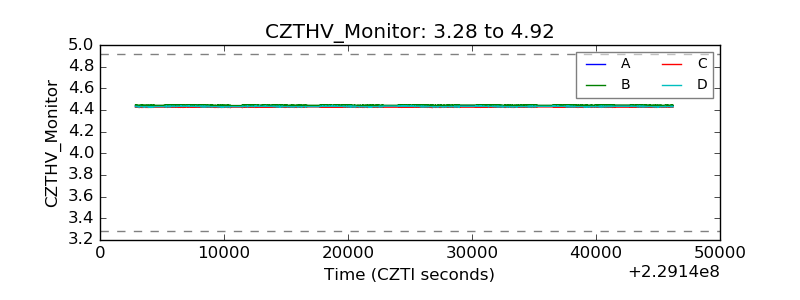 |
| D_VDD |  |
| Temperature 1 |  |
| Veto HV Monitor | 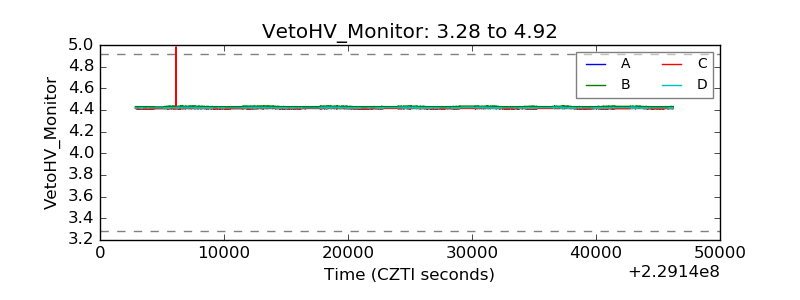 |
| Veto LLD | 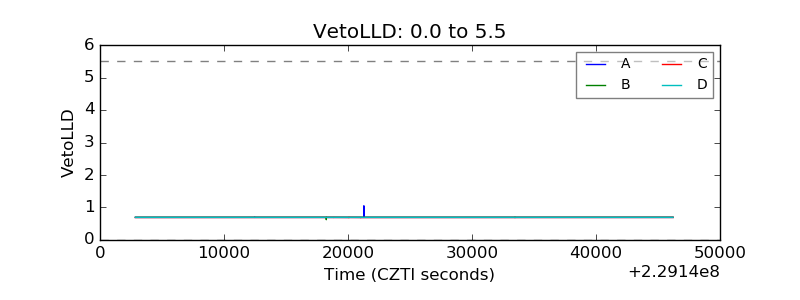 |
| Alpha Counter | 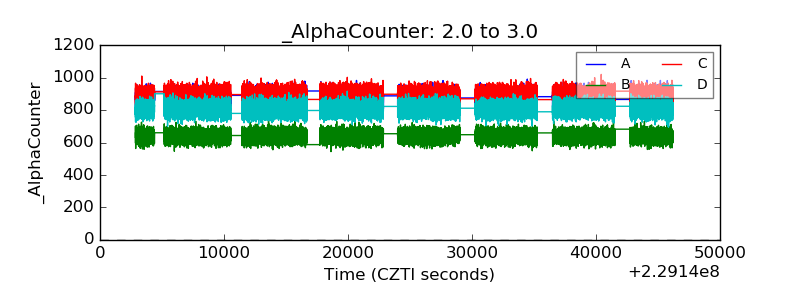 |
| _CPM_Rate |  |
| CZT Counter |  |
| +2.5 Volts monitor |  |
| +5 Volts monitor |  |
| _ROLL_ROT | 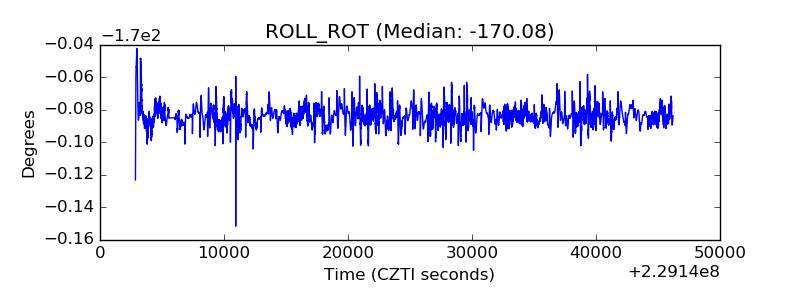 |
| _Roll_DEC |  |
| _Roll_RA |  |
| Veto Counter |  |