| Param | Original file | Final file |
|---|---|---|
| Filename | modeM0/AS1G07_070T01_9000001138_08230cztM0_level2.evt | modeM0/AS1G07_070T01_9000001138_08230cztM0_level2_quad_clean.evt |
| Size (bytes) | 599,333,760 | 94,659,840 |
| Size | 571.6 MB | 90.3 MB |
| Events in quadrant A | 4,070,438 | 578,318 |
| Events in quadrant B | 4,315,285 | 581,367 |
| Events in quadrant C | 3,978,030 | 575,881 |
| Events in quadrant D | 5,213,073 | 542,852 |
| Mode SS | |||
|---|---|---|---|
| Quadrant | BADHDUFLAG | Total packets | Discarded packets |
| A | 0 | 174 | 0 |
| B | 0 | 174 | 0 |
| C | 0 | 174 | 0 |
| D | 0 | 174 | 0 |
| Mode M9 | |||
|---|---|---|---|
| Quadrant | BADHDUFLAG | Total packets | Discarded packets |
| A | 0 | 17 | 0 |
| B | 0 | 17 | 0 |
| C | 0 | 17 | 0 |
| D | 0 | 17 | 0 |
| Mode M0 | |||
|---|---|---|---|
| Quadrant | BADHDUFLAG | Total packets | Discarded packets |
| A | 0 | 17859 | 5 |
| B | 0 | 18264 | 2 |
| C | 0 | 17610 | 2 |
| D | 0 | 21385 | 2 |
| Quadrant | Total seconds | Saturated seconds | Saturation percentage |
|---|---|---|---|
| A | 8463 | 82 | 0.968924% |
| B | 8464 | 94 | 1.110586% |
| C | 8464 | 55 | 0.649811% |
| D | 8464 | 269 | 3.178166% |
Noise dominated data is calculated using 1-second bins in cleaned event files. If a bin has >2000 counts, and if more than 50% of those come from <1% of pixels, then it is considered to be noise-dominated and hence unusable.
| Quadrant | # 1 sec bins | Bins with >0 counts | Bins with >2000 counts | High rate bins dominated by noise | Noise dominated (total time) | Noise dominated (detector-on time) | Marked lightcurve |
|---|---|---|---|---|---|---|---|
| A | 10149 | 8466 | 39 | 39 | 0.38% | 0.46% | 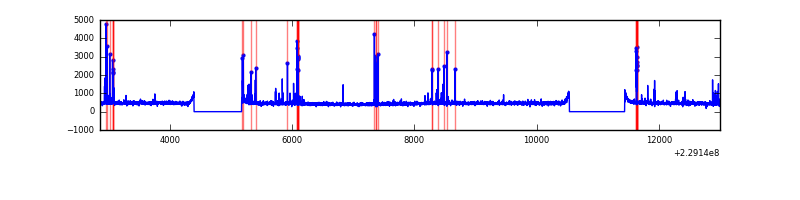 |
| B | 10149 | 8466 | 16 | 16 | 0.16% | 0.19% | 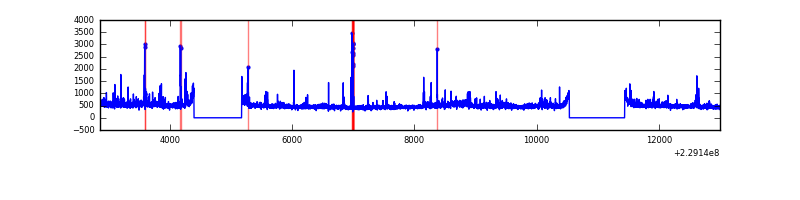 |
| C | 10149 | 8466 | 0 | 0 | 0.00% | 0.00% | 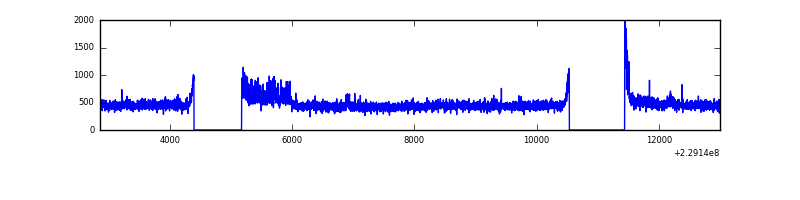 |
| D | 10149 | 8465 | 225 | 225 | 2.22% | 2.66% | 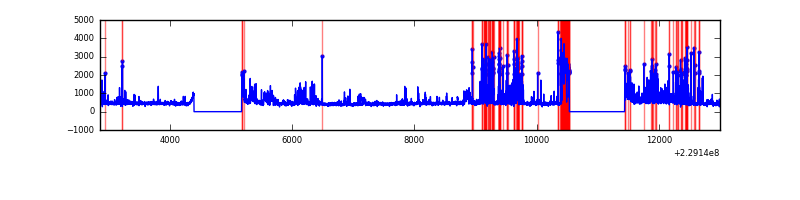 |
Top three noisy pixels from each quadrant. If the there are fewer than three noisy pixels in the level2.evt file, extra rows are filled as -1
| Pixel properties | Quadrant properties | ||||||
|---|---|---|---|---|---|---|---|
| Quadrant | DetID | PixID | Counts | Sigma | Mean | Median | Sigma |
| A | 5 | 16 | 241404 | 1186.91 | 994 | 972 | 202.6 |
| A | 0 | 226 | 9312 | 41.17 | 994 | 972 | 202.6 |
| A | 12 | 194 | 8889 | 39.08 | 994 | 972 | 202.6 |
| B | 0 | 214 | 147870 | 761.59 | 1001 | 978 | 192.9 |
| B | 11 | 51 | 84104 | 430.98 | 1001 | 978 | 192.9 |
| B | 4 | 81 | 69452 | 355.01 | 1001 | 978 | 192.9 |
| C | 9 | 68 | 148747 | 657.79 | 964 | 965 | 224.7 |
| C | 1 | 16 | 71761 | 315.12 | 964 | 965 | 224.7 |
| C | 13 | 61 | 7272 | 28.07 | 964 | 965 | 224.7 |
| D | 13 | 105 | 819691 | 3517.65 | 949 | 917 | 232.8 |
| D | 1 | 52 | 670845 | 2878.17 | 949 | 917 | 232.8 |
| D | 2 | 14 | 48066 | 202.56 | 949 | 917 | 232.8 |
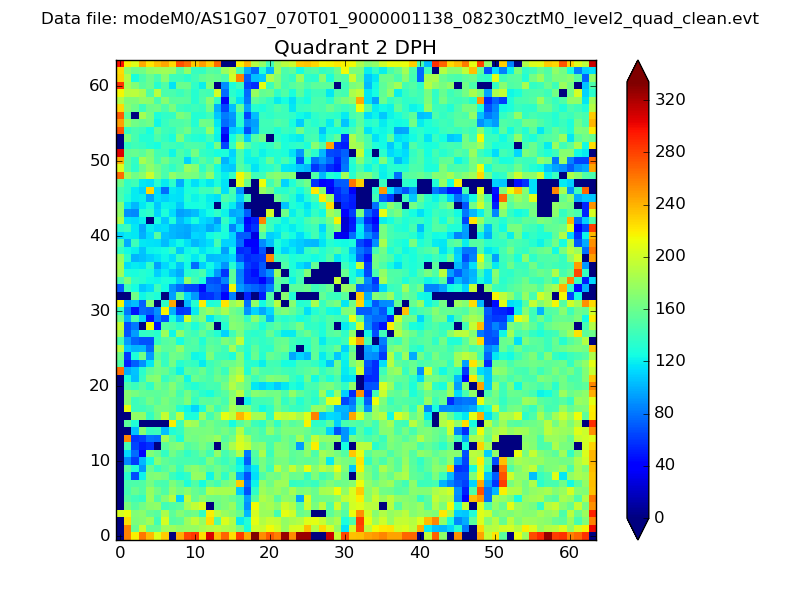
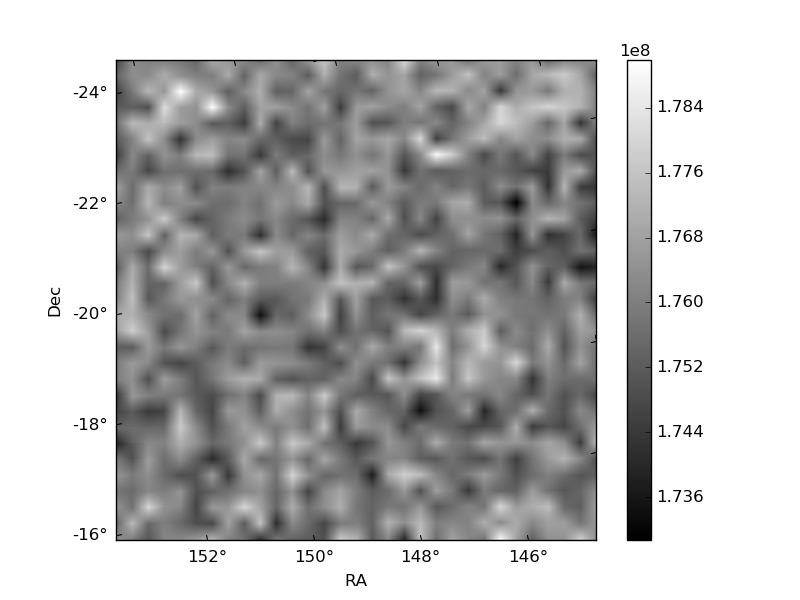
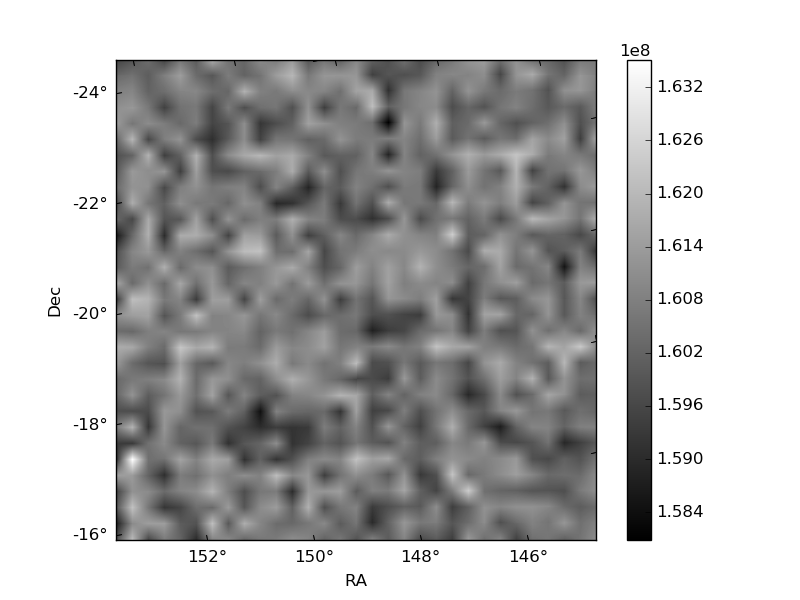
Histogram calculated using DETX and DETY for each event in the final _common_clean file
| Quadrant A | 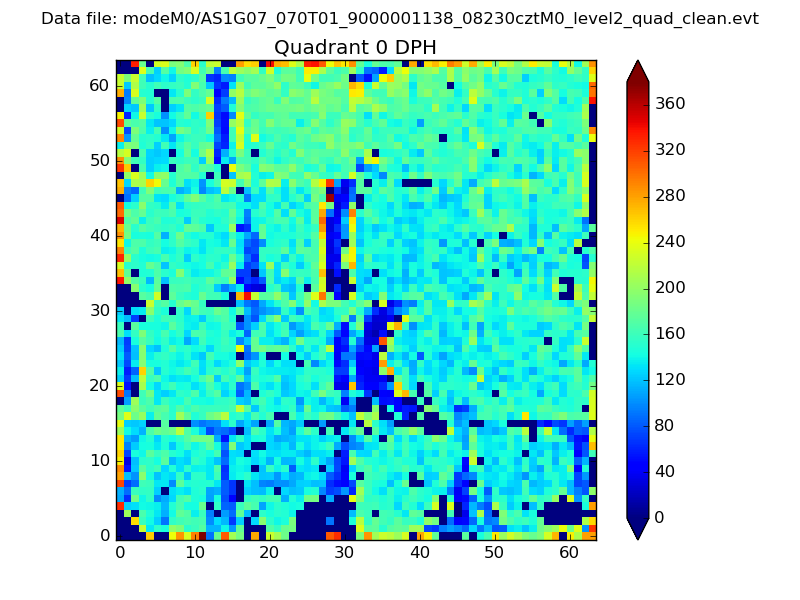 |
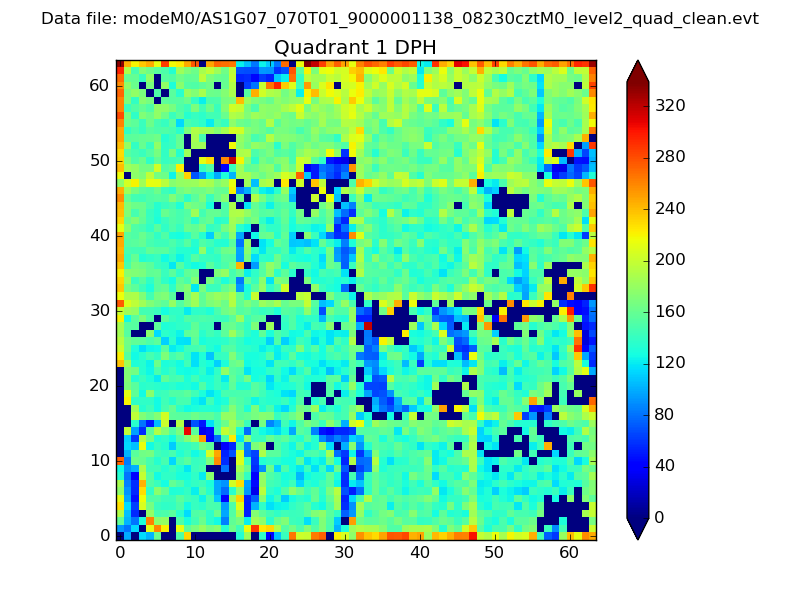 |
Quadrant B |
|---|---|---|---|
| Quadrant D | 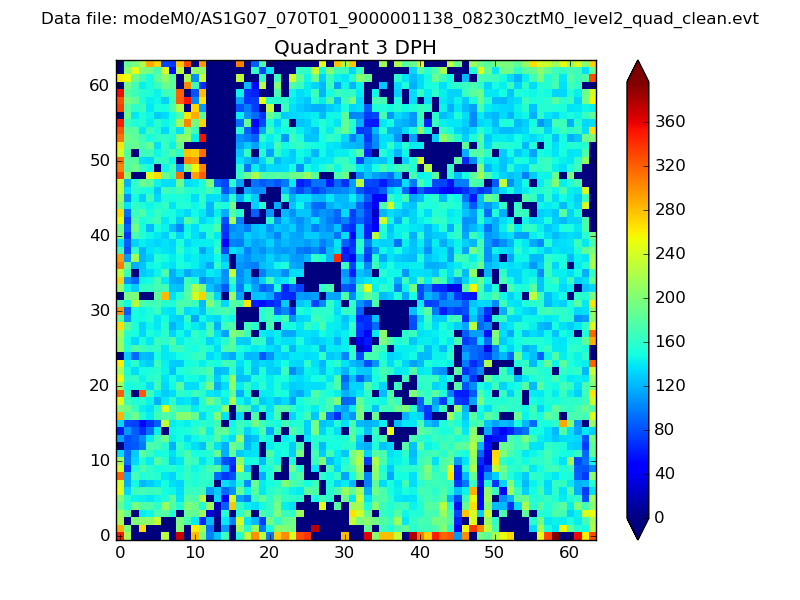 |
 |
Quadrant C |
| Plot type | Count rate plots | Images |
|---|---|---|
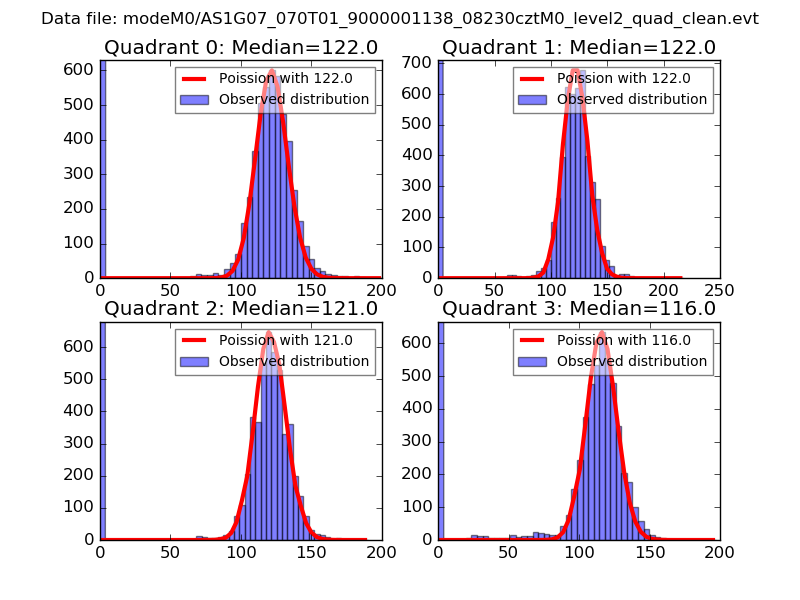
| Comparison with Poisson distribution Blue bars denote a histogram of data divided into 1 sec bins. Red curve is a Poisson curve with rate = median count rate of data. |
 |
 |
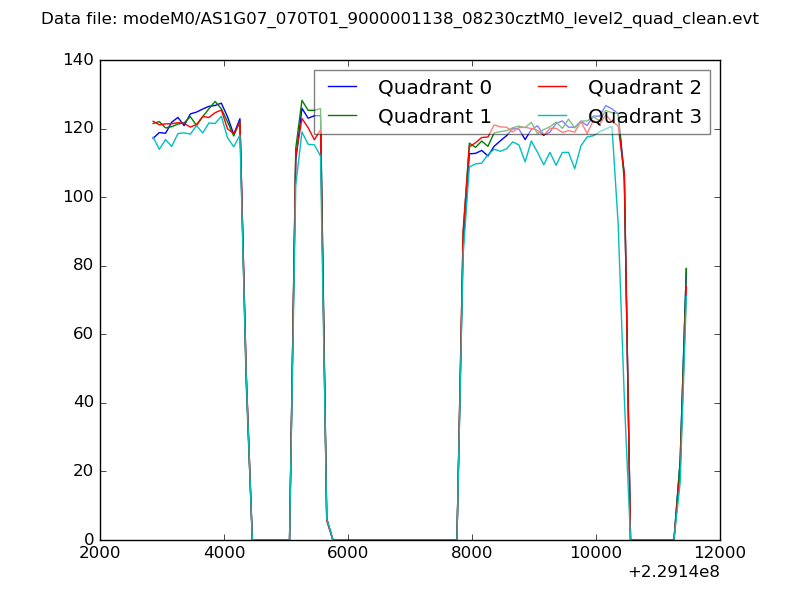
| Quadrant-wise count rates Data is divided into 100 sec bins |
 |
|
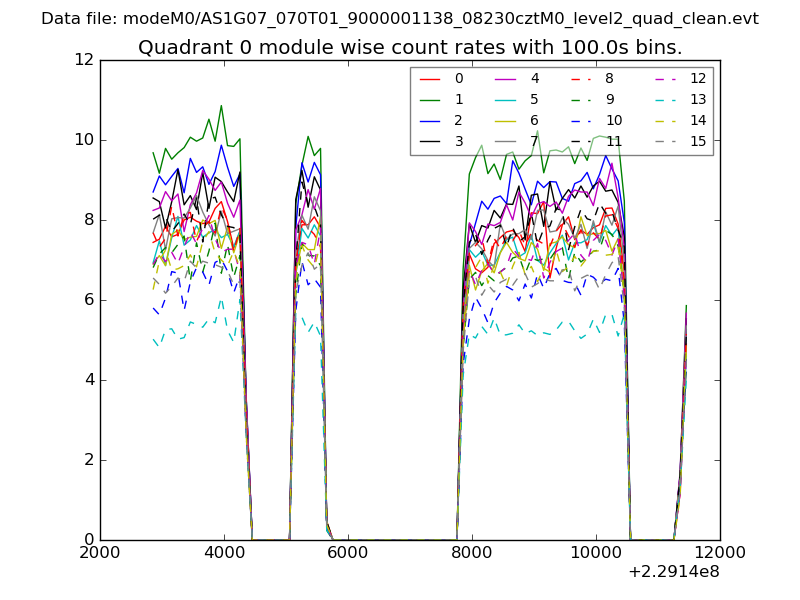
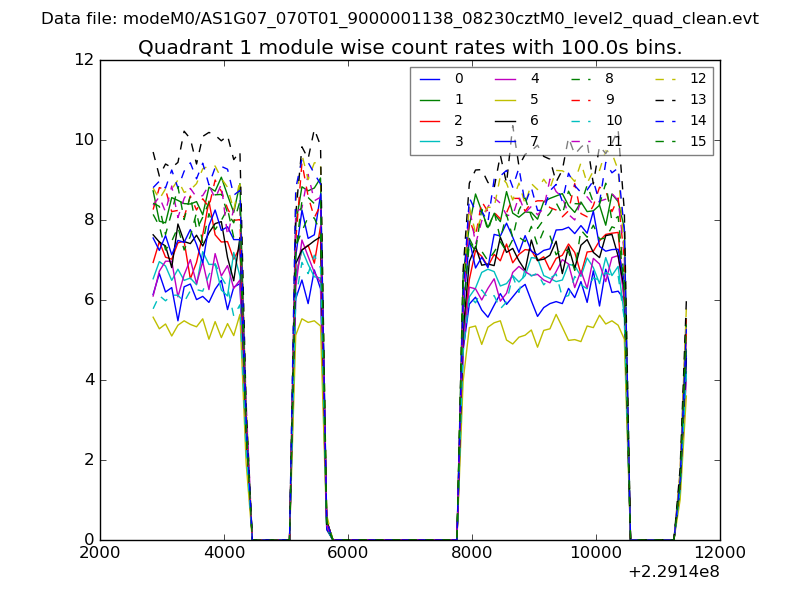
| Module-wise count rates for Quadrant A Data is divided into 100 sec bins |
 |
 |
| Module-wise count rates for Quadrant B Data is divided into 100 sec bins |
 |
 |
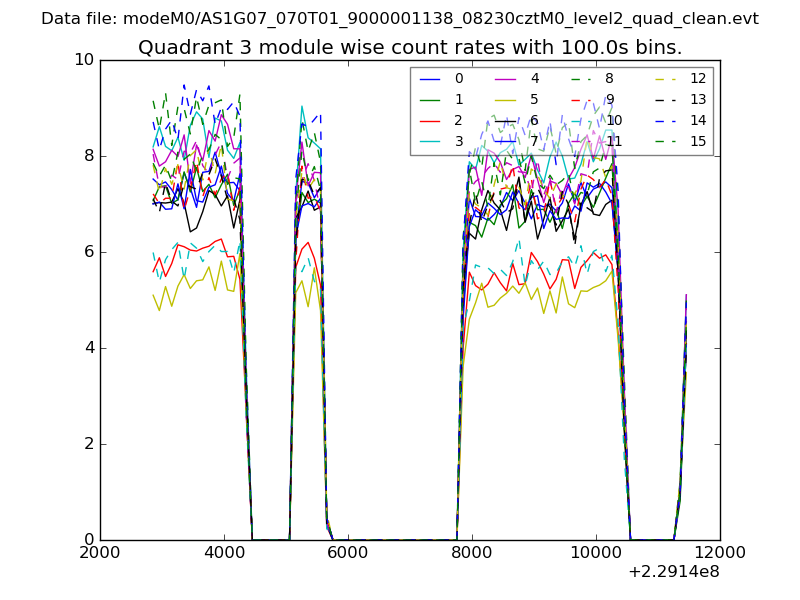
| Module-wise count rates for Quadrant C Data is divided into 100 sec bins |
 |
 |
| Module-wise count rates for Quadrant D Data is divided into 100 sec bins |
 |
 |
| Parameter | Plot |
|---|---|
| CZT HV Monitor | 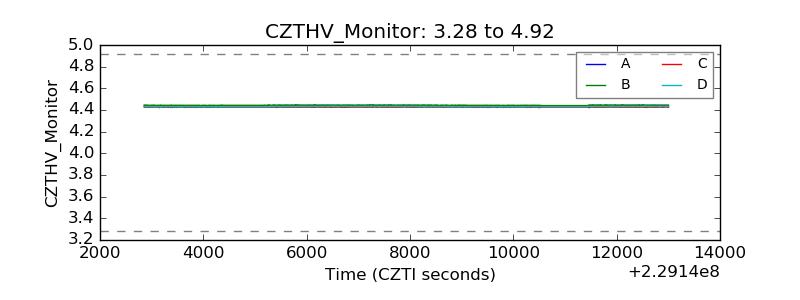 |
| D_VDD | 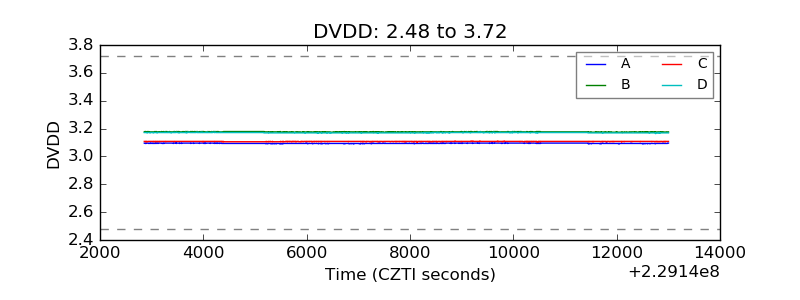 |
| Temperature 1 |  |
| Veto HV Monitor | 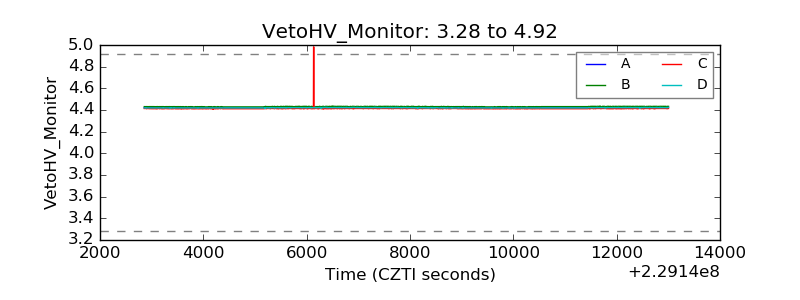 |
| Veto LLD | 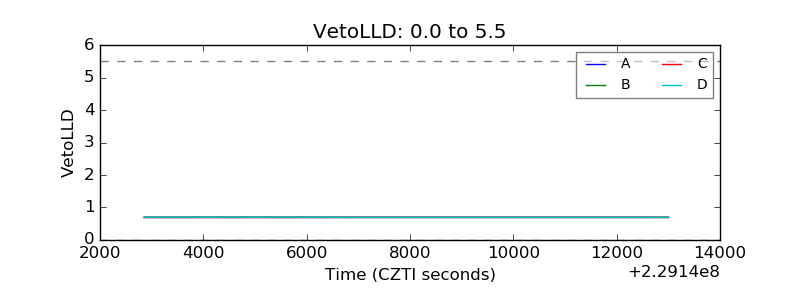 |
| Alpha Counter | 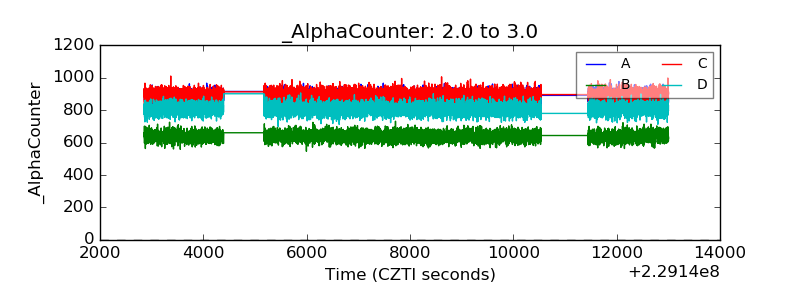 |
| _CPM_Rate | 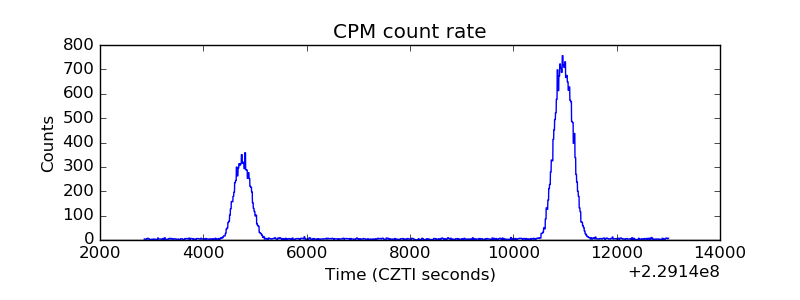 |
| CZT Counter | 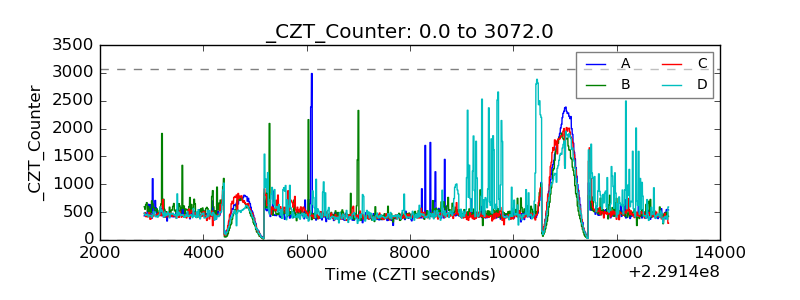 |
| +2.5 Volts monitor |  |
| +5 Volts monitor |  |
| _ROLL_ROT | 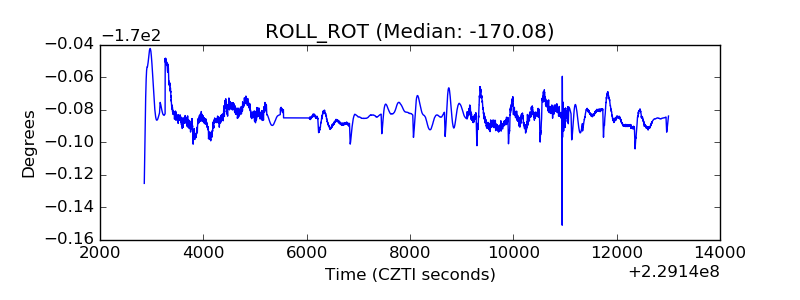 |
| _Roll_DEC | 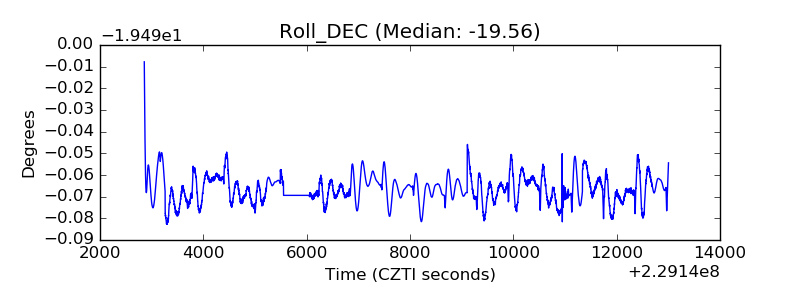 |
| _Roll_RA | 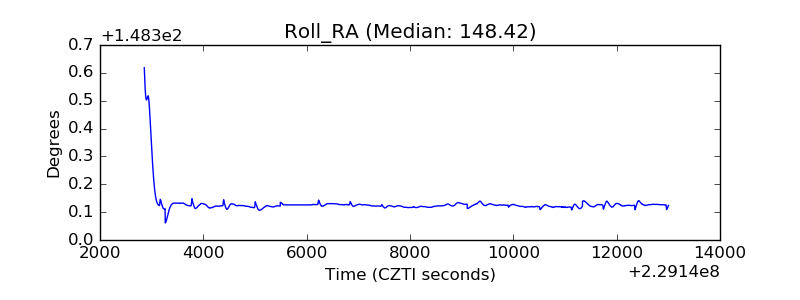 |
| Veto Counter | 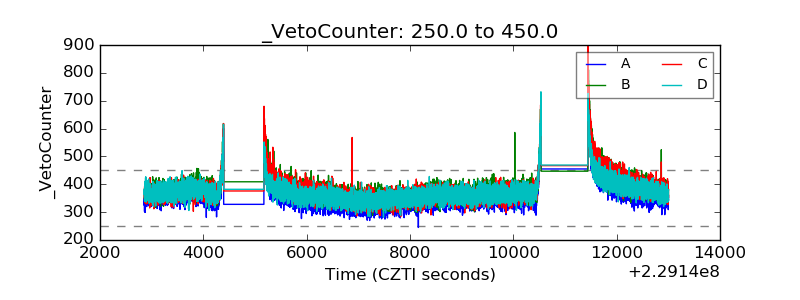 |