| Param | Original file | Final file |
|---|---|---|
| Filename | modeM0/AS1G07_070T01_9000001138_08236cztM0_level2.evt | modeM0/AS1G07_070T01_9000001138_08236cztM0_level2_quad_clean.evt |
| Size (bytes) | 478,707,840 | 96,880,320 |
| Size | 456.5 MB | 92.4 MB |
| Events in quadrant A | 3,400,856 | 628,715 |
| Events in quadrant B | 3,593,125 | 634,129 |
| Events in quadrant C | 3,205,664 | 620,152 |
| Events in quadrant D | 3,856,666 | 597,828 |
| Mode SS | |||
|---|---|---|---|
| Quadrant | BADHDUFLAG | Total packets | Discarded packets |
| A | 0 | 136 | 0 |
| B | 0 | 136 | 0 |
| C | 0 | 136 | 0 |
| D | 0 | 136 | 0 |
| Mode M9 | |||
|---|---|---|---|
| Quadrant | BADHDUFLAG | Total packets | Discarded packets |
| A | 0 | 24 | 0 |
| B | 0 | 24 | 0 |
| C | 0 | 24 | 0 |
| D | 0 | 24 | 0 |
| Mode M0 | |||
|---|---|---|---|
| Quadrant | BADHDUFLAG | Total packets | Discarded packets |
| A | 0 | 14188 | 3 |
| B | 0 | 14633 | 2 |
| C | 0 | 13749 | 2 |
| D | 0 | 15681 | 2 |
| Quadrant | Total seconds | Saturated seconds | Saturation percentage |
|---|---|---|---|
| A | 6489 | 263 | 4.053013% |
| B | 6489 | 257 | 3.960549% |
| C | 6489 | 202 | 3.112960% |
| D | 6489 | 277 | 4.268763% |
Noise dominated data is calculated using 1-second bins in cleaned event files. If a bin has >2000 counts, and if more than 50% of those come from <1% of pixels, then it is considered to be noise-dominated and hence unusable.
| Quadrant | # 1 sec bins | Bins with >0 counts | Bins with >2000 counts | High rate bins dominated by noise | Noise dominated (total time) | Noise dominated (detector-on time) | Marked lightcurve |
|---|---|---|---|---|---|---|---|
| A | 8909 | 6489 | 16 | 16 | 0.18% | 0.25% | 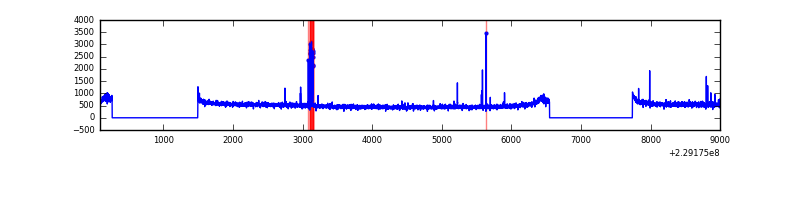 |
| B | 8909 | 6489 | 22 | 22 | 0.25% | 0.34% | 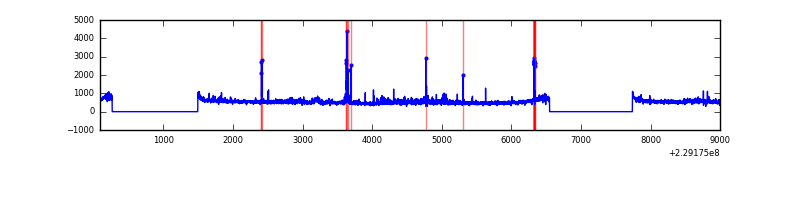 |
| C | 8909 | 6489 | 0 | 0 | 0.00% | 0.00% | 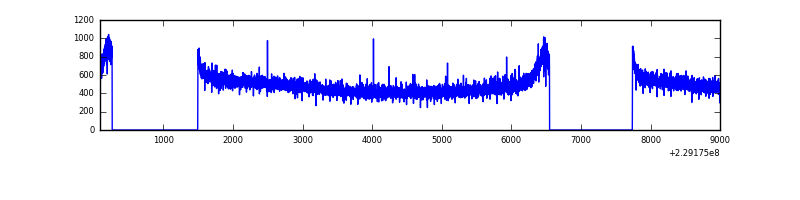 |
| D | 8909 | 6489 | 42 | 42 | 0.47% | 0.65% | 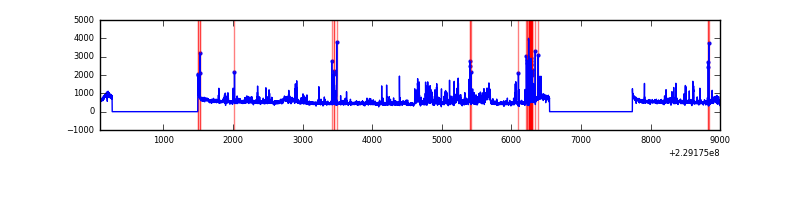 |
Top three noisy pixels from each quadrant. If the there are fewer than three noisy pixels in the level2.evt file, extra rows are filled as -1
| Pixel properties | Quadrant properties | ||||||
|---|---|---|---|---|---|---|---|
| Quadrant | DetID | PixID | Counts | Sigma | Mean | Median | Sigma |
| A | 5 | 16 | 68676 | 391.6 | 854 | 834 | 173.2 |
| A | 8 | 15 | 37256 | 210.24 | 854 | 834 | 173.2 |
| A | 0 | 226 | 8102 | 41.95 | 854 | 834 | 173.2 |
| B | 11 | 51 | 107536 | 662.03 | 846 | 828 | 161.2 |
| B | 10 | 16 | 75802 | 465.15 | 846 | 828 | 161.2 |
| B | 0 | 214 | 60978 | 373.18 | 846 | 828 | 161.2 |
| C | 13 | 61 | 6951 | 32.45 | 818 | 821 | 188.9 |
| C | 13 | 255 | 5153 | 22.93 | 818 | 821 | 188.9 |
| C | 7 | 237 | 4431 | 19.11 | 818 | 821 | 188.9 |
| D | 13 | 105 | 441565 | 2199.28 | 825 | 800 | 200.4 |
| D | 1 | 52 | 181233 | 900.31 | 825 | 800 | 200.4 |
| D | 13 | 122 | 61662 | 303.68 | 825 | 800 | 200.4 |
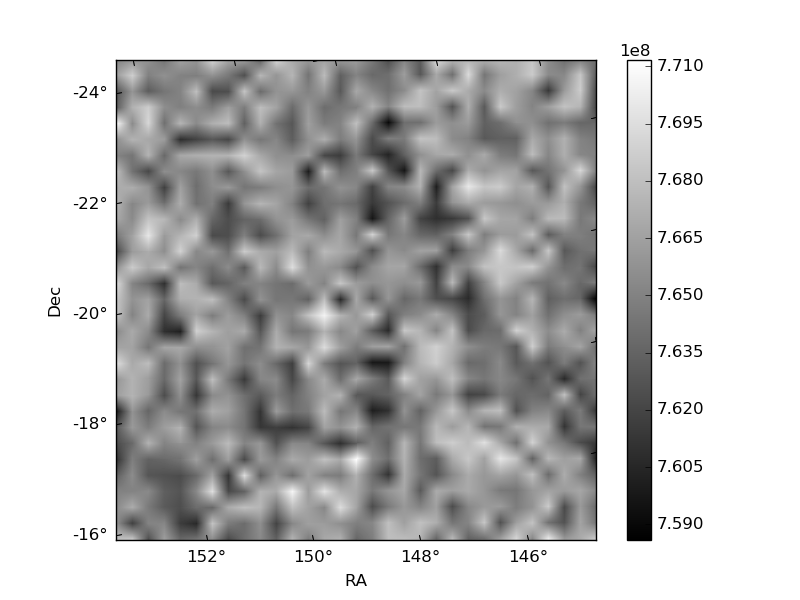
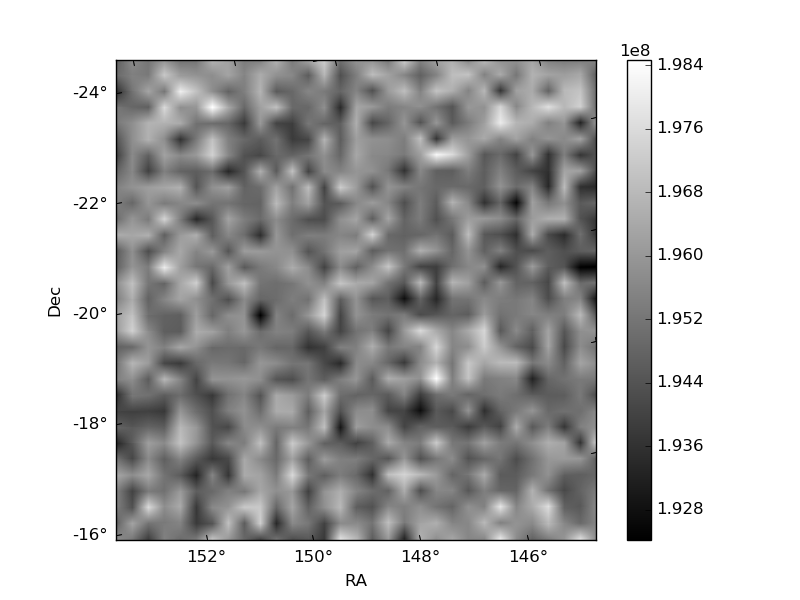
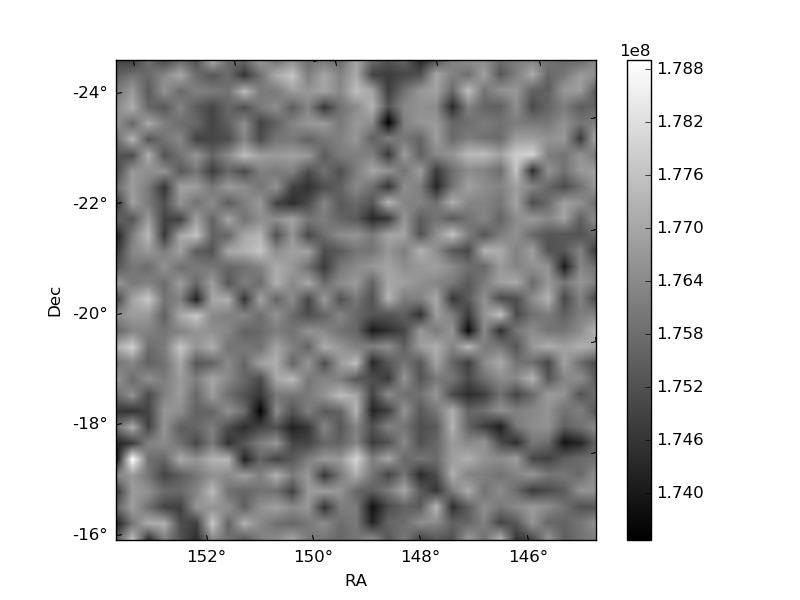
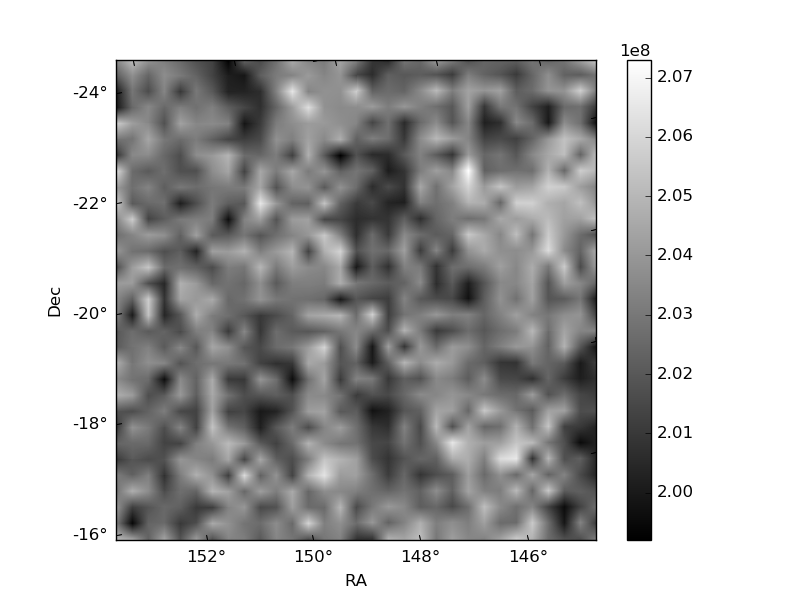
Histogram calculated using DETX and DETY for each event in the final _common_clean file
| Quadrant A | 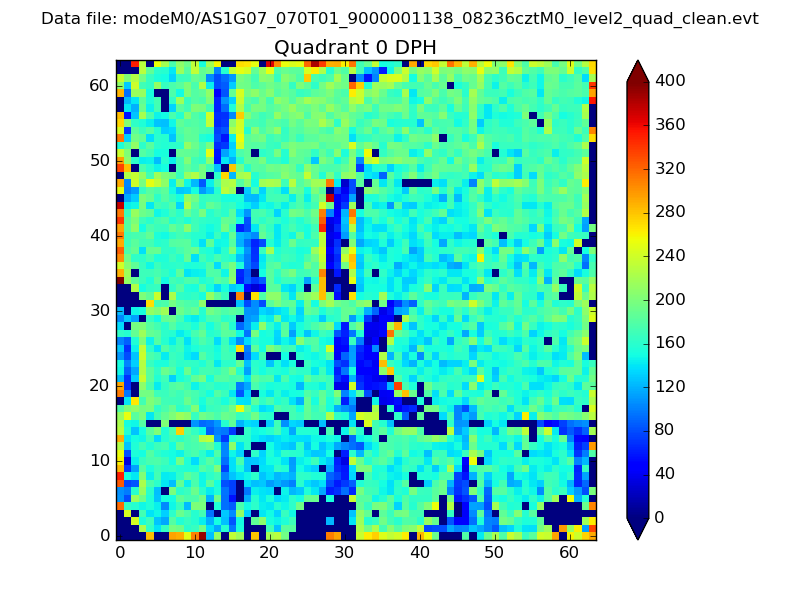 |
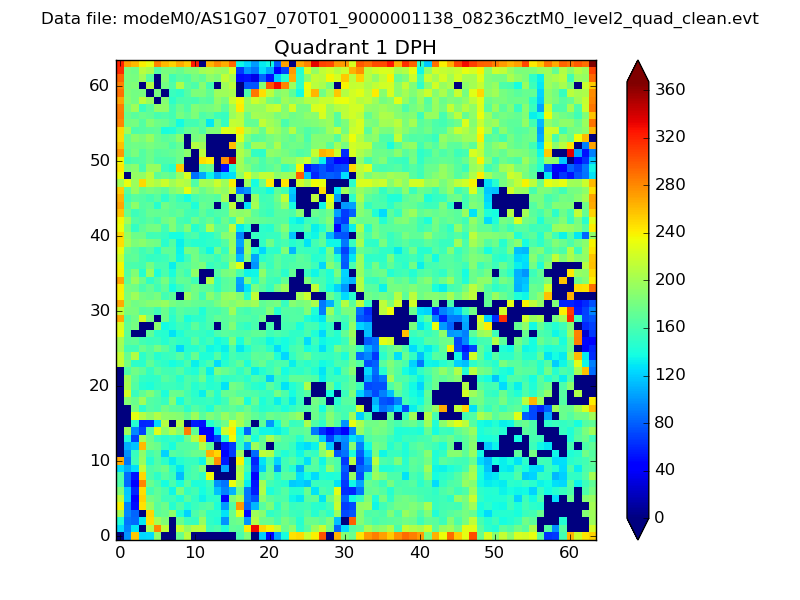 |
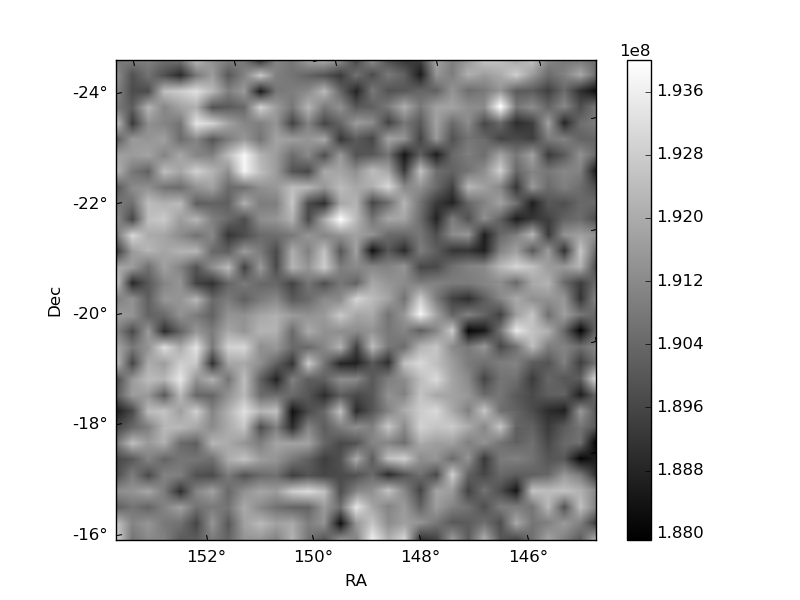
Quadrant B |
|---|---|---|---|
| Quadrant D | 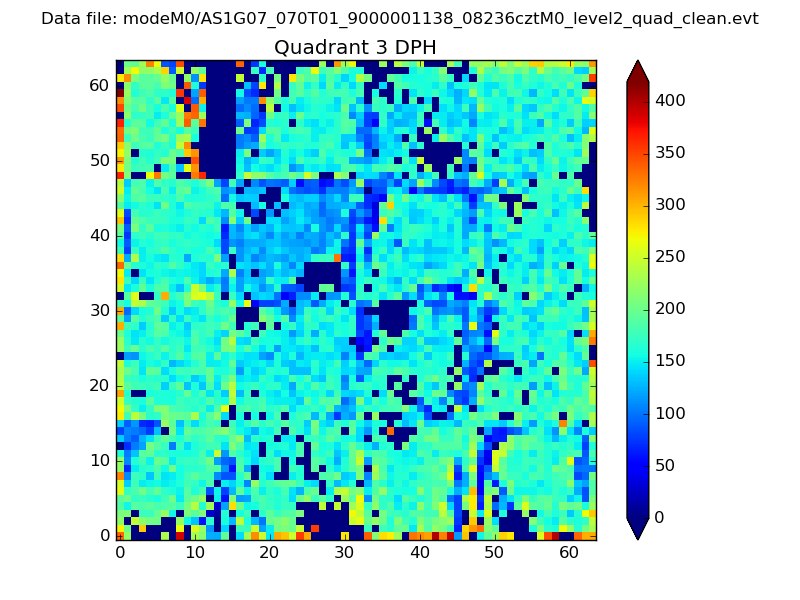 |
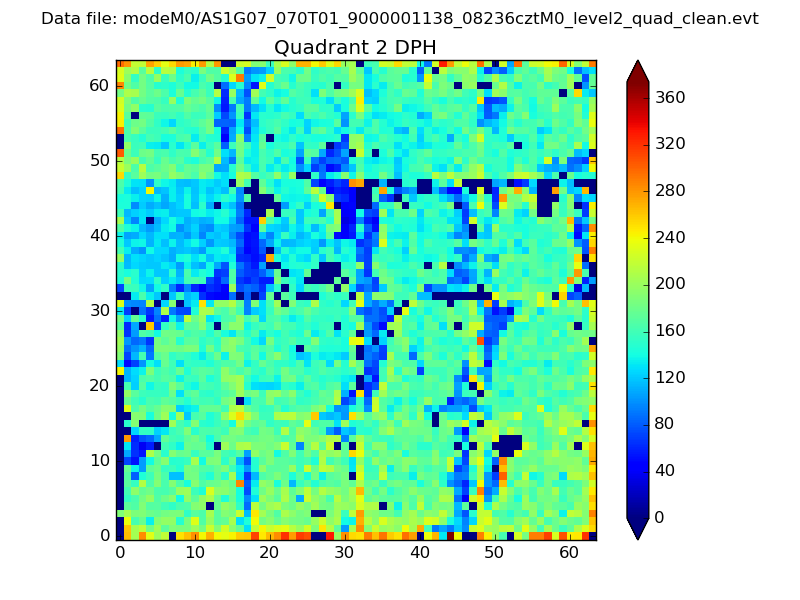 |
Quadrant C |
| Plot type | Count rate plots | Images |
|---|---|---|
| Comparison with Poisson distribution Blue bars denote a histogram of data divided into 1 sec bins. Red curve is a Poisson curve with rate = median count rate of data. |
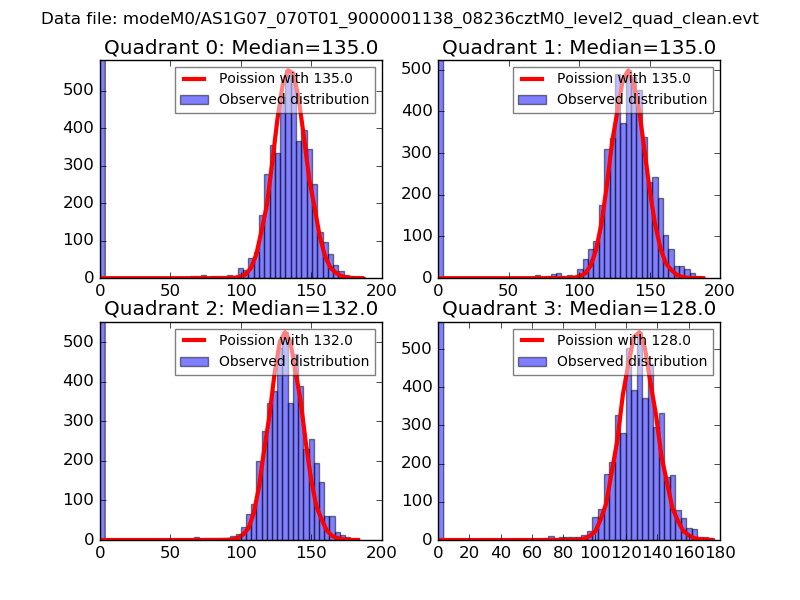 |
 |
| Quadrant-wise count rates Data is divided into 100 sec bins |
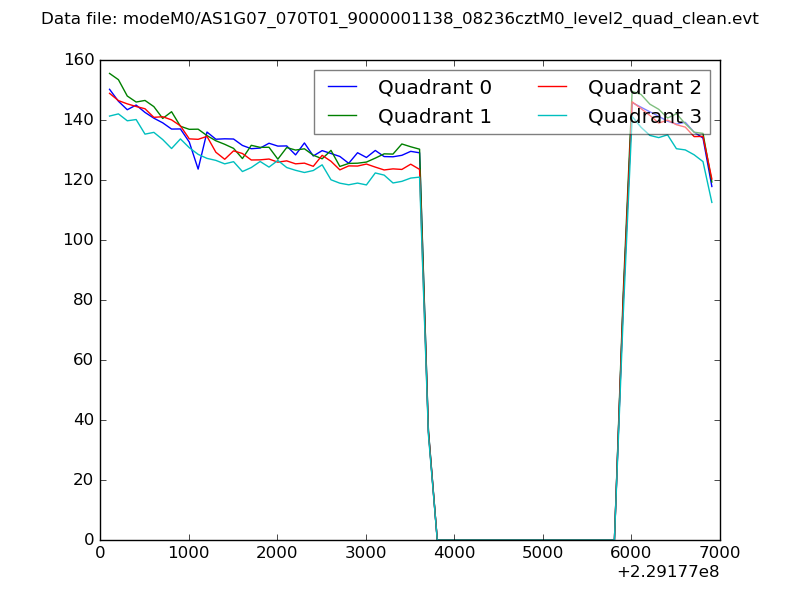 |
|
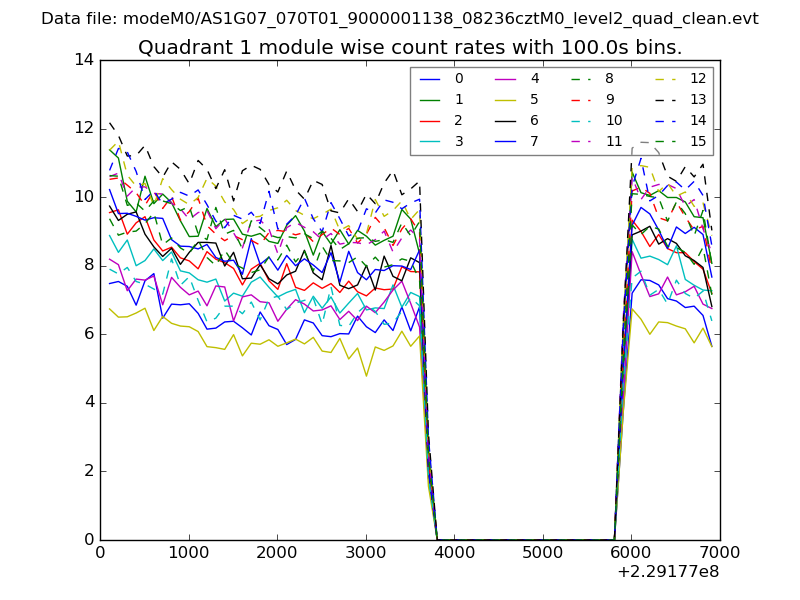
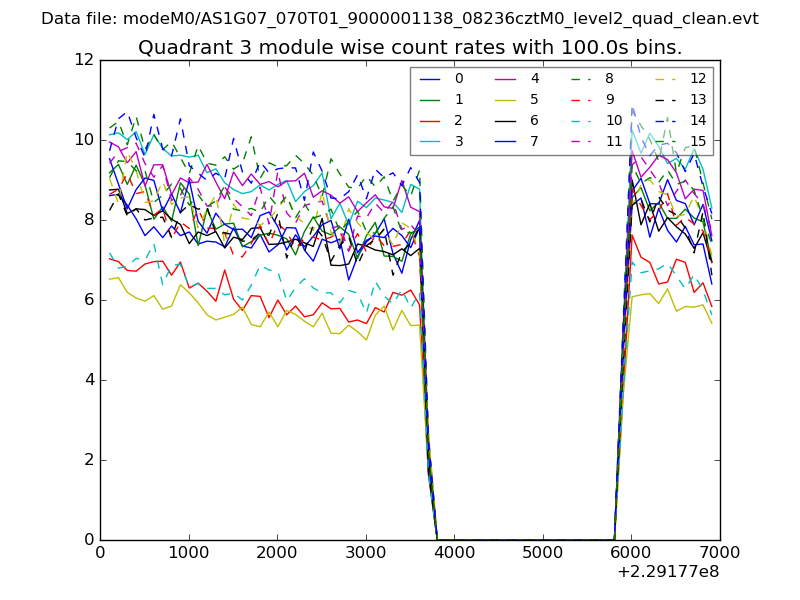
| Module-wise count rates for Quadrant A Data is divided into 100 sec bins |
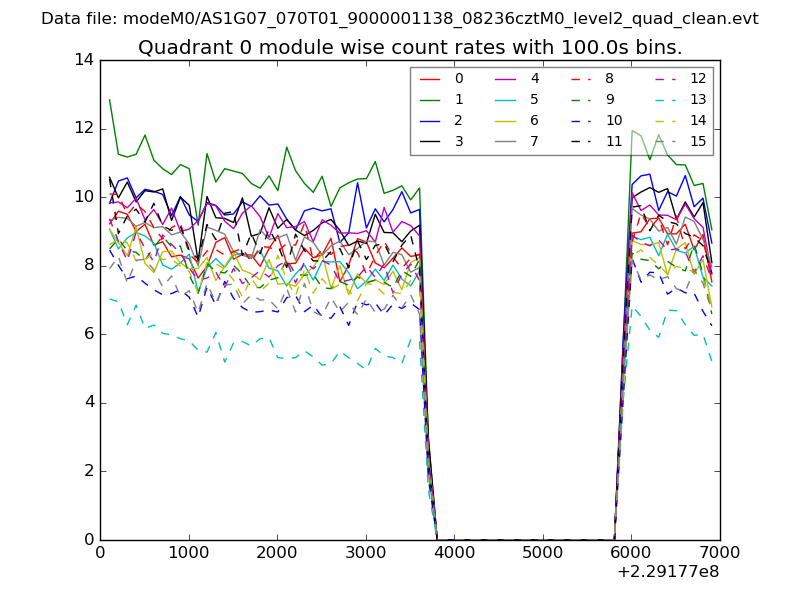 |
 |
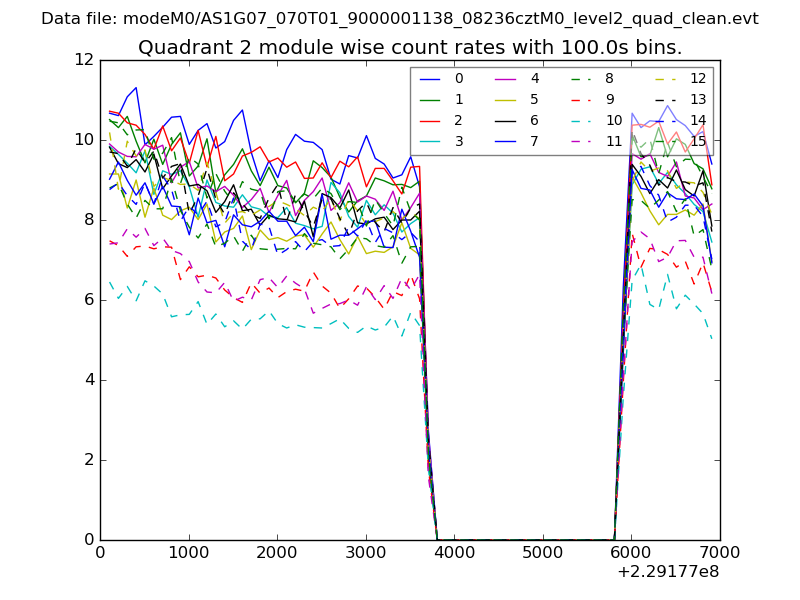
| Module-wise count rates for Quadrant B Data is divided into 100 sec bins |
 |
 |
| Module-wise count rates for Quadrant C Data is divided into 100 sec bins |
 |
 |
| Module-wise count rates for Quadrant D Data is divided into 100 sec bins |
 |
 |
| Parameter | Plot |
|---|---|
| CZT HV Monitor | 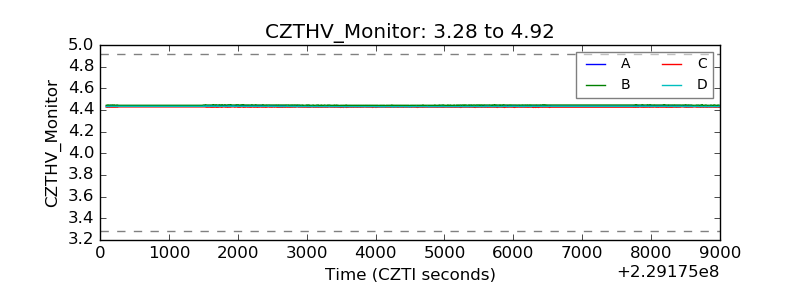 |
| D_VDD | 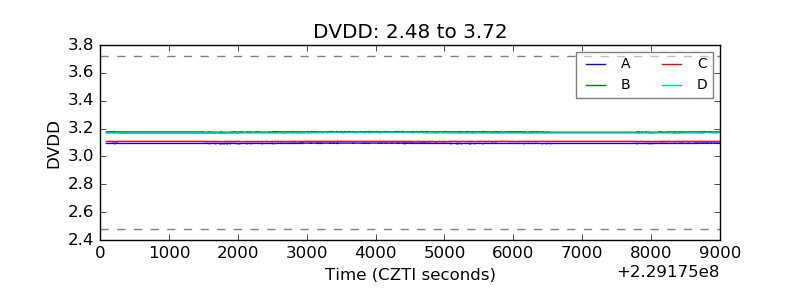 |
| Temperature 1 | 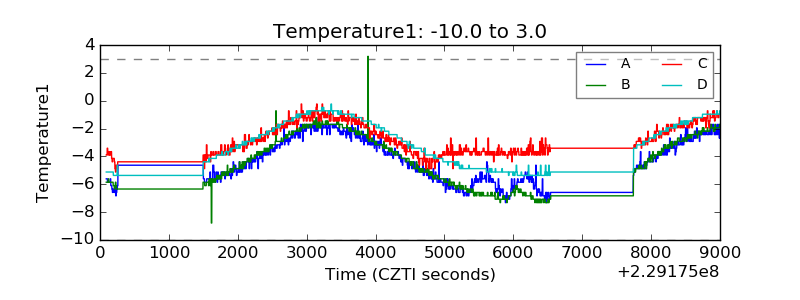 |
| Veto HV Monitor | 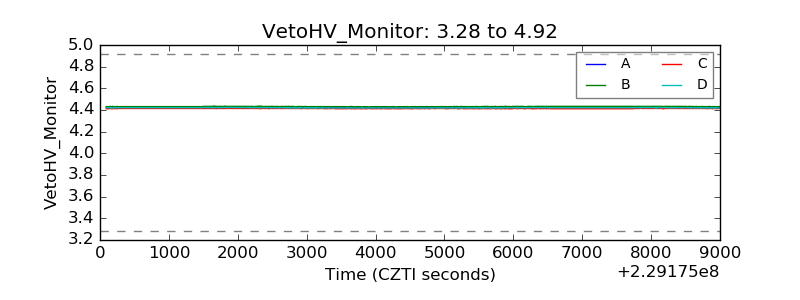 |
| Veto LLD |  |
| Alpha Counter | 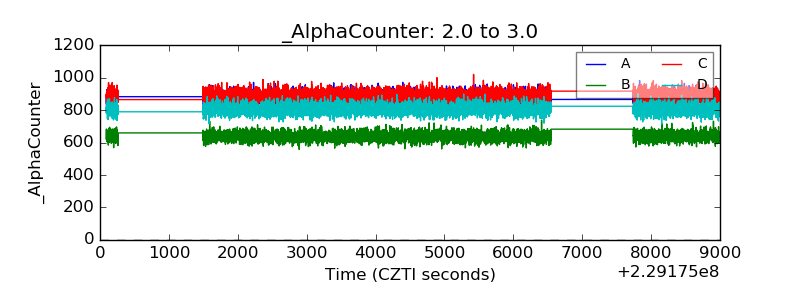 |
| _CPM_Rate | 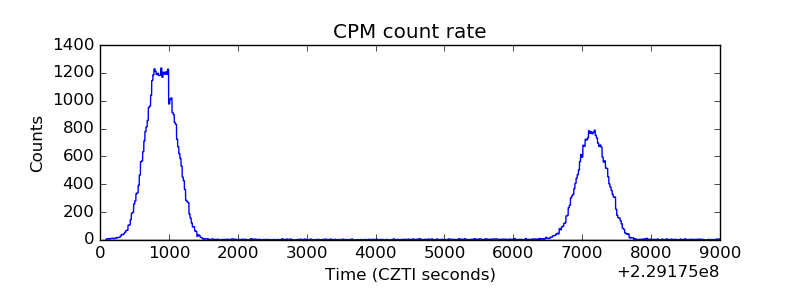 |
| CZT Counter | 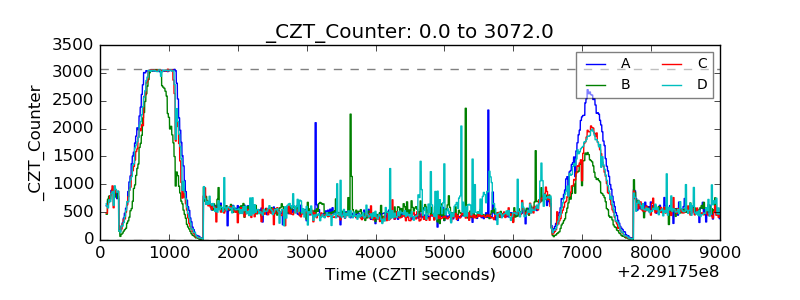 |
| +2.5 Volts monitor |  |
| +5 Volts monitor |  |
| _ROLL_ROT | 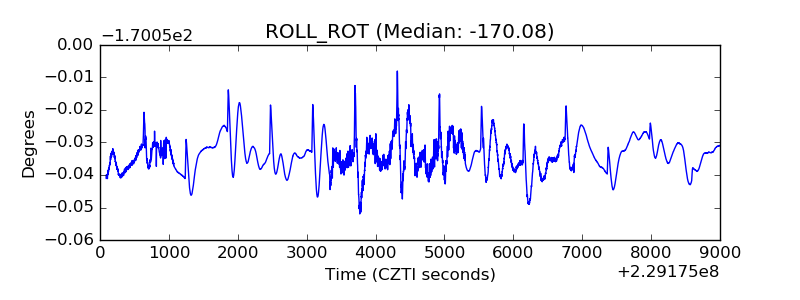 |
| _Roll_DEC | 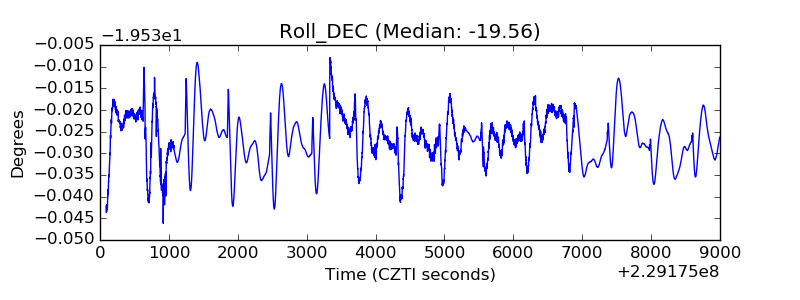 |
| _Roll_RA | 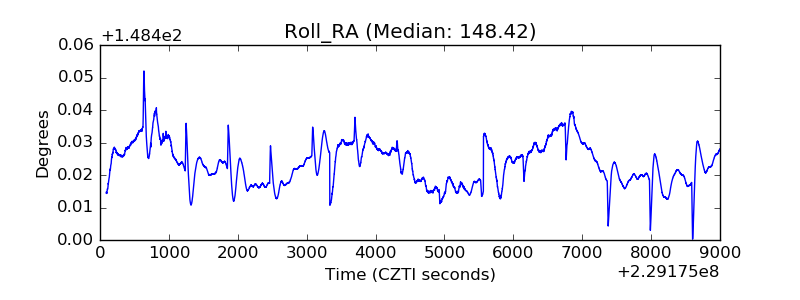 |
| Veto Counter | 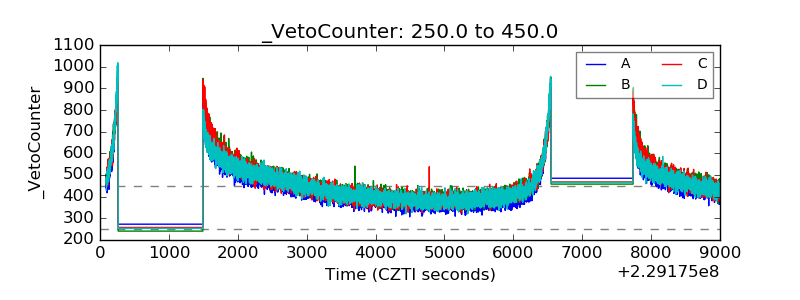 |