| Param | Original file | Final file |
|---|---|---|
| Filename | modeM0/AS1G07_070T01_9000001138_08237cztM0_level2.evt | modeM0/AS1G07_070T01_9000001138_08237cztM0_level2_quad_clean.evt |
| Size (bytes) | 215,380,800 | 62,991,360 |
| Size | 205.4 MB | 60.1 MB |
| Events in quadrant A | 1,595,499 | 424,838 |
| Events in quadrant B | 1,688,344 | 424,689 |
| Events in quadrant C | 1,438,815 | 417,953 |
| Events in quadrant D | 1,574,325 | 406,217 |
| Mode SS | |||
|---|---|---|---|
| Quadrant | BADHDUFLAG | Total packets | Discarded packets |
| A | 0 | 66 | 0 |
| B | 0 | 66 | 0 |
| C | 0 | 66 | 0 |
| D | 0 | 66 | 0 |
| Mode M0 | |||
|---|---|---|---|
| Quadrant | BADHDUFLAG | Total packets | Discarded packets |
| A | 0 | 6791 | 0 |
| B | 0 | 7026 | 0 |
| C | 0 | 6625 | 0 |
| D | 0 | 6992 | 0 |
| Quadrant | Total seconds | Saturated seconds | Saturation percentage |
|---|---|---|---|
| A | 3292 | 5 | 0.151883% |
| B | 3292 | 10 | 0.303767% |
| C | 3292 | 0 | 0.000000% |
| D | 3292 | 6 | 0.182260% |
Noise dominated data is calculated using 1-second bins in cleaned event files. If a bin has >2000 counts, and if more than 50% of those come from <1% of pixels, then it is considered to be noise-dominated and hence unusable.
| Quadrant | # 1 sec bins | Bins with >0 counts | Bins with >2000 counts | High rate bins dominated by noise | Noise dominated (total time) | Noise dominated (detector-on time) | Marked lightcurve |
|---|---|---|---|---|---|---|---|
| A | 3292 | 3292 | 0 | 0 | 0.00% | 0.00% | 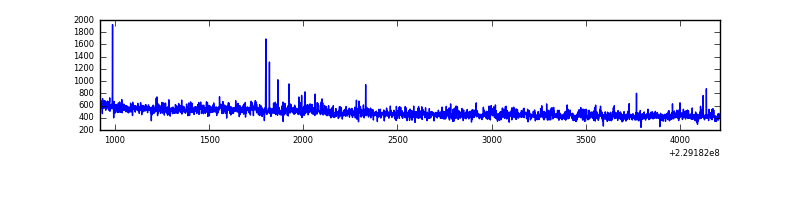 |
| B | 3292 | 3292 | 3 | 3 | 0.09% | 0.09% | 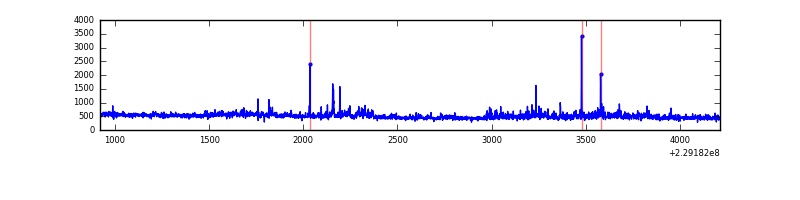 |
| C | 3292 | 3292 | 0 | 0 | 0.00% | 0.00% | 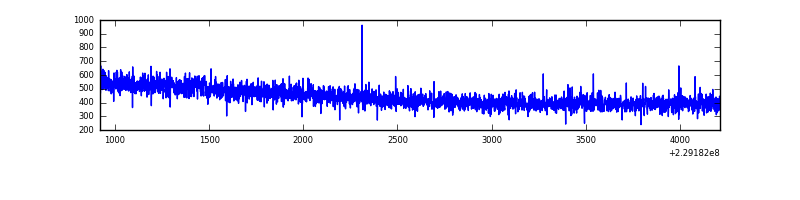 |
| D | 3292 | 3292 | 4 | 4 | 0.12% | 0.12% | 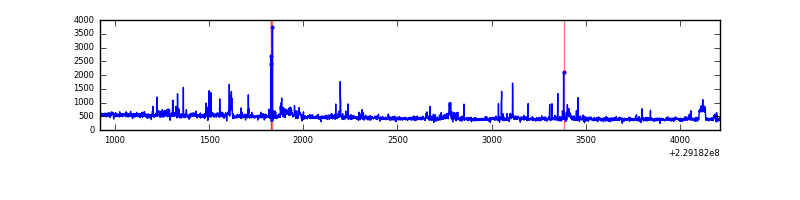 |
Top three noisy pixels from each quadrant. If the there are fewer than three noisy pixels in the level2.evt file, extra rows are filled as -1
| Pixel properties | Quadrant properties | ||||||
|---|---|---|---|---|---|---|---|
| Quadrant | DetID | PixID | Counts | Sigma | Mean | Median | Sigma |
| A | 8 | 15 | 82072 | 1020.38 | 390 | 383 | 80.1 |
| A | 5 | 16 | 5629 | 65.53 | 390 | 383 | 80.1 |
| A | 0 | 226 | 3814 | 42.86 | 390 | 383 | 80.1 |
| B | 11 | 51 | 99774 | 1338.77 | 385 | 377 | 74.2 |
| B | 0 | 214 | 44476 | 593.97 | 385 | 377 | 74.2 |
| B | 0 | 219 | 14059 | 184.28 | 385 | 377 | 74.2 |
| C | 7 | 237 | 4039 | 42.75 | 368 | 369 | 85.8 |
| C | 13 | 61 | 2717 | 27.35 | 368 | 369 | 85.8 |
| C | 3 | 202 | 975 | 7.05 | 368 | 369 | 85.8 |
| D | 1 | 52 | 53474 | 567.63 | 375 | 365 | 93.6 |
| D | 13 | 105 | 49654 | 526.8 | 375 | 365 | 93.6 |
| D | 12 | 221 | 21317 | 223.94 | 375 | 365 | 93.6 |
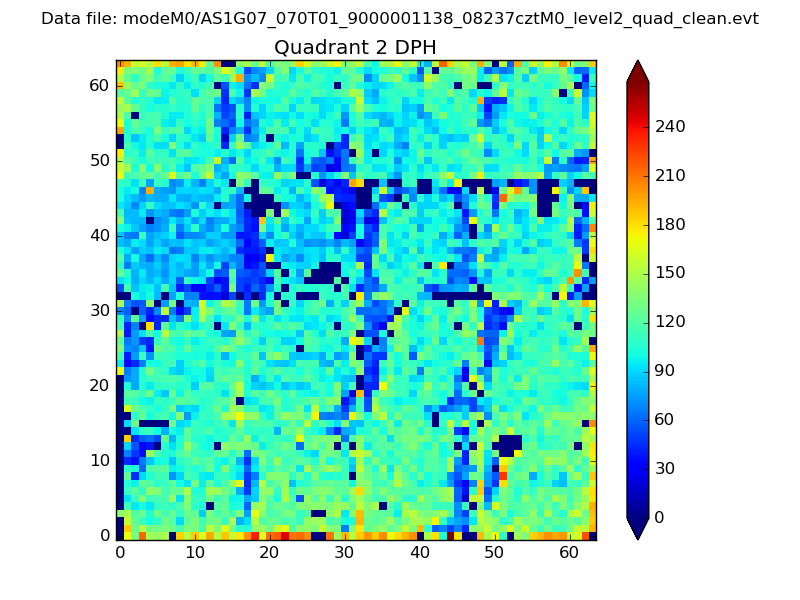
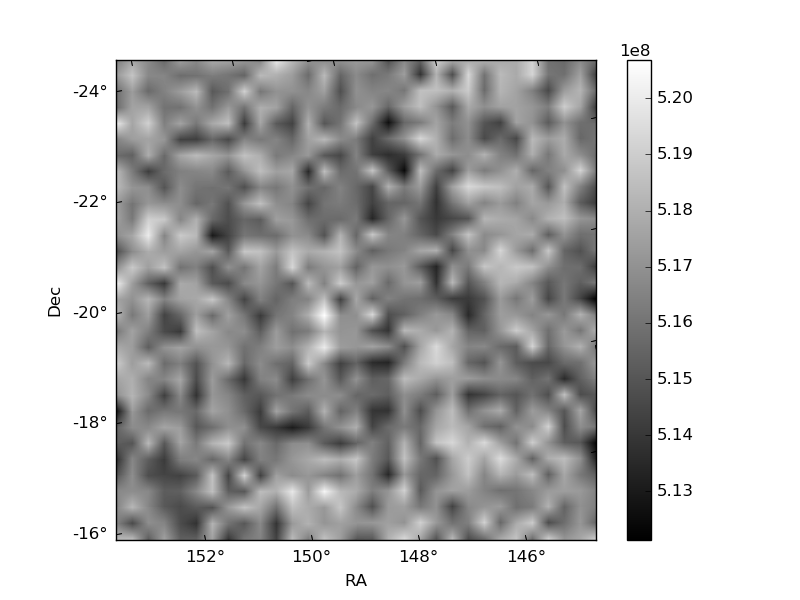
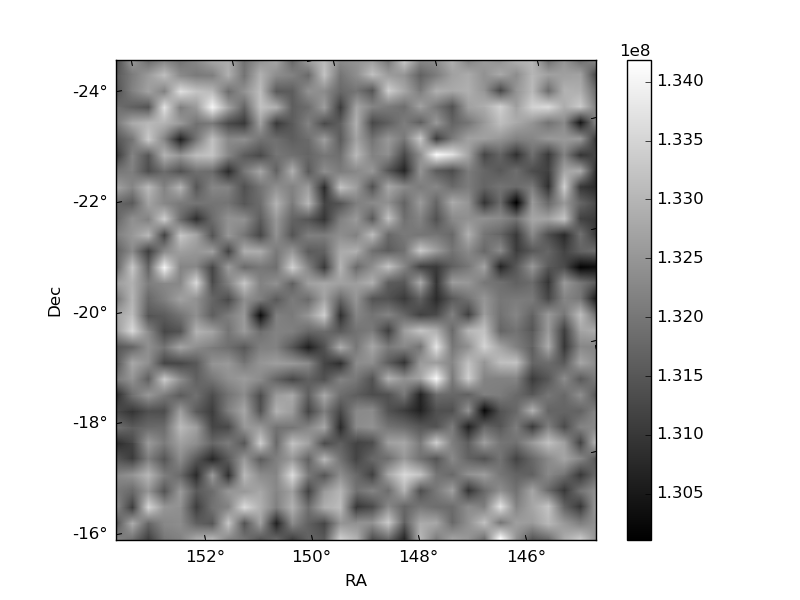
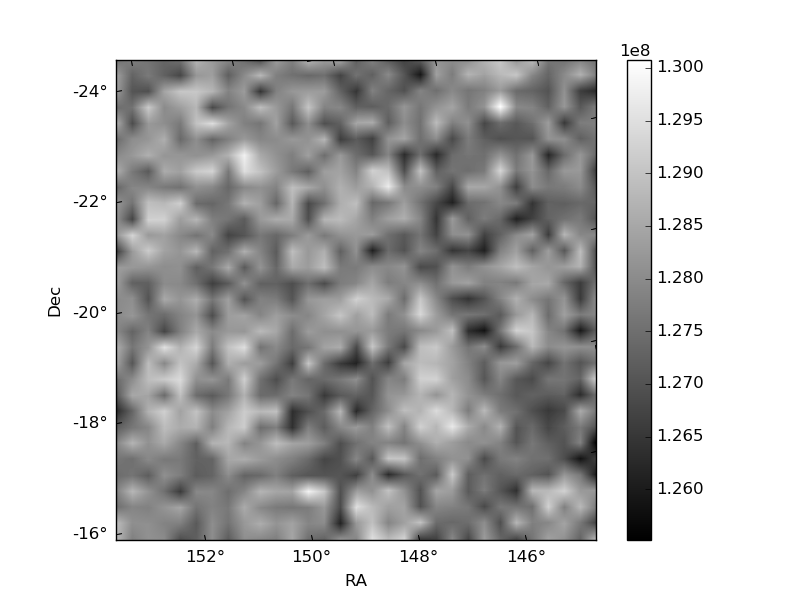
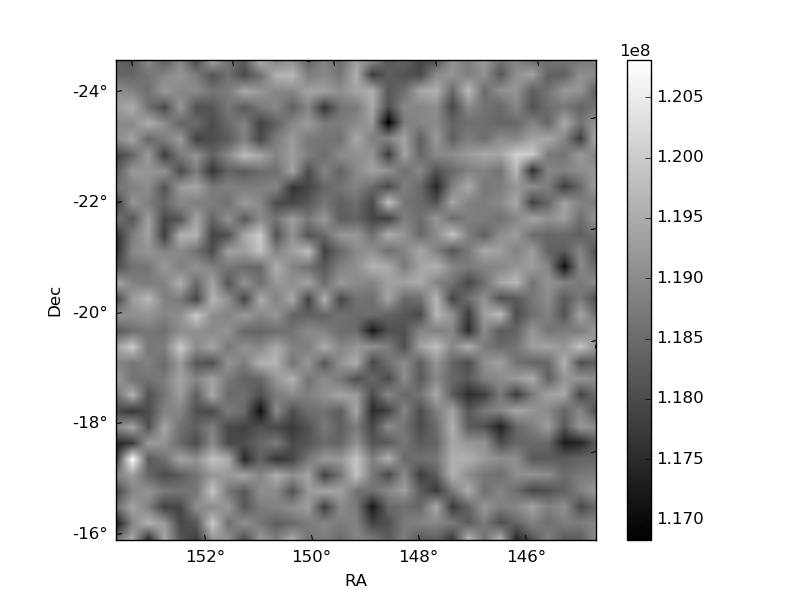
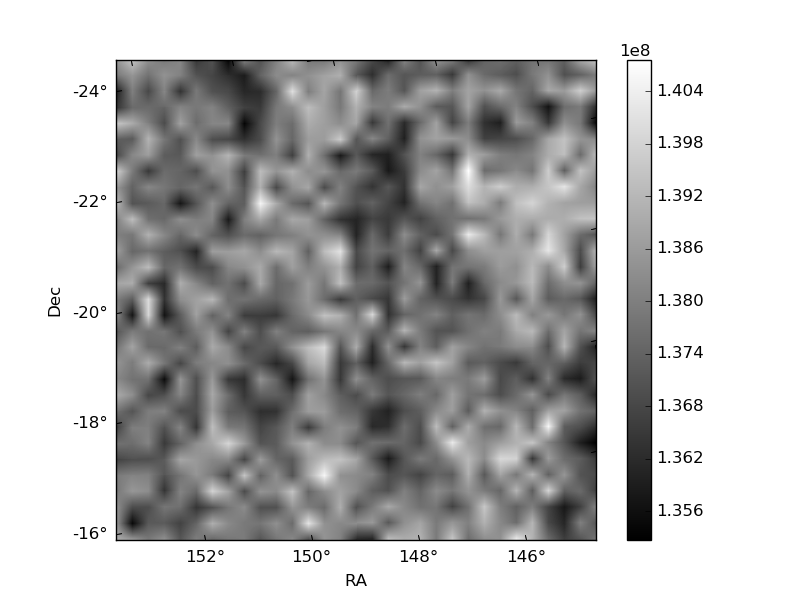
Histogram calculated using DETX and DETY for each event in the final _common_clean file
| Quadrant A | 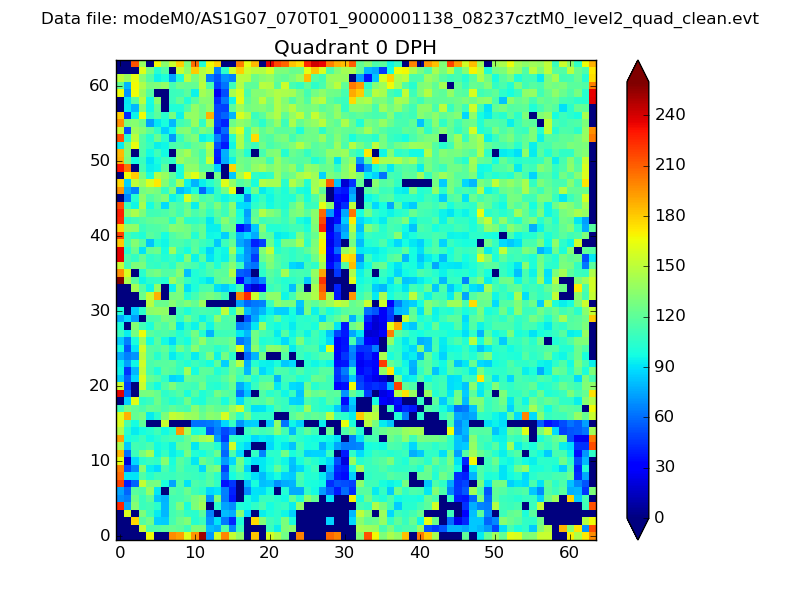 |
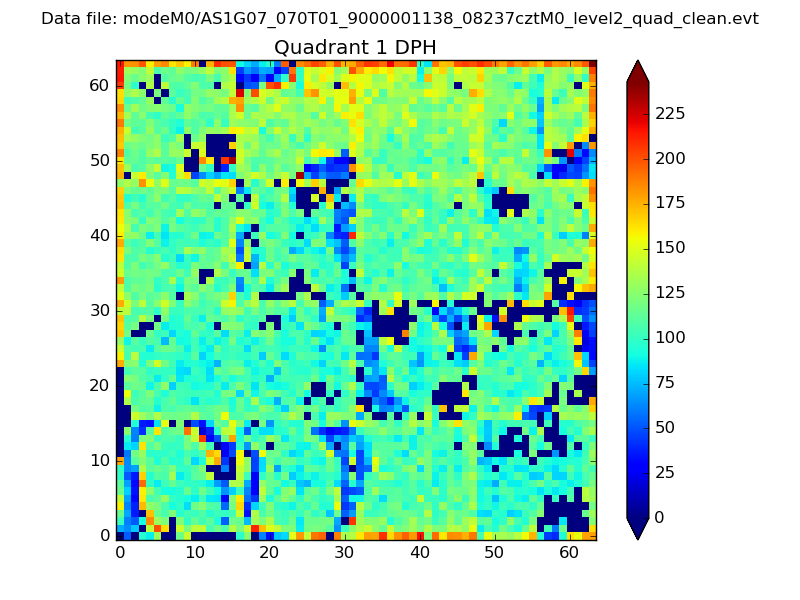 |
Quadrant B |
|---|---|---|---|
| Quadrant D | 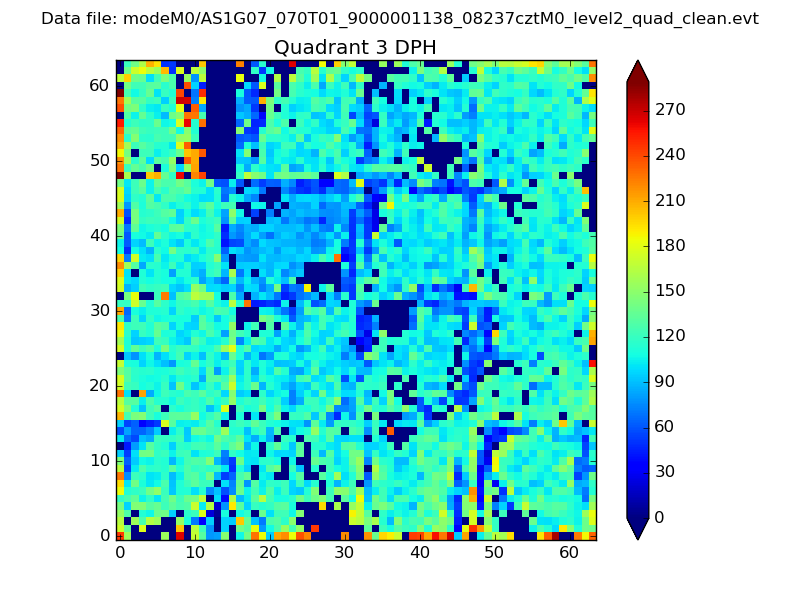 |
 |
Quadrant C |
| Plot type | Count rate plots | Images |
|---|---|---|
| Comparison with Poisson distribution Blue bars denote a histogram of data divided into 1 sec bins. Red curve is a Poisson curve with rate = median count rate of data. |
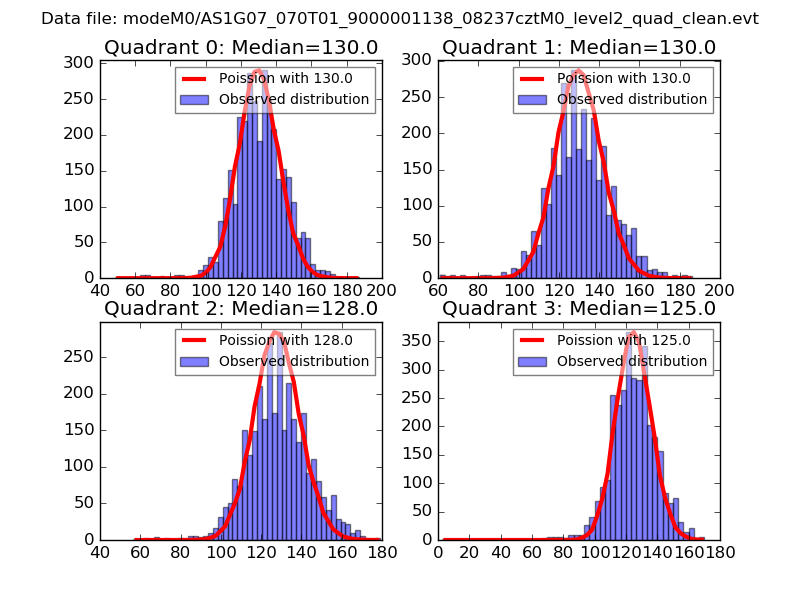 |
 |
| Quadrant-wise count rates Data is divided into 100 sec bins |
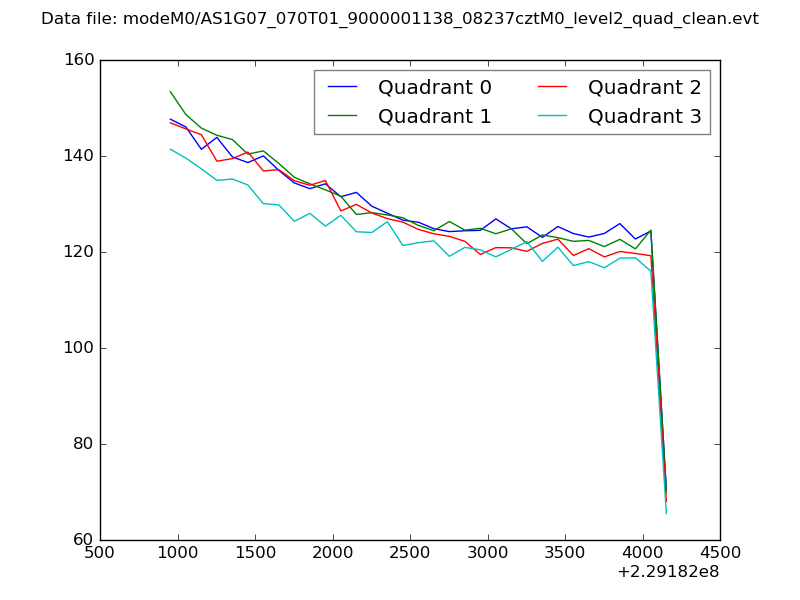 |
|
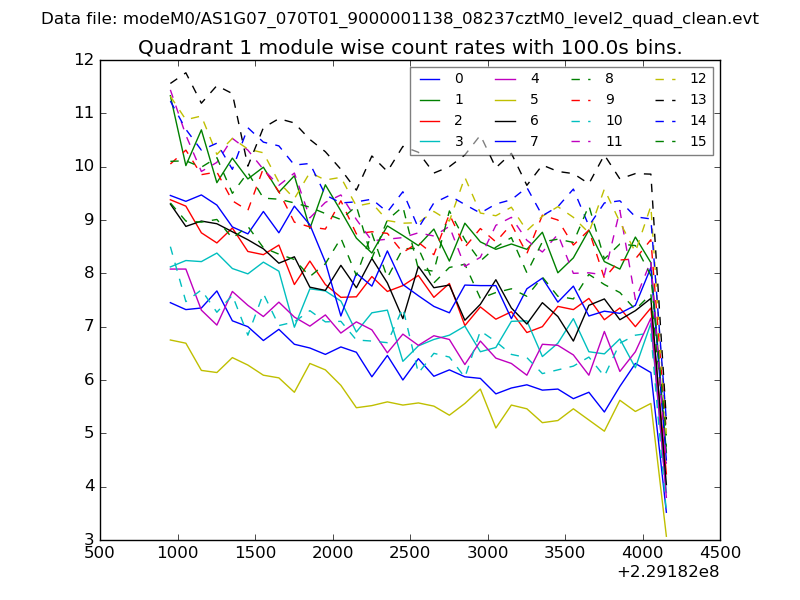
| Module-wise count rates for Quadrant A Data is divided into 100 sec bins |
 |
 |
| Module-wise count rates for Quadrant B Data is divided into 100 sec bins |
 |
 |
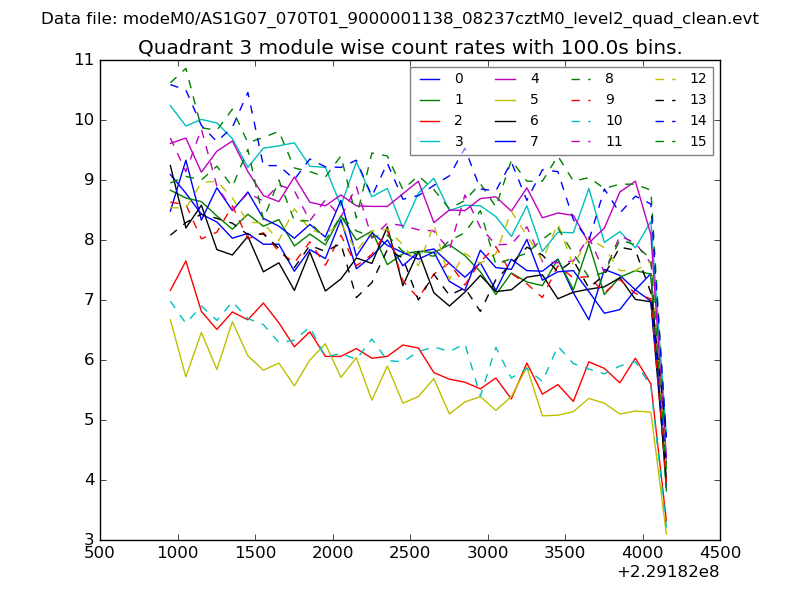
| Module-wise count rates for Quadrant C Data is divided into 100 sec bins |
 |
 |
| Module-wise count rates for Quadrant D Data is divided into 100 sec bins |
 |
 |
| Parameter | Plot |
|---|---|
| CZT HV Monitor | 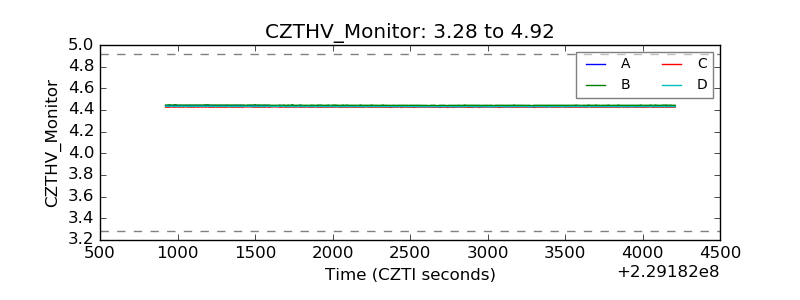 |
| D_VDD | 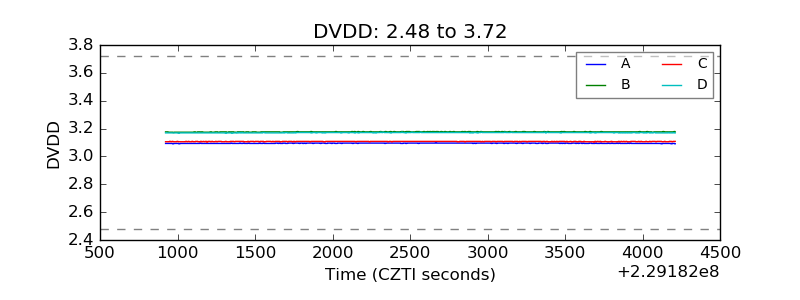 |
| Temperature 1 |  |
| Veto HV Monitor | 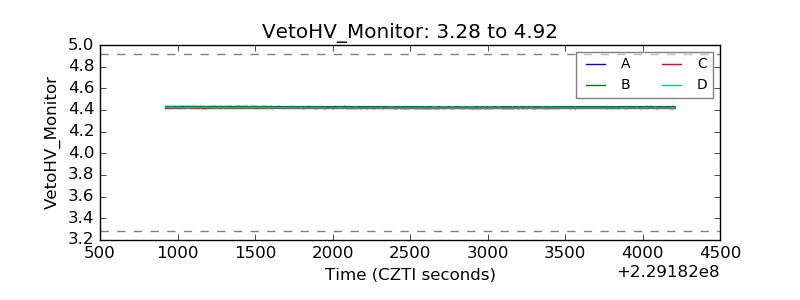 |
| Veto LLD |  |
| Alpha Counter |  |
| _CPM_Rate | 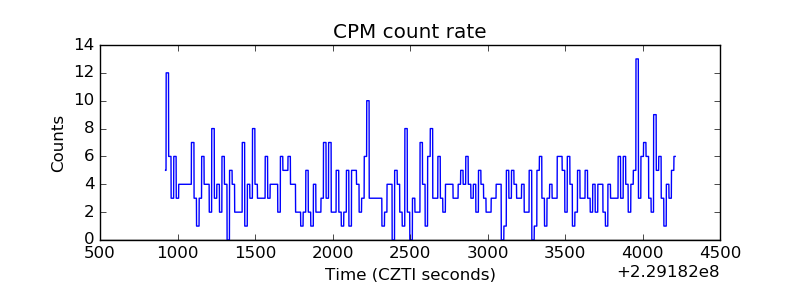 |
| CZT Counter | 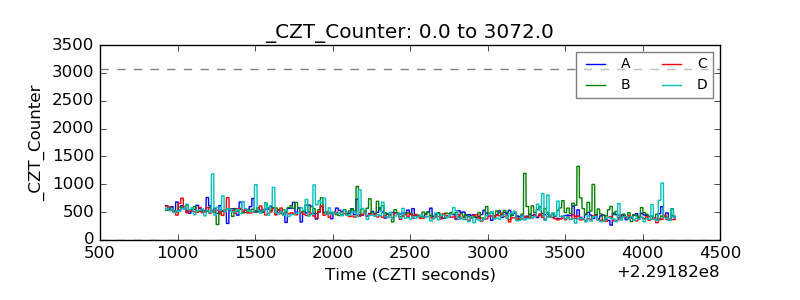 |
| +2.5 Volts monitor |  |
| +5 Volts monitor |  |
| _ROLL_ROT | 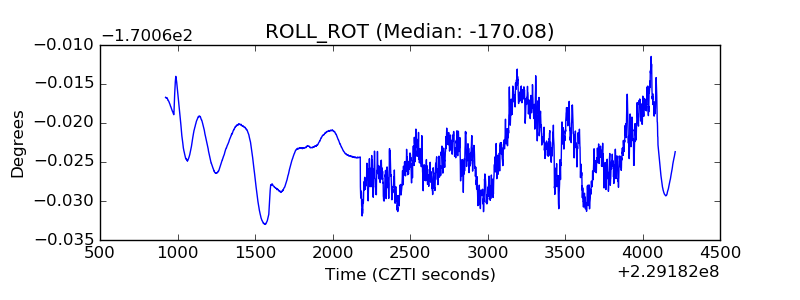 |
| _Roll_DEC | 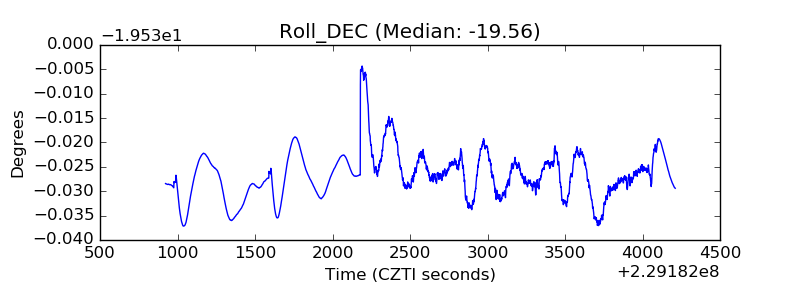 |
| _Roll_RA | 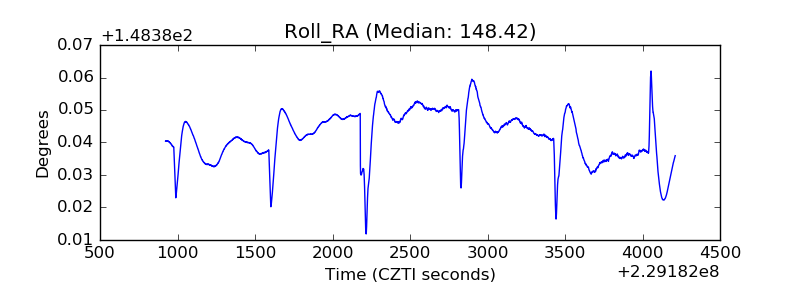 |
| Veto Counter | 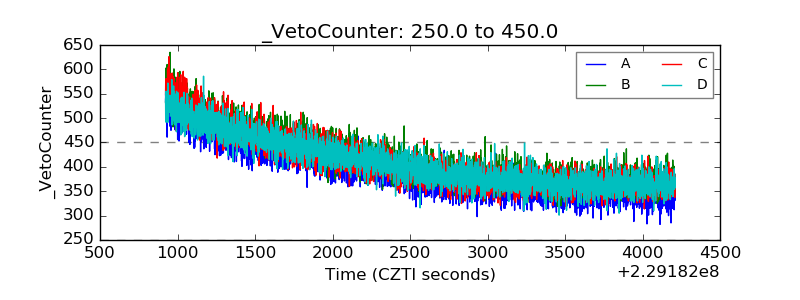 |