| Param | Original file | Final file |
|---|---|---|
| Filename | modeM0/AS1G07_086T01_9000001142cztM0_level2.fits | modeM0/AS1G07_086T01_9000001142cztM0_level2_quad_clean.evt |
| Size (bytes) | 473,097,600 | 476,311,680 |
| Size | 451.2 MB | 454.2 MB |
| Events in quadrant A | 2,855,270 | 2,860,890 |
| Events in quadrant B | 2,767,950 | 2,861,561 |
| Events in quadrant C | 2,819,968 | 2,736,024 |
| Events in quadrant D | 2,446,698 | 2,528,758 |
| Mode M0 | |||
|---|---|---|---|
| Quadrant | BADHDUFLAG | Total packets | Discarded packets |
| A | 0 | 102918 | 0 |
| B | 0 | 110049 | 0 |
| C | 0 | 102452 | 0 |
| D | 0 | 109314 | 0 |
| Mode SS | |||
|---|---|---|---|
| Quadrant | BADHDUFLAG | Total packets | Discarded packets |
| A | 0 | 1022 | 0 |
| B | 0 | 1020 | 0 |
| C | 0 | 1022 | 0 |
| D | 0 | 1022 | 0 |
| Mode M9 | |||
|---|---|---|---|
| Quadrant | BADHDUFLAG | Total packets | Discarded packets |
| A | 0 | 81 | 0 |
| B | 0 | 81 | 0 |
| C | 0 | 81 | 0 |
| D | 0 | 81 | 0 |
| Quadrant | Total seconds | Saturated seconds | Saturation percentage |
|---|---|---|---|
| A | 50100 | 430 | 0.858283% |
| B | 50091 | 683 | 1.363518% |
| C | 50098 | 359 | 0.716595% |
| D | 50095 | 660 | 1.317497% |
Noise dominated data is calculated using 1-second bins in cleaned event files. If a bin has >2000 counts, and if more than 50% of those come from <1% of pixels, then it is considered to be noise-dominated and hence unusable.
| Quadrant | # 1 sec bins | Bins with >0 counts | Bins with >2000 counts | High rate bins dominated by noise | Noise dominated (total time) | Noise dominated (detector-on time) | Marked lightcurve |
|---|---|---|---|---|---|---|---|
| A | 58310 | 50111 | 0 | 0 | 0.00% | 0.00% |  |
| B | 58310 | 50112 | 0 | 0 | 0.00% | 0.00% |  |
| C | 58310 | 50111 | 0 | 0 | 0.00% | 0.00% |  |
| D | 58310 | 50111 | 0 | 0 | 0.00% | 0.00% | 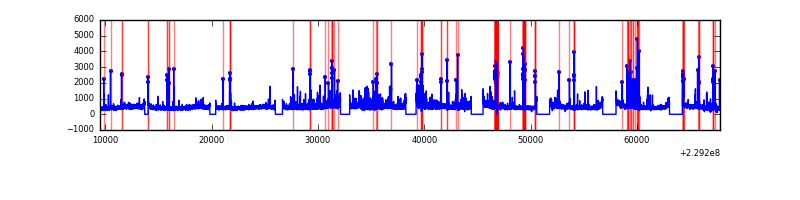 |
Top three noisy pixels from each quadrant. If the there are fewer than three noisy pixels in the level2.evt file, extra rows are filled as -1
| Pixel properties | Quadrant properties | ||||||
|---|---|---|---|---|---|---|---|
| Quadrant | DetID | PixID | Counts | Sigma | Mean | Median | Sigma |
| A | 0 | 29 | 2693 | 10.72 | 742 | 694 | 186.5 |
| A | 7 | 110 | 2319 | 8.72 | 742 | 694 | 186.5 |
| A | 0 | 30 | 2085 | 7.46 | 742 | 694 | 186.5 |
| B | 2 | 9 | 2373 | 11.59 | 729 | 695 | 144.8 |
| B | 12 | 226 | 1871 | 8.12 | 729 | 695 | 144.8 |
| B | 3 | 17 | 1851 | 7.98 | 729 | 695 | 144.8 |
| C | 1 | 81 | 2098 | 7.16 | 744 | 691 | 196.6 |
| C | 1 | 80 | 2077 | 7.05 | 744 | 691 | 196.6 |
| C | 12 | 241 | 1923 | 6.27 | 744 | 691 | 196.6 |
| D | 6 | 231 | 1793 | 6.17 | 697 | 632 | 188.1 |
| D | 7 | 3 | 1783 | 6.12 | 697 | 632 | 188.1 |
| D | 3 | 14 | 1769 | 6.04 | 697 | 632 | 188.1 |
Histogram calculated using DETX and DETY for each event in the final _common_clean file
| Quadrant A | 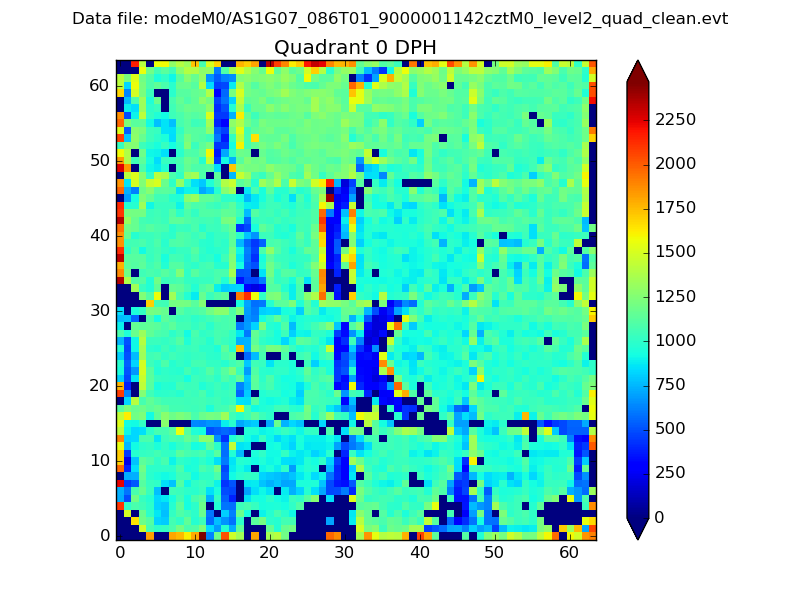 |
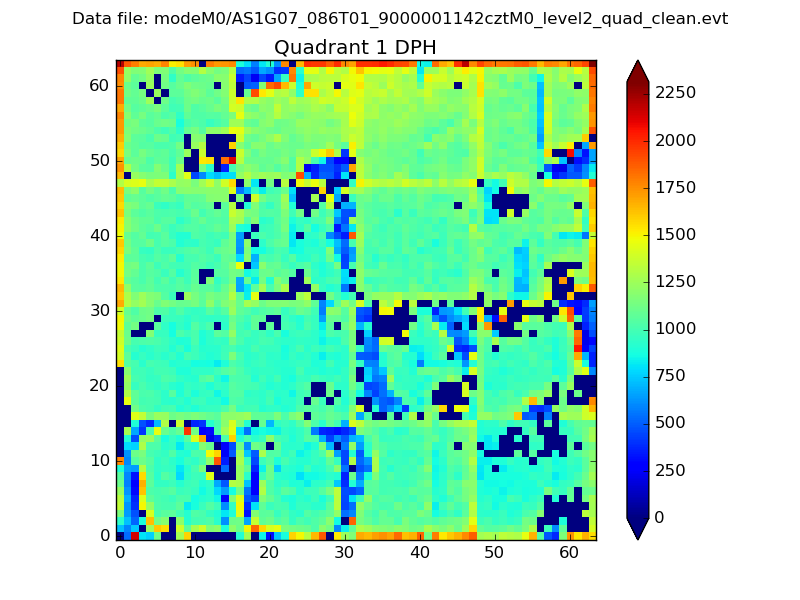 |
Quadrant B |
|---|---|---|---|
| Quadrant D | 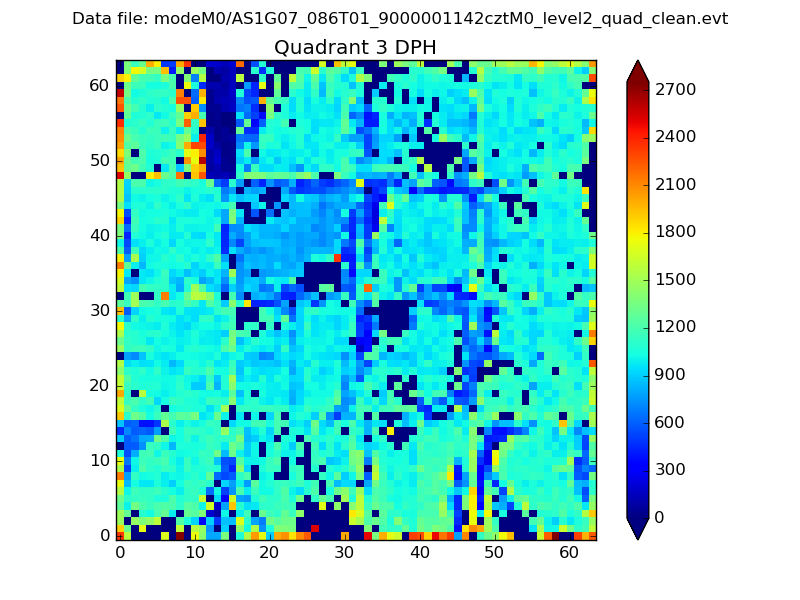 |
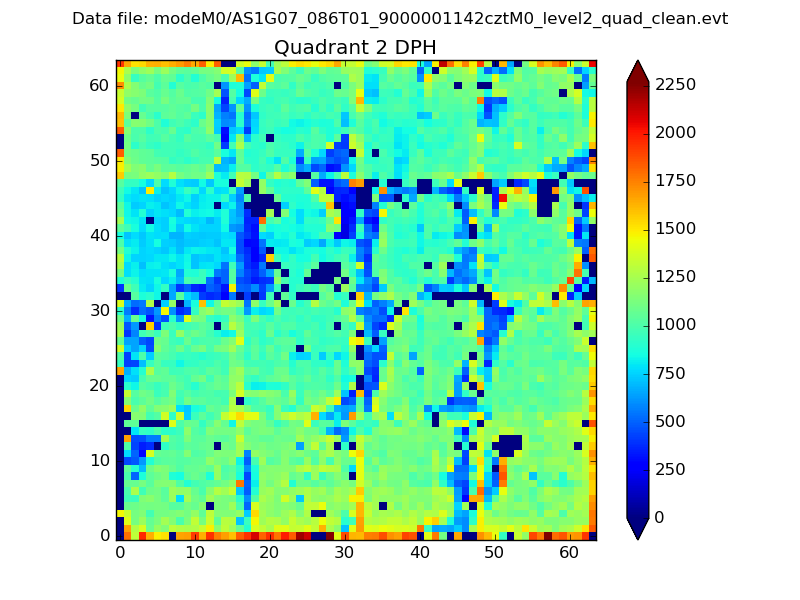 |
Quadrant C |
| Plot type | Count rate plots | Images |
|---|---|---|
| Comparison with Poisson distribution Blue bars denote a histogram of data divided into 1 sec bins. Red curve is a Poisson curve with rate = median count rate of data. |
 |
 |
| Quadrant-wise count rates Data is divided into 100 sec bins |
 |
|
| Module-wise count rates for Quadrant A Data is divided into 100 sec bins |
 |
 |
| Module-wise count rates for Quadrant B Data is divided into 100 sec bins |
 |
 |
| Module-wise count rates for Quadrant C Data is divided into 100 sec bins |
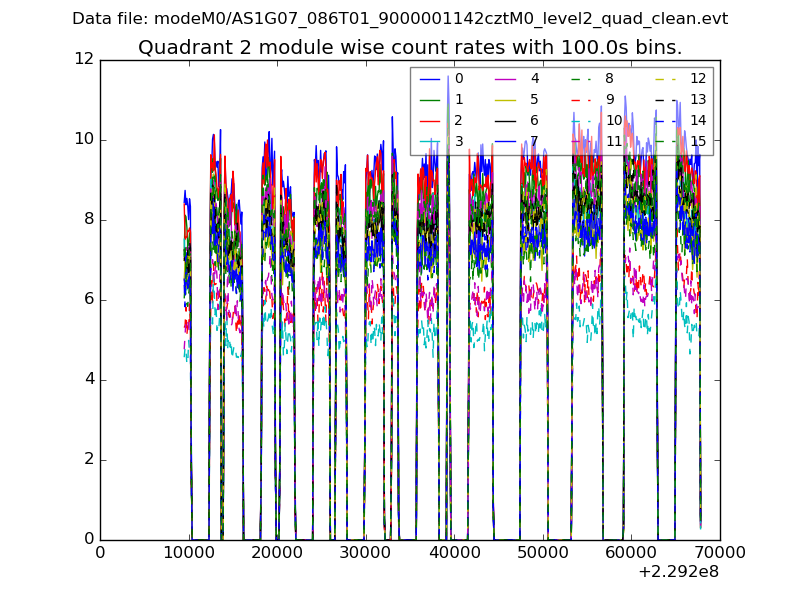 |
 |
| Module-wise count rates for Quadrant D Data is divided into 100 sec bins |
 |
 |
| Parameter | Plot |
|---|---|
| CZT HV Monitor |  |
| D_VDD |  |
| Temperature 1 |  |
| Veto HV Monitor |  |
| Veto LLD |  |
| Alpha Counter |  |
| _CPM_Rate |  |
| CZT Counter | 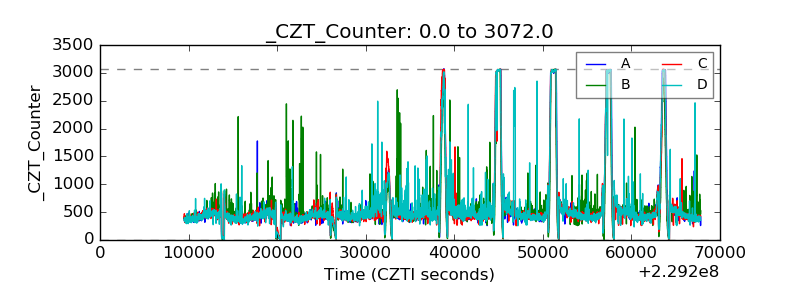 |
| +2.5 Volts monitor |  |
| +5 Volts monitor | 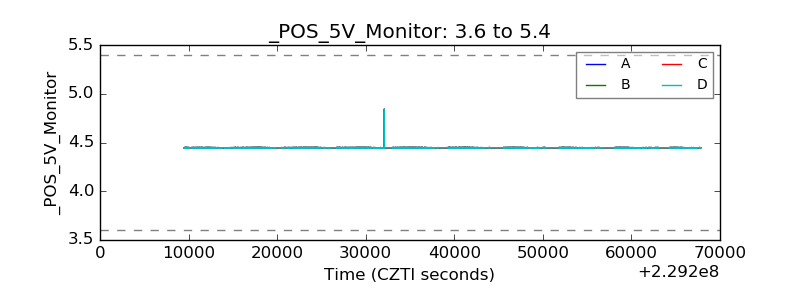 |
| _ROLL_ROT |  |
| _Roll_DEC |  |
| _Roll_RA |  |
| Veto Counter | 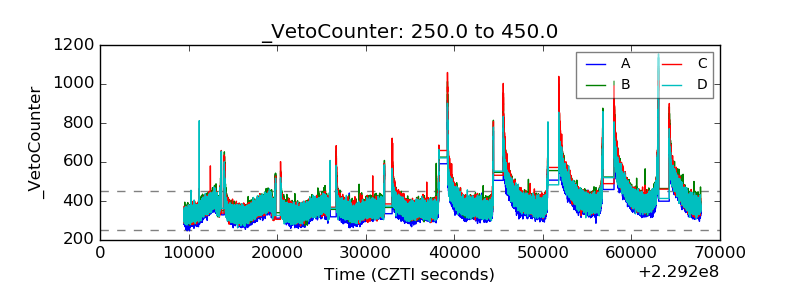 |