| Param | Original file | Final file |
|---|---|---|
| Filename | modeM0/AS1G07_086T01_9000001142_08241cztM0_level2.evt | modeM0/AS1G07_086T01_9000001142_08241cztM0_level2_quad_clean.evt |
| Size (bytes) | 355,628,160 | 69,586,560 |
| Size | 339.2 MB | 66.4 MB |
| Events in quadrant A | 2,583,676 | 433,565 |
| Events in quadrant B | 2,836,222 | 436,396 |
| Events in quadrant C | 2,493,197 | 425,365 |
| Events in quadrant D | 2,468,236 | 412,711 |
| Mode M0 | |||
|---|---|---|---|
| Quadrant | BADHDUFLAG | Total packets | Discarded packets |
| A | 0 | 11713 | 2 |
| B | 0 | 12424 | 1 |
| C | 0 | 11575 | 1 |
| D | 0 | 11662 | 1 |
| Mode SS | |||
|---|---|---|---|
| Quadrant | BADHDUFLAG | Total packets | Discarded packets |
| A | 0 | 116 | 0 |
| B | 0 | 116 | 0 |
| C | 0 | 116 | 0 |
| D | 0 | 116 | 0 |
| Mode M9 | |||
|---|---|---|---|
| Quadrant | BADHDUFLAG | Total packets | Discarded packets |
| A | 0 | 3 | 0 |
| B | 0 | 3 | 0 |
| C | 0 | 3 | 0 |
| D | 0 | 3 | 0 |
| Quadrant | Total seconds | Saturated seconds | Saturation percentage |
|---|---|---|---|
| A | 5707 | 35 | 0.613282% |
| B | 5707 | 54 | 0.946206% |
| C | 5707 | 14 | 0.245313% |
| D | 5707 | 17 | 0.297880% |
Noise dominated data is calculated using 1-second bins in cleaned event files. If a bin has >2000 counts, and if more than 50% of those come from <1% of pixels, then it is considered to be noise-dominated and hence unusable.
| Quadrant | # 1 sec bins | Bins with >0 counts | Bins with >2000 counts | High rate bins dominated by noise | Noise dominated (total time) | Noise dominated (detector-on time) | Marked lightcurve |
|---|---|---|---|---|---|---|---|
| A | 6032 | 5708 | 2 | 2 | 0.03% | 0.04% | 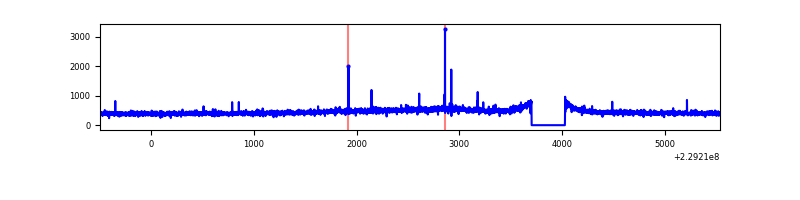 |
| B | 6032 | 5707 | 12 | 12 | 0.20% | 0.21% | 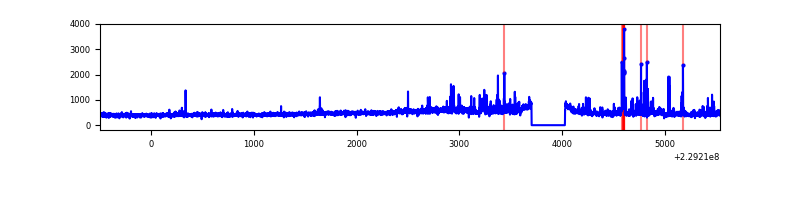 |
| C | 6032 | 5708 | 0 | 0 | 0.00% | 0.00% | 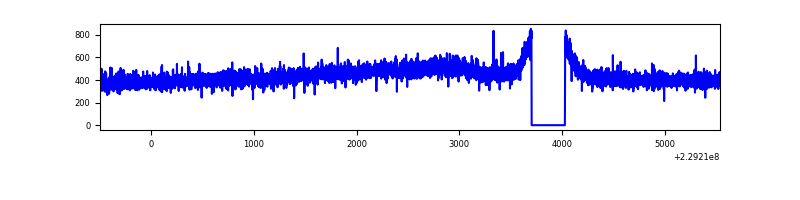 |
| D | 6032 | 5708 | 6 | 6 | 0.10% | 0.11% | 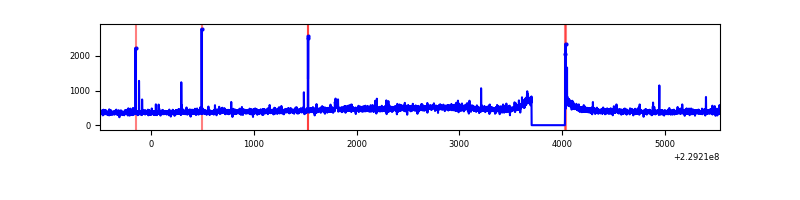 |
Top three noisy pixels from each quadrant. If the there are fewer than three noisy pixels in the level2.evt file, extra rows are filled as -1
| Pixel properties | Quadrant properties | ||||||
|---|---|---|---|---|---|---|---|
| Quadrant | DetID | PixID | Counts | Sigma | Mean | Median | Sigma |
| A | 8 | 15 | 24896 | 177.91 | 660 | 645 | 136.3 |
| A | 5 | 16 | 10169 | 69.87 | 660 | 645 | 136.3 |
| A | 0 | 226 | 6282 | 41.35 | 660 | 645 | 136.3 |
| B | 10 | 16 | 89540 | 688.58 | 664 | 648 | 129.1 |
| B | 11 | 51 | 71994 | 552.66 | 664 | 648 | 129.1 |
| B | 0 | 214 | 50632 | 387.19 | 664 | 648 | 129.1 |
| C | 13 | 61 | 5031 | 29.19 | 639 | 639 | 150.4 |
| C | 3 | 202 | 1650 | 6.72 | 639 | 639 | 150.4 |
| C | -1 | -1 | -1 | -1.0 | 639 | 639 | 150.4 |
| D | 2 | 234 | 25594 | 147.27 | 633 | 614 | 169.6 |
| D | 13 | 105 | 15307 | 86.62 | 633 | 614 | 169.6 |
| D | 12 | 233 | 9860 | 54.51 | 633 | 614 | 169.6 |
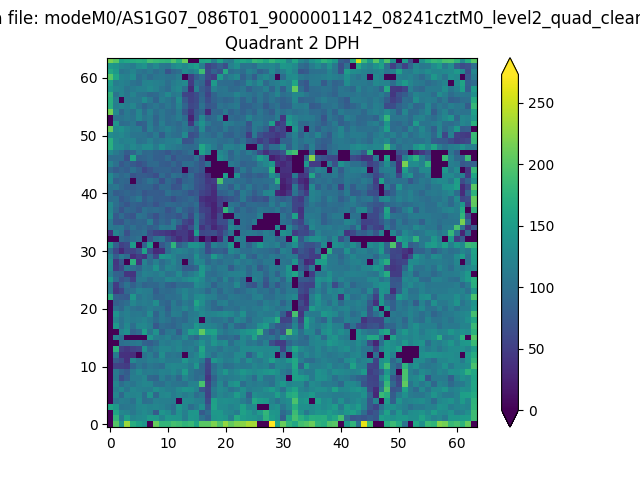
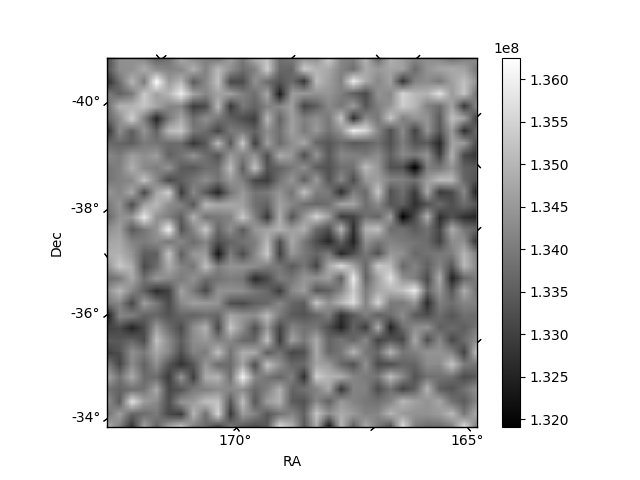
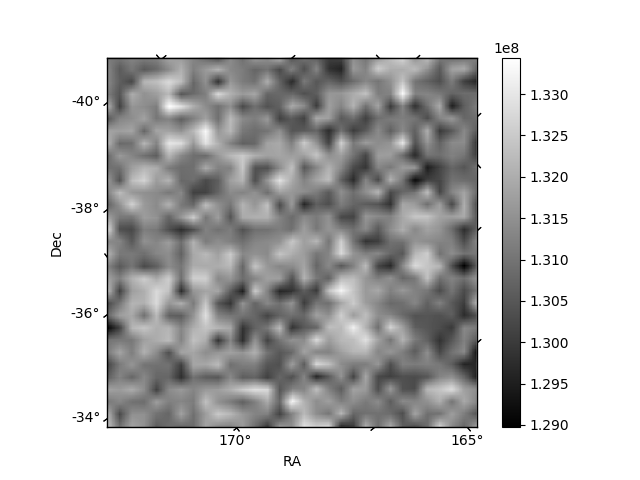
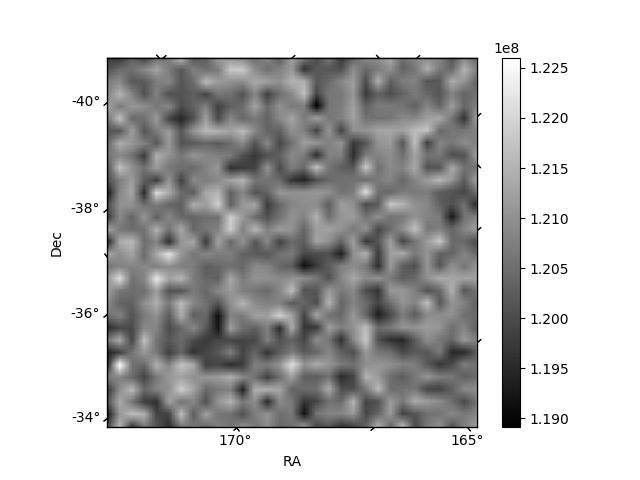
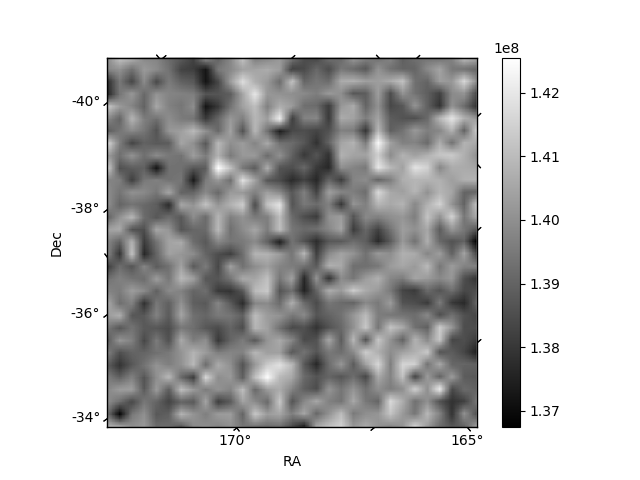
Histogram calculated using DETX and DETY for each event in the final _common_clean file
| Quadrant A | 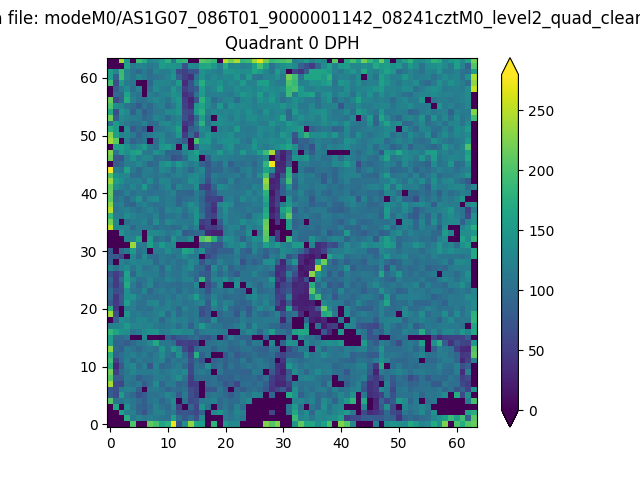 |
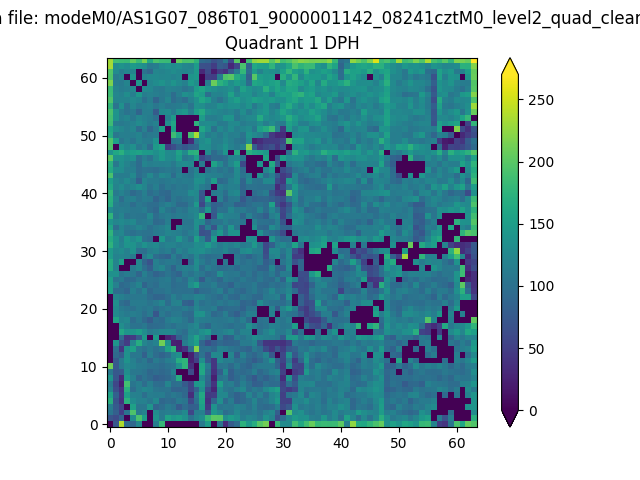 |
Quadrant B |
|---|---|---|---|
| Quadrant D | 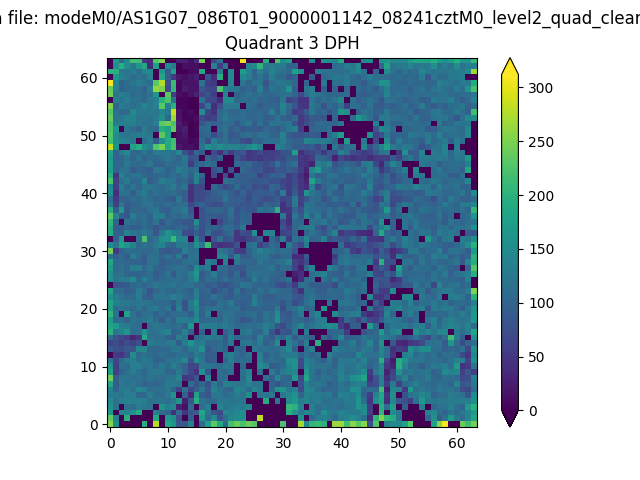 |
 |
Quadrant C |
| Plot type | Count rate plots | Images |
|---|---|---|
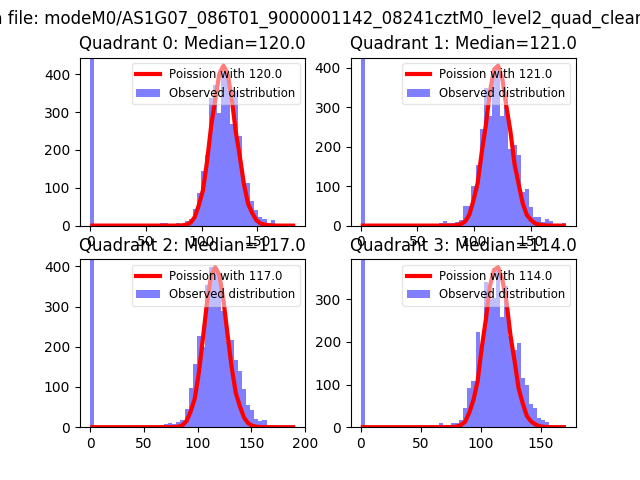
| Comparison with Poisson distribution Blue bars denote a histogram of data divided into 1 sec bins. Red curve is a Poisson curve with rate = median count rate of data. |
 |
 |
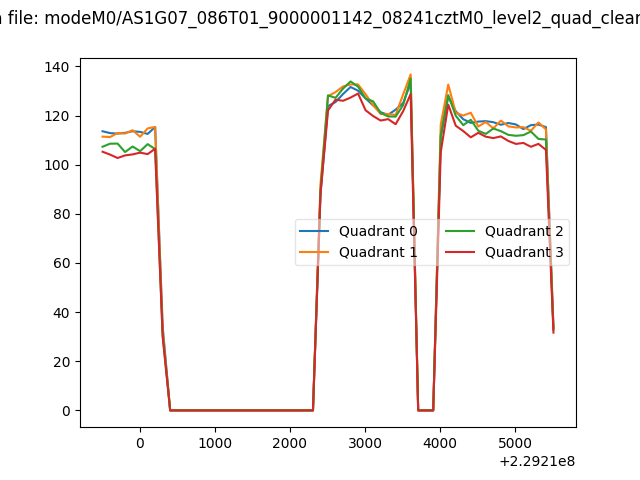
| Quadrant-wise count rates Data is divided into 100 sec bins |
 |
|
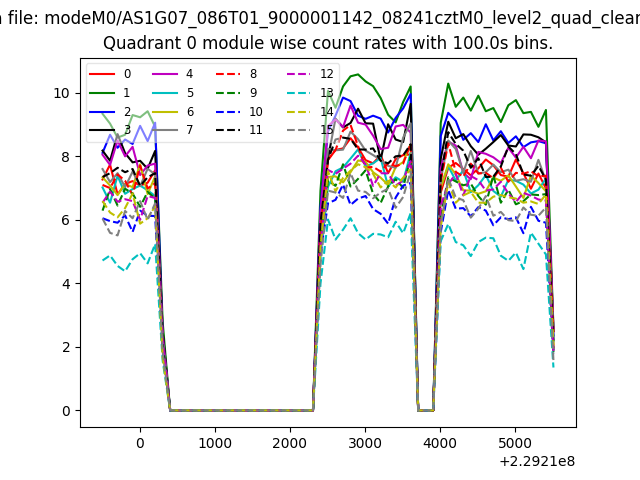
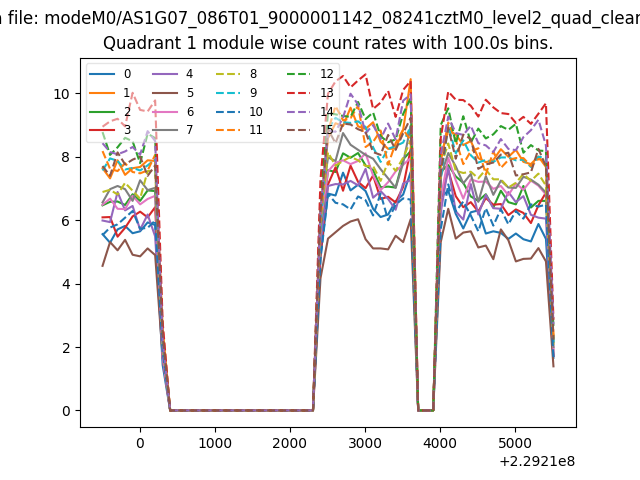
| Module-wise count rates for Quadrant A Data is divided into 100 sec bins |
 |
 |
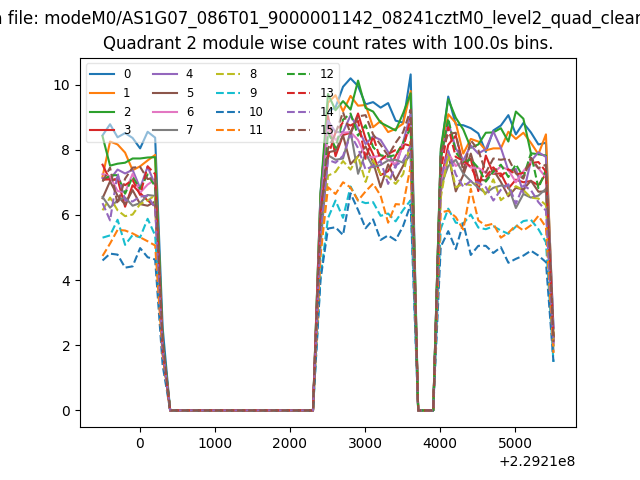
| Module-wise count rates for Quadrant B Data is divided into 100 sec bins |
 |
 |
| Module-wise count rates for Quadrant C Data is divided into 100 sec bins |
 |
 |
| Module-wise count rates for Quadrant D Data is divided into 100 sec bins |
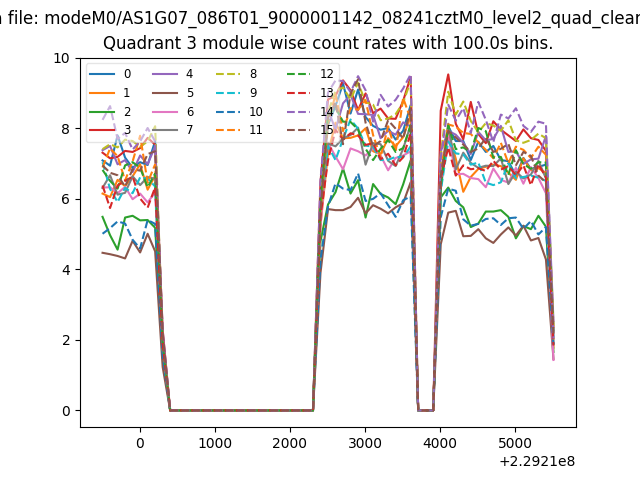 |
 |
| Parameter | Plot |
|---|---|
| CZT HV Monitor | 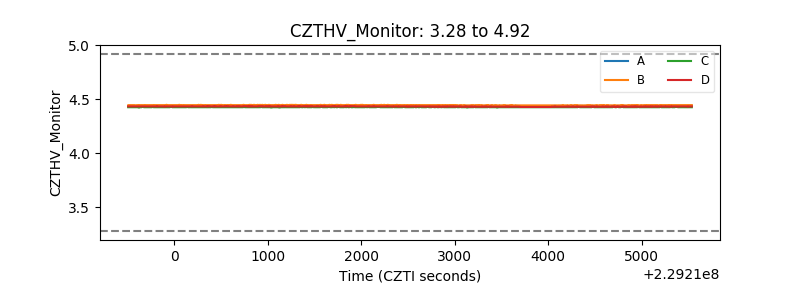 |
| D_VDD | 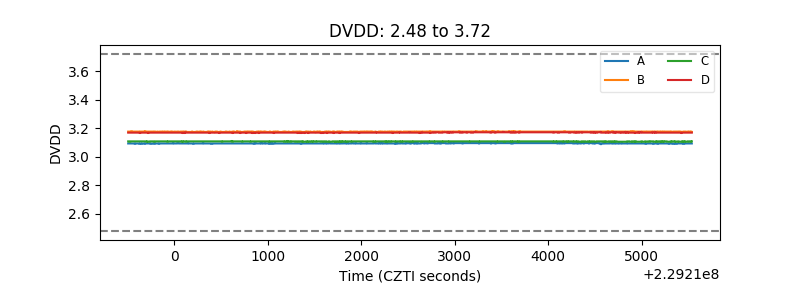 |
| Temperature 1 | 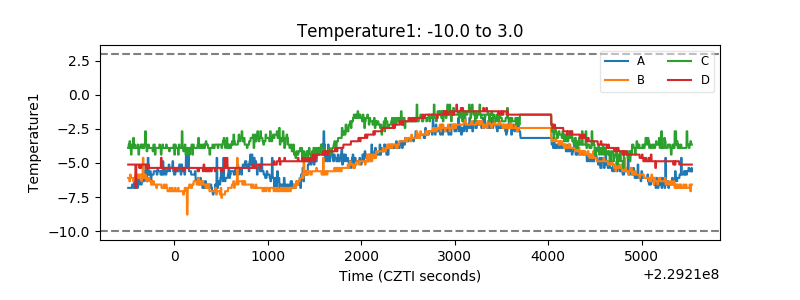 |
| Veto HV Monitor | 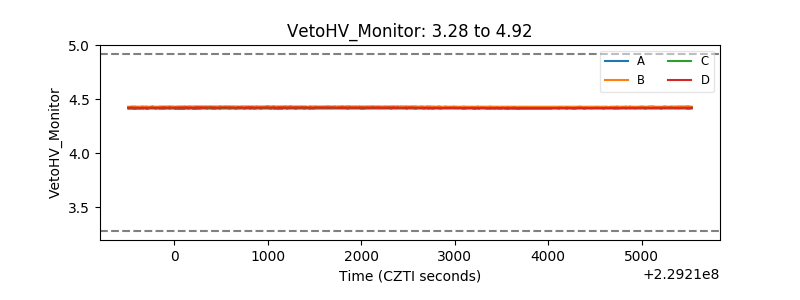 |
| Veto LLD |  |
| Alpha Counter |  |
| _CPM_Rate | 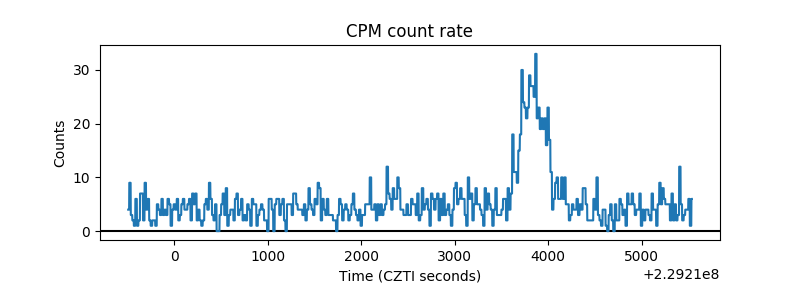 |
| CZT Counter | 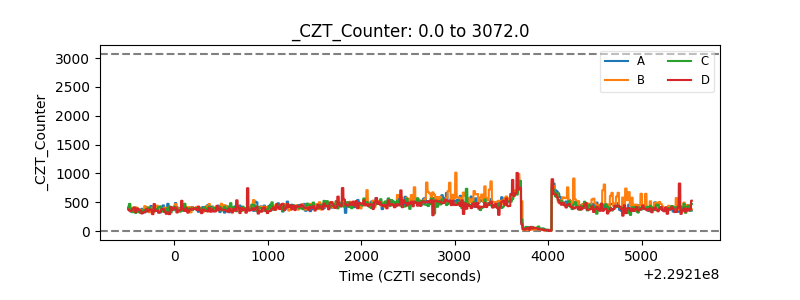 |
| +2.5 Volts monitor |  |
| +5 Volts monitor |  |
| _ROLL_ROT | 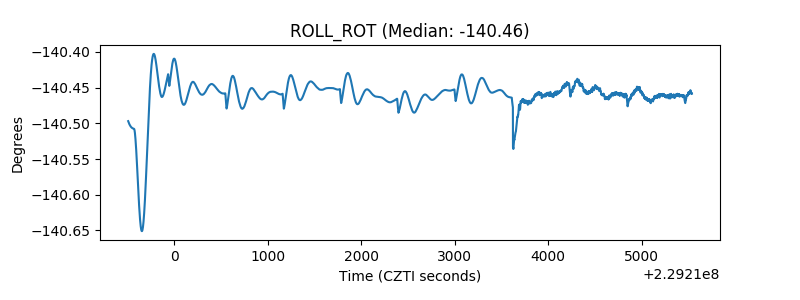 |
| _Roll_DEC | 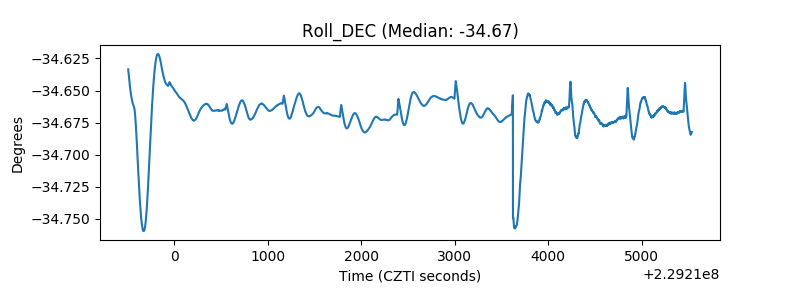 |
| _Roll_RA | 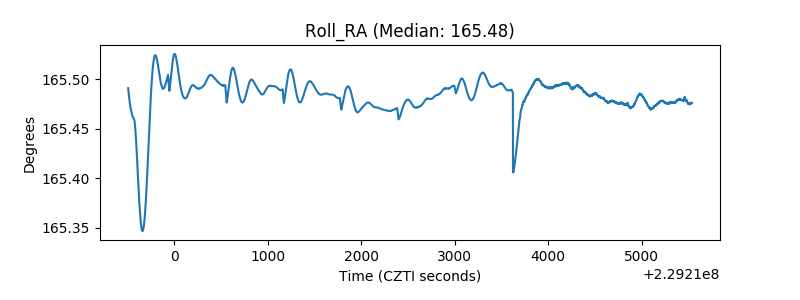 |
| Veto Counter | 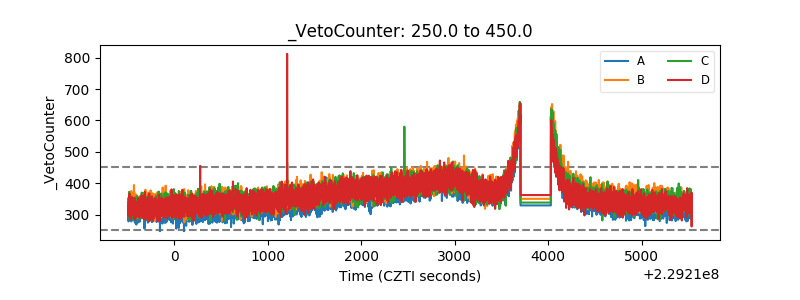 |