| Param | Original file | Final file |
|---|---|---|
| Filename | modeM0/AS1G07_086T01_9000001142_08247cztM0_level2.evt | modeM0/AS1G07_086T01_9000001142_08247cztM0_level2_quad_clean.evt |
| Size (bytes) | 447,937,920 | 65,165,760 |
| Size | 427.2 MB | 62.1 MB |
| Events in quadrant A | 3,017,524 | 382,739 |
| Events in quadrant B | 3,354,399 | 387,770 |
| Events in quadrant C | 3,041,308 | 384,216 |
| Events in quadrant D | 3,715,531 | 369,524 |
| Mode M0 | |||
|---|---|---|---|
| Quadrant | BADHDUFLAG | Total packets | Discarded packets |
| A | 0 | 13255 | 7 |
| B | 0 | 14039 | 14 |
| C | 0 | 13345 | 10 |
| D | 0 | 15313 | 6 |
| Mode SS | |||
|---|---|---|---|
| Quadrant | BADHDUFLAG | Total packets | Discarded packets |
| A | 0 | 130 | 0 |
| B | 0 | 130 | 0 |
| C | 0 | 130 | 0 |
| D | 0 | 130 | 0 |
| Mode M9 | |||
|---|---|---|---|
| Quadrant | BADHDUFLAG | Total packets | Discarded packets |
| A | 0 | 16 | 0 |
| B | 0 | 16 | 0 |
| C | 0 | 16 | 0 |
| D | 0 | 17 | 0 |
| Quadrant | Total seconds | Saturated seconds | Saturation percentage |
|---|---|---|---|
| A | 6434 | 61 | 0.948088% |
| B | 6431 | 100 | 1.554968% |
| C | 6432 | 63 | 0.979478% |
| D | 6434 | 163 | 2.533416% |
Noise dominated data is calculated using 1-second bins in cleaned event files. If a bin has >2000 counts, and if more than 50% of those come from <1% of pixels, then it is considered to be noise-dominated and hence unusable.
| Quadrant | # 1 sec bins | Bins with >0 counts | Bins with >2000 counts | High rate bins dominated by noise | Noise dominated (total time) | Noise dominated (detector-on time) | Marked lightcurve |
|---|---|---|---|---|---|---|---|
| A | 7546 | 6437 | 0 | 0 | 0.00% | 0.00% | 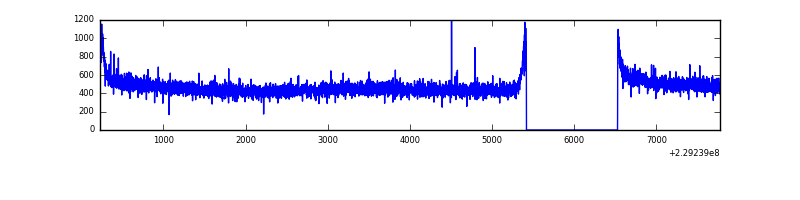 |
| B | 7546 | 6437 | 21 | 21 | 0.28% | 0.33% | 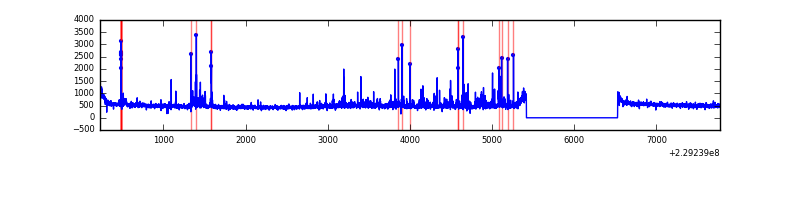 |
| C | 7546 | 6435 | 2 | 2 | 0.03% | 0.03% | 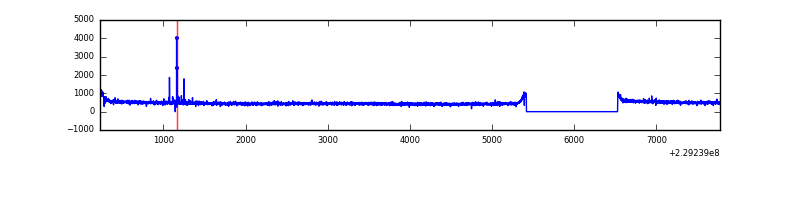 |
| D | 7545 | 6435 | 87 | 87 | 1.15% | 1.35% |  |
Top three noisy pixels from each quadrant. If the there are fewer than three noisy pixels in the level2.evt file, extra rows are filled as -1
| Pixel properties | Quadrant properties | ||||||
|---|---|---|---|---|---|---|---|
| Quadrant | DetID | PixID | Counts | Sigma | Mean | Median | Sigma |
| A | 0 | 226 | 7238 | 40.71 | 783 | 764 | 159.0 |
| A | 12 | 194 | 7008 | 39.26 | 783 | 764 | 159.0 |
| A | 8 | 15 | 6390 | 35.38 | 783 | 764 | 159.0 |
| B | 10 | 16 | 135780 | 898.49 | 788 | 769 | 150.3 |
| B | 0 | 214 | 69578 | 457.92 | 788 | 769 | 150.3 |
| B | 11 | 51 | 53085 | 348.16 | 788 | 769 | 150.3 |
| C | 5 | 128 | 18458 | 99.97 | 768 | 773 | 176.9 |
| C | 8 | 128 | 14247 | 76.17 | 768 | 773 | 176.9 |
| C | 8 | 112 | 6618 | 33.04 | 768 | 773 | 176.9 |
| D | 1 | 52 | 556032 | 2836.48 | 754 | 734 | 195.8 |
| D | 13 | 105 | 188006 | 956.59 | 754 | 734 | 195.8 |
| D | 2 | 152 | 85740 | 434.21 | 754 | 734 | 195.8 |
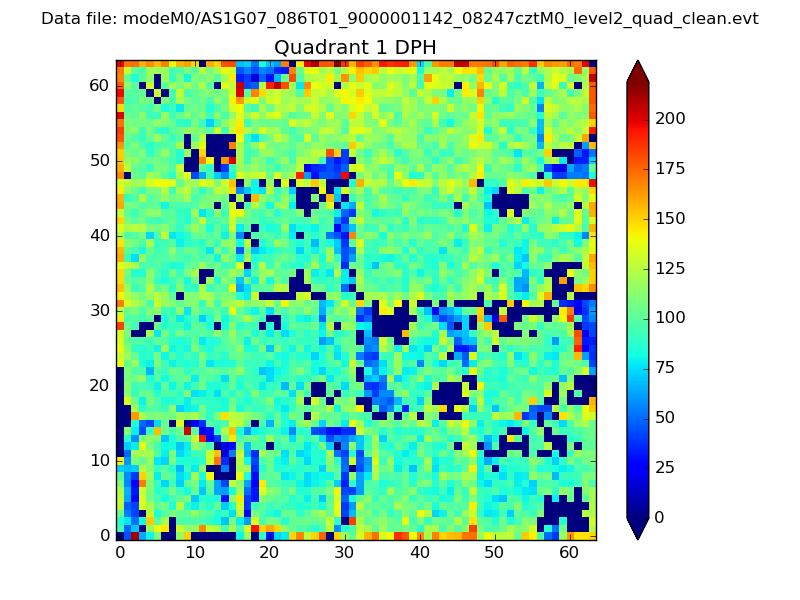
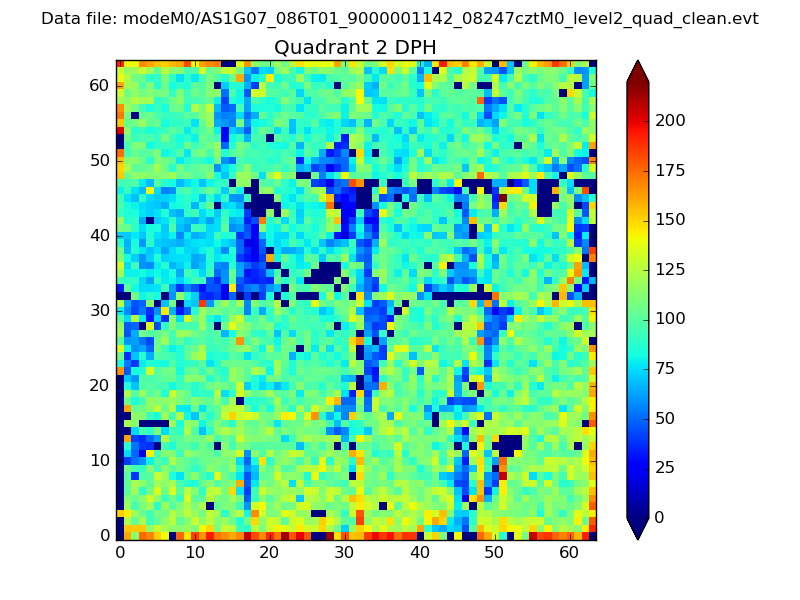
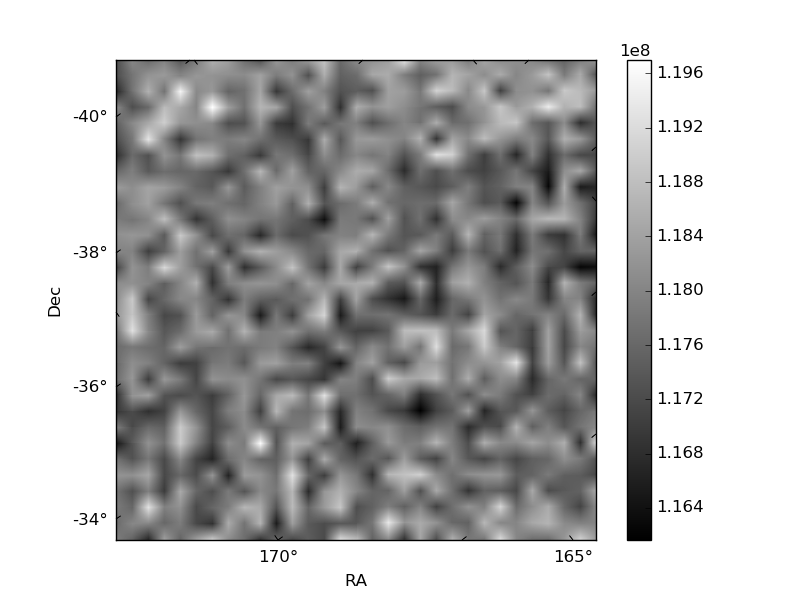
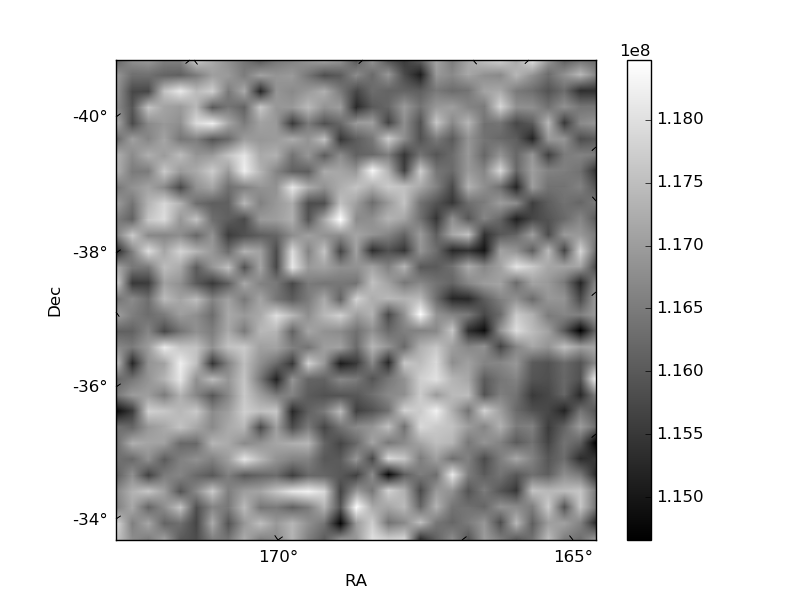
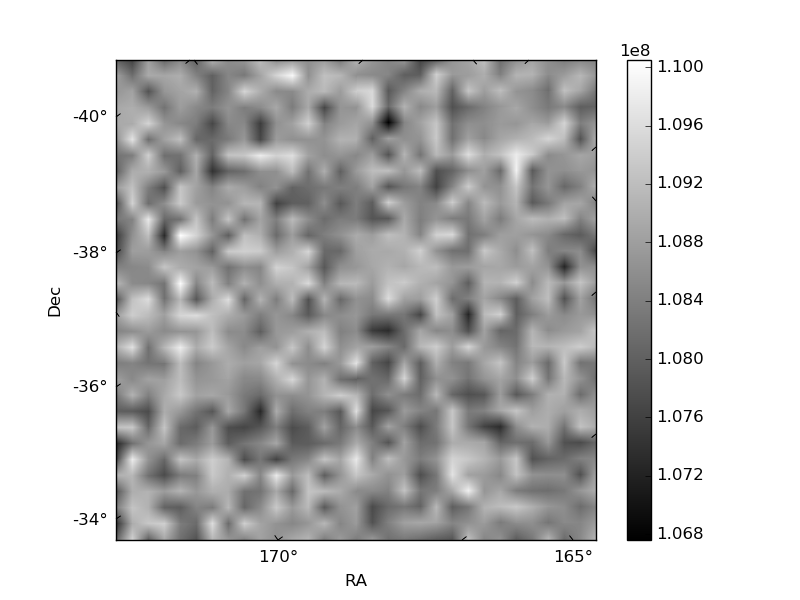
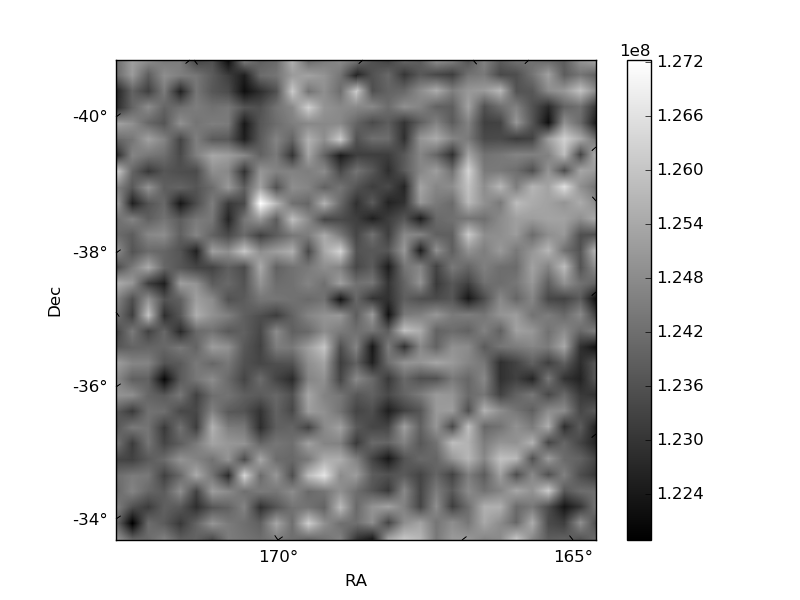
Histogram calculated using DETX and DETY for each event in the final _common_clean file
| Quadrant A | 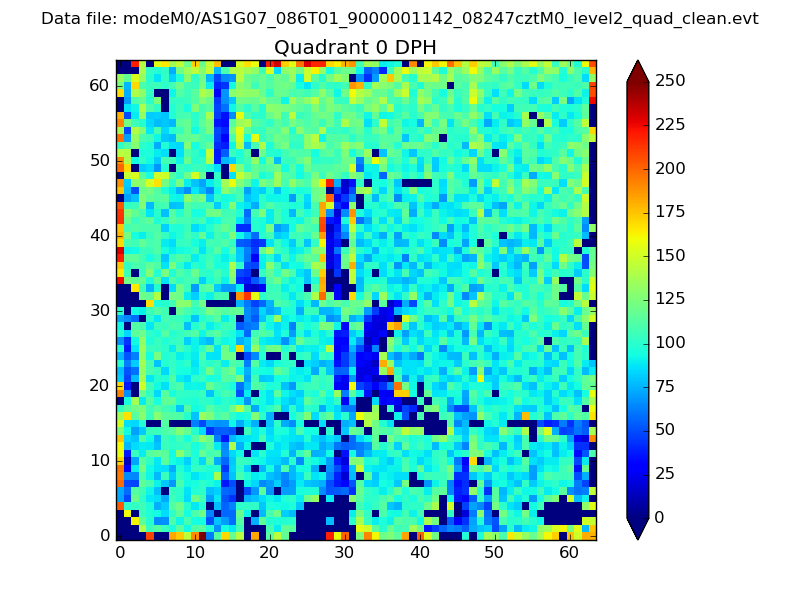 |
 |
Quadrant B |
|---|---|---|---|
| Quadrant D | 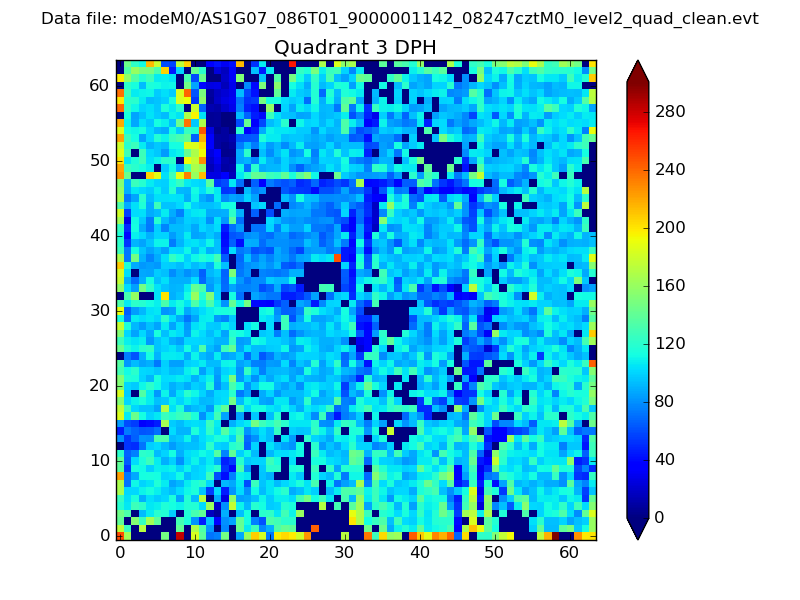 |
 |
Quadrant C |
| Plot type | Count rate plots | Images |
|---|---|---|
| Comparison with Poisson distribution Blue bars denote a histogram of data divided into 1 sec bins. Red curve is a Poisson curve with rate = median count rate of data. |
 |
 |
| Quadrant-wise count rates Data is divided into 100 sec bins |
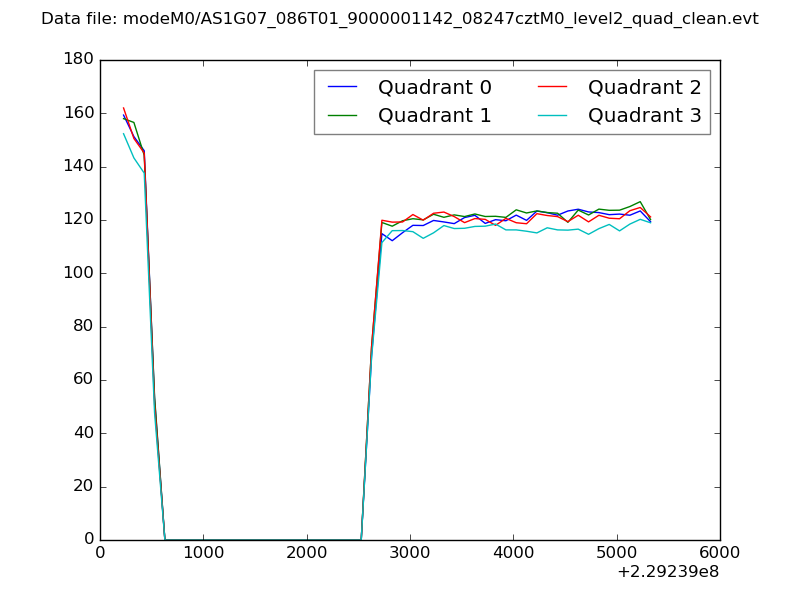 |
|
| Module-wise count rates for Quadrant A Data is divided into 100 sec bins |
 |
 |
| Module-wise count rates for Quadrant B Data is divided into 100 sec bins |
 |
 |
| Module-wise count rates for Quadrant C Data is divided into 100 sec bins |
 |
 |
| Module-wise count rates for Quadrant D Data is divided into 100 sec bins |
 |
 |
| Parameter | Plot |
|---|---|
| CZT HV Monitor |  |
| D_VDD |  |
| Temperature 1 | 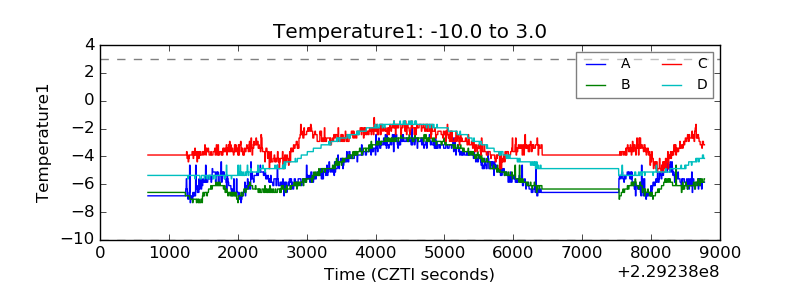 |
| Veto HV Monitor | 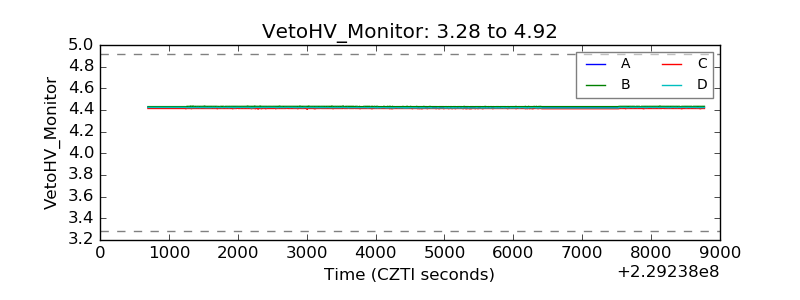 |
| Veto LLD |  |
| Alpha Counter | 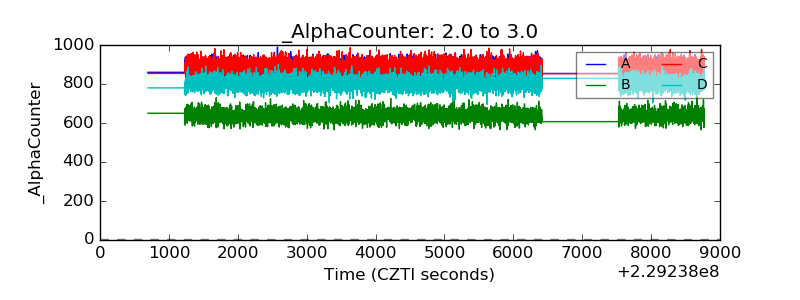 |
| _CPM_Rate | 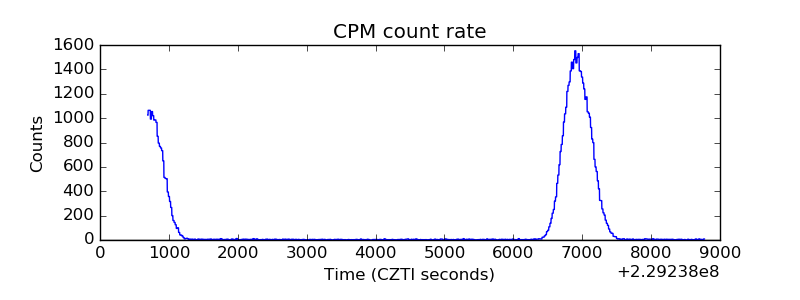 |
| CZT Counter | 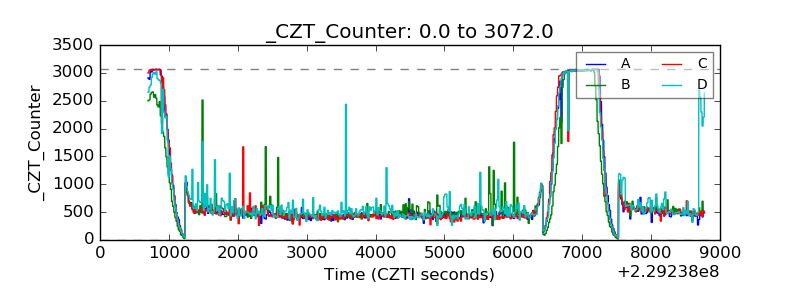 |
| +2.5 Volts monitor |  |
| +5 Volts monitor | 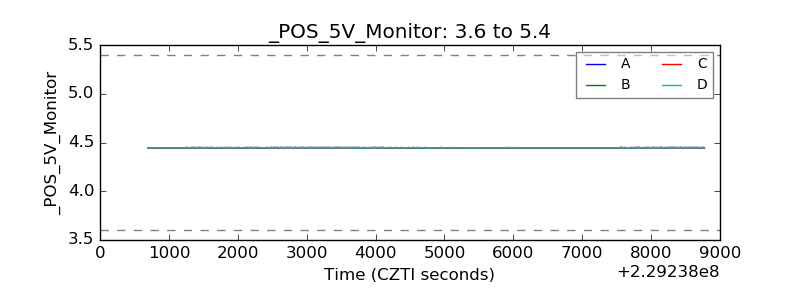 |
| _ROLL_ROT |  |
| _Roll_DEC | 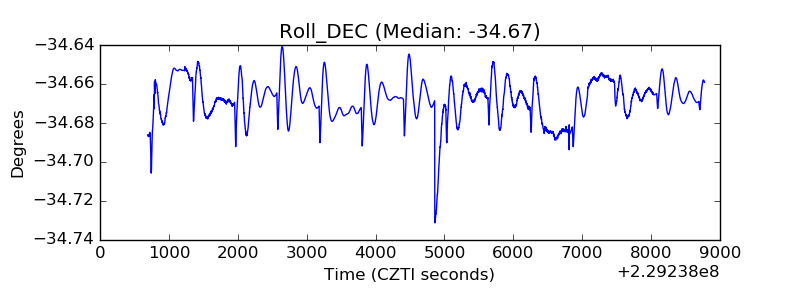 |
| _Roll_RA | 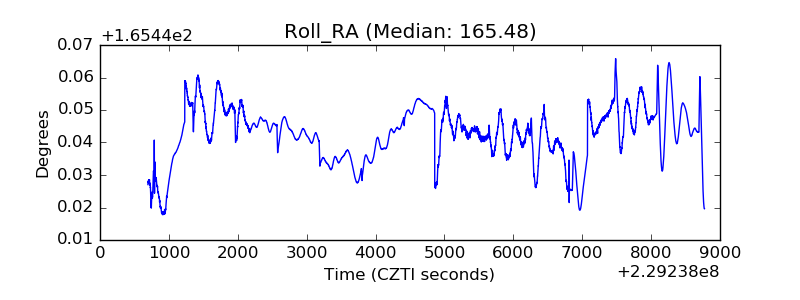 |
| Veto Counter |  |