| Param | Original file | Final file |
|---|---|---|
| Filename | modeM0/AS1G07_086T01_9000001142_08248cztM0_level2.evt | modeM0/AS1G07_086T01_9000001142_08248cztM0_level2_quad_clean.evt |
| Size (bytes) | 457,971,840 | 68,757,120 |
| Size | 436.8 MB | 65.6 MB |
| Events in quadrant A | 3,179,498 | 407,761 |
| Events in quadrant B | 3,396,180 | 414,739 |
| Events in quadrant C | 3,151,719 | 410,160 |
| Events in quadrant D | 3,700,856 | 396,036 |
| Mode M0 | |||
|---|---|---|---|
| Quadrant | BADHDUFLAG | Total packets | Discarded packets |
| A | 0 | 13602 | 5 |
| B | 0 | 14016 | 9 |
| C | 0 | 13677 | 10 |
| D | 0 | 15554 | 45 |
| Mode SS | |||
|---|---|---|---|
| Quadrant | BADHDUFLAG | Total packets | Discarded packets |
| A | 0 | 134 | 0 |
| B | 0 | 134 | 0 |
| C | 0 | 134 | 0 |
| D | 0 | 134 | 0 |
| Mode M9 | |||
|---|---|---|---|
| Quadrant | BADHDUFLAG | Total packets | Discarded packets |
| A | 0 | 23 | 0 |
| B | 0 | 23 | 0 |
| C | 0 | 23 | 0 |
| D | 0 | 23 | 0 |
| Quadrant | Total seconds | Saturated seconds | Saturation percentage |
|---|---|---|---|
| A | 6499 | 81 | 1.246346% |
| B | 6497 | 103 | 1.585347% |
| C | 6496 | 73 | 1.123768% |
| D | 6492 | 281 | 4.328404% |
Noise dominated data is calculated using 1-second bins in cleaned event files. If a bin has >2000 counts, and if more than 50% of those come from <1% of pixels, then it is considered to be noise-dominated and hence unusable.
| Quadrant | # 1 sec bins | Bins with >0 counts | Bins with >2000 counts | High rate bins dominated by noise | Noise dominated (total time) | Noise dominated (detector-on time) | Marked lightcurve |
|---|---|---|---|---|---|---|---|
| A | 8820 | 6502 | 0 | 0 | 0.00% | 0.00% | 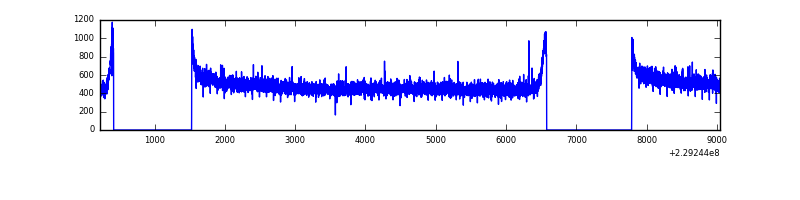 |
| B | 8820 | 6502 | 5 | 5 | 0.06% | 0.08% | 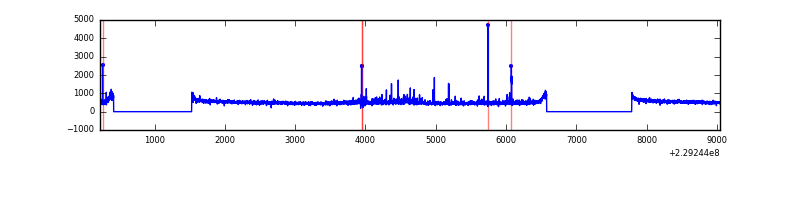 |
| C | 8820 | 6501 | 0 | 0 | 0.00% | 0.00% | 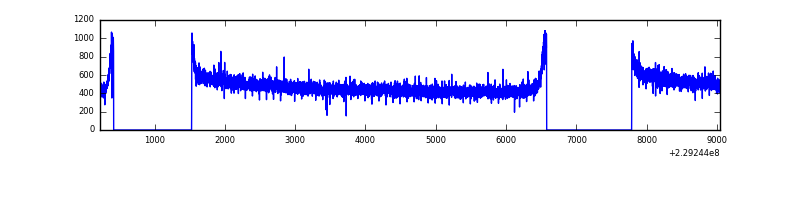 |
| D | 8820 | 6499 | 195 | 195 | 2.21% | 3.00% | 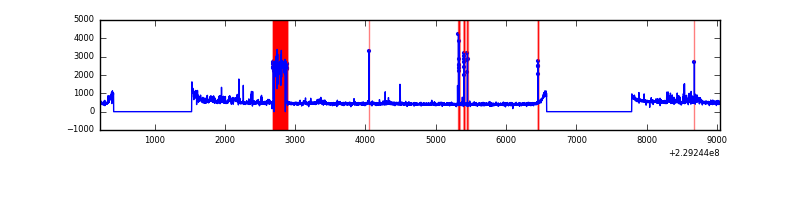 |
Top three noisy pixels from each quadrant. If the there are fewer than three noisy pixels in the level2.evt file, extra rows are filled as -1
| Pixel properties | Quadrant properties | ||||||
|---|---|---|---|---|---|---|---|
| Quadrant | DetID | PixID | Counts | Sigma | Mean | Median | Sigma |
| A | 8 | 15 | 13950 | 79.82 | 821 | 802 | 164.7 |
| A | 0 | 226 | 7710 | 41.94 | 821 | 802 | 164.7 |
| A | 12 | 194 | 7464 | 40.45 | 821 | 802 | 164.7 |
| B | 11 | 51 | 74104 | 469.52 | 830 | 811 | 156.1 |
| B | 0 | 214 | 71357 | 451.92 | 830 | 811 | 156.1 |
| B | 10 | 16 | 29234 | 182.08 | 830 | 811 | 156.1 |
| C | 13 | 61 | 6141 | 28.68 | 807 | 812 | 185.8 |
| C | 3 | 202 | 2101 | 6.94 | 807 | 812 | 185.8 |
| C | 5 | 128 | 1901 | 5.86 | 807 | 812 | 185.8 |
| D | 13 | 105 | 420219 | 2003.12 | 788 | 768 | 209.4 |
| D | 1 | 52 | 175913 | 836.42 | 788 | 768 | 209.4 |
| D | 2 | 152 | 95412 | 451.98 | 788 | 768 | 209.4 |
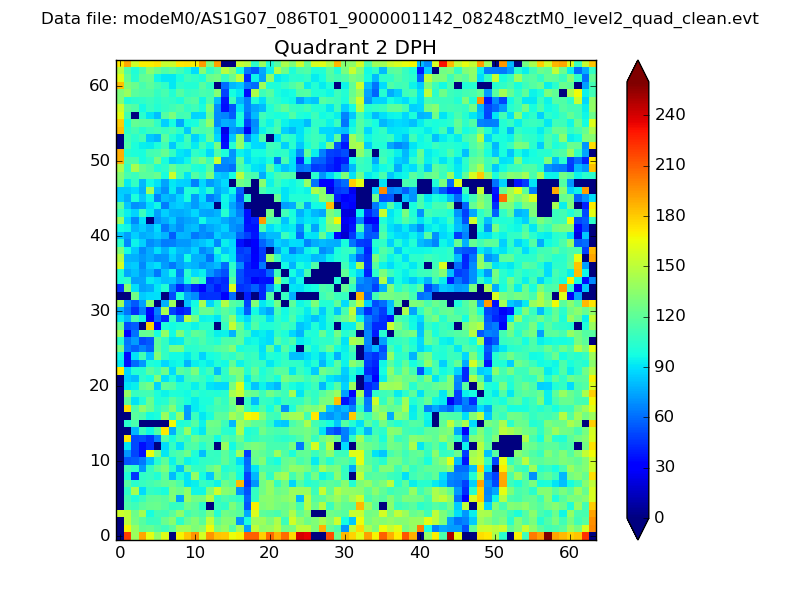
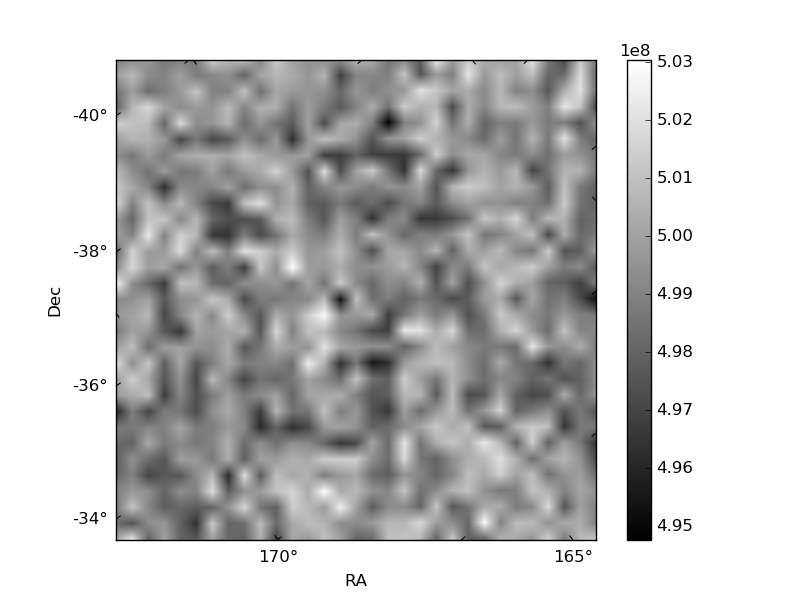
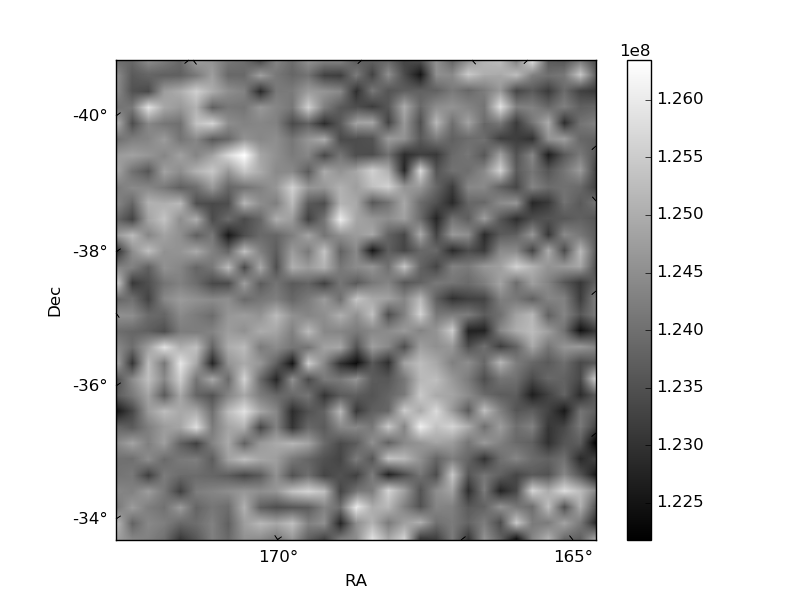
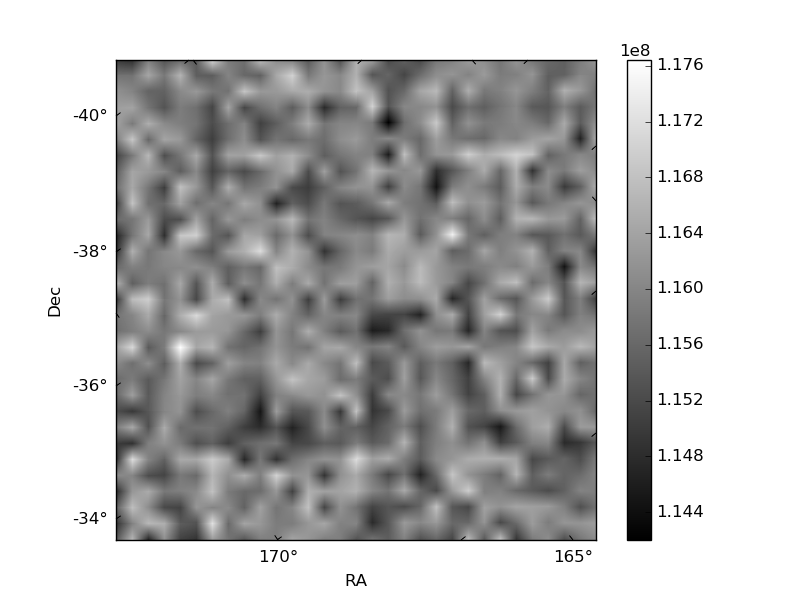
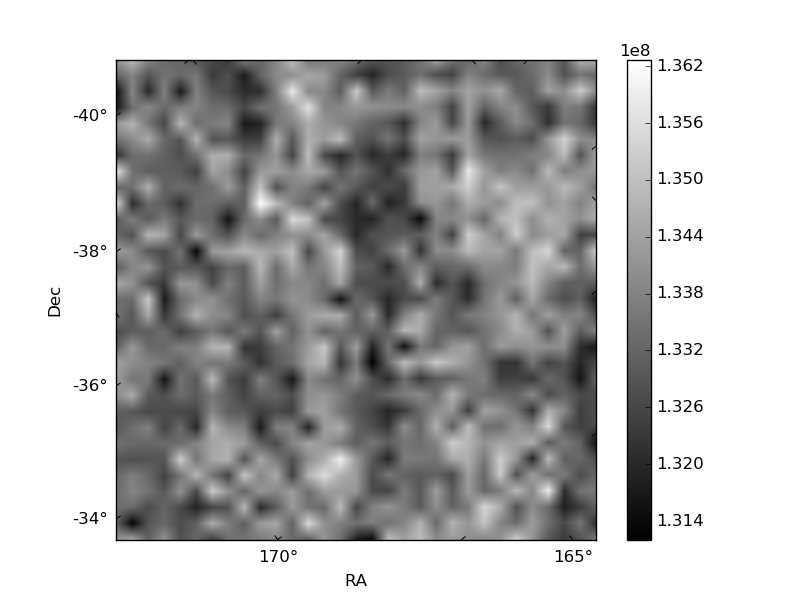
Histogram calculated using DETX and DETY for each event in the final _common_clean file
| Quadrant A | 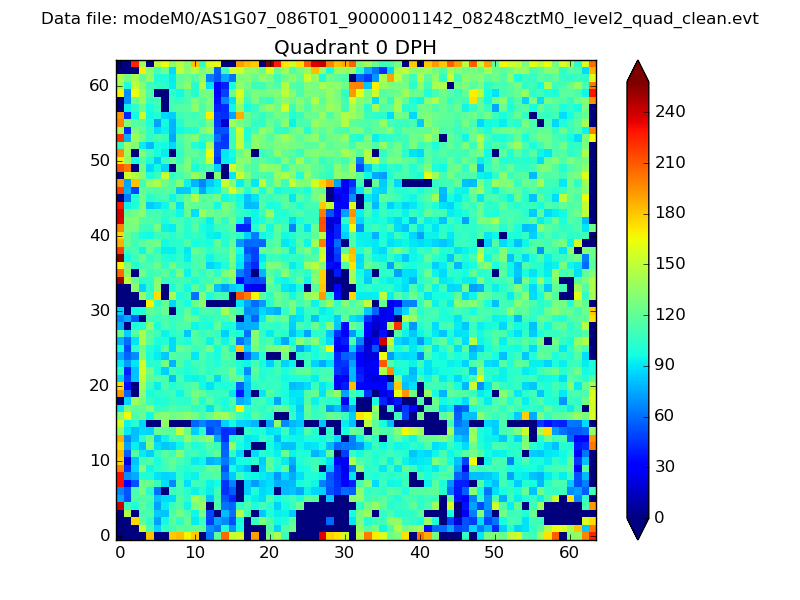 |
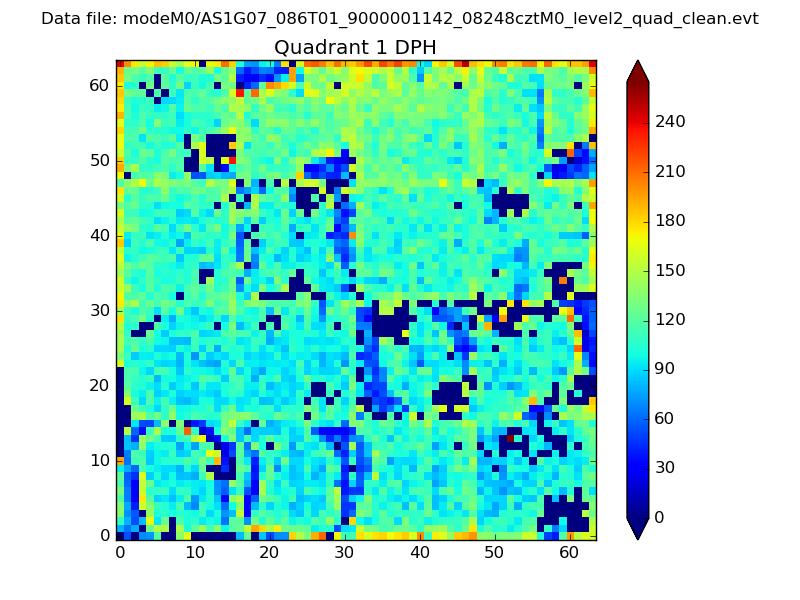 |
Quadrant B |
|---|---|---|---|
| Quadrant D | 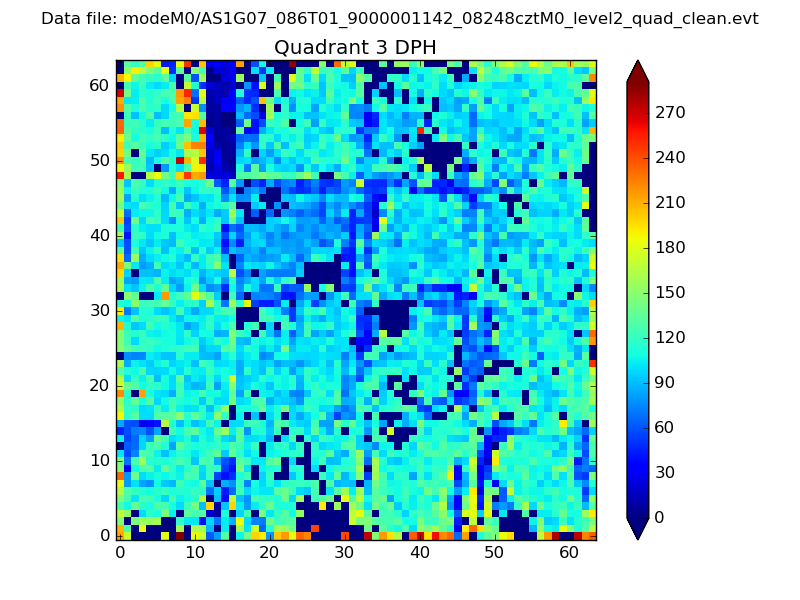 |
 |
Quadrant C |
| Plot type | Count rate plots | Images |
|---|---|---|
| Comparison with Poisson distribution Blue bars denote a histogram of data divided into 1 sec bins. Red curve is a Poisson curve with rate = median count rate of data. |
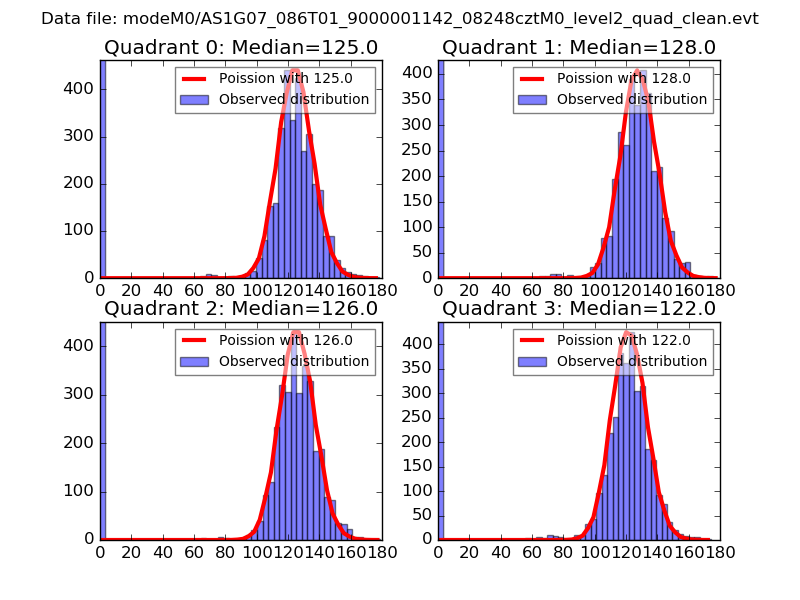 |
 |
| Quadrant-wise count rates Data is divided into 100 sec bins |
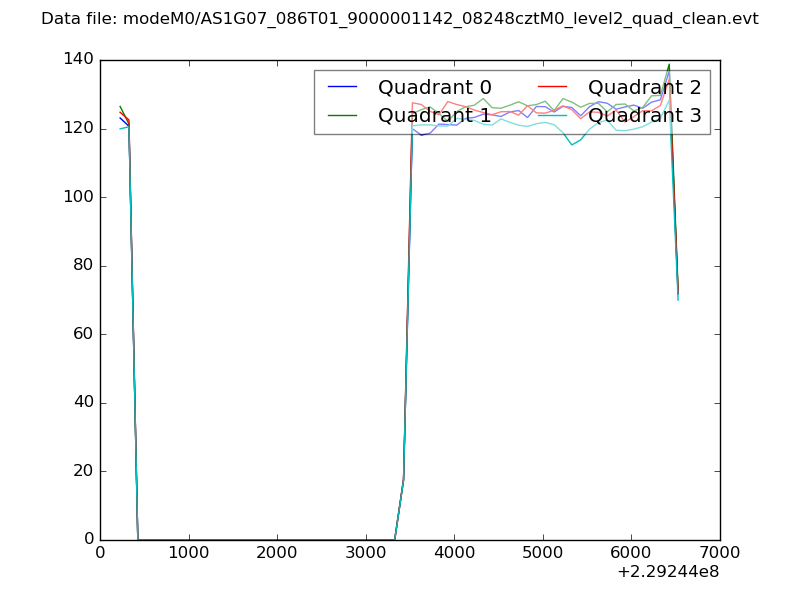 |
|
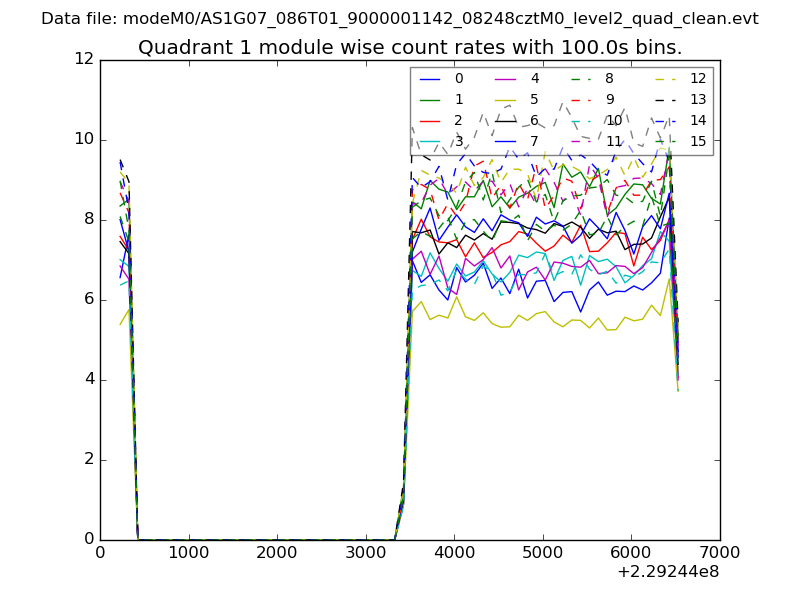
| Module-wise count rates for Quadrant A Data is divided into 100 sec bins |
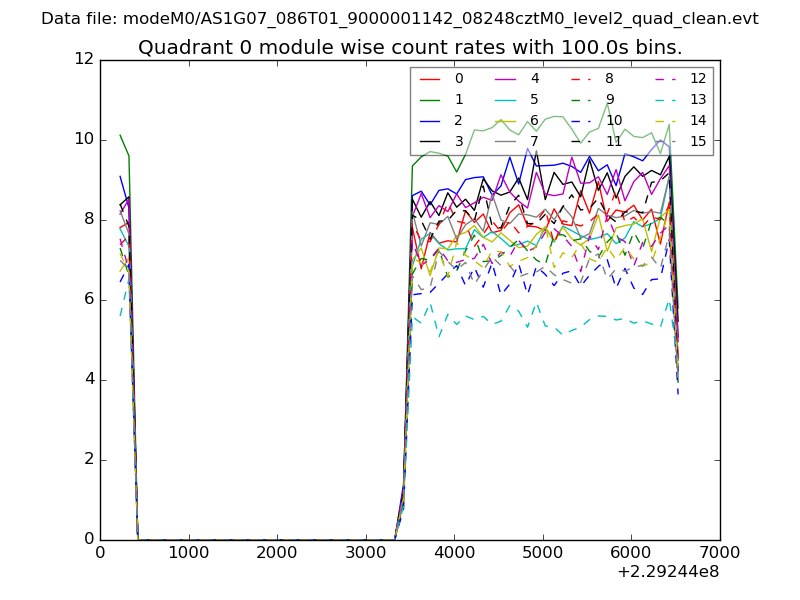 |
 |
| Module-wise count rates for Quadrant B Data is divided into 100 sec bins |
 |
 |
| Module-wise count rates for Quadrant C Data is divided into 100 sec bins |
 |
 |
| Module-wise count rates for Quadrant D Data is divided into 100 sec bins |
 |
 |
| Parameter | Plot |
|---|---|
| CZT HV Monitor | 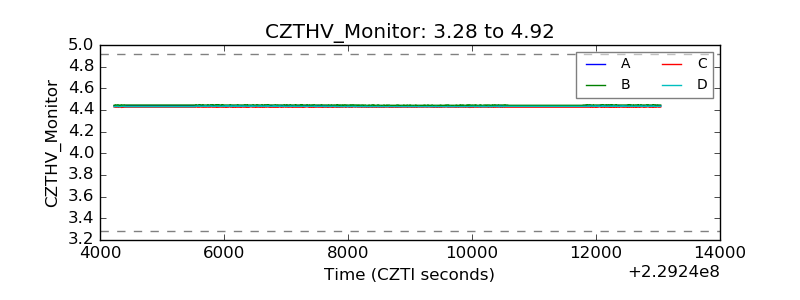 |
| D_VDD | 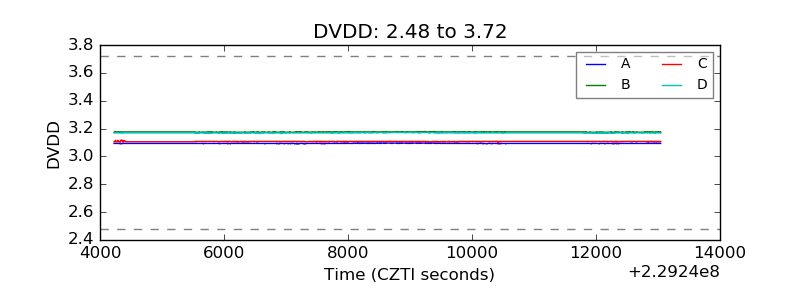 |
| Temperature 1 | 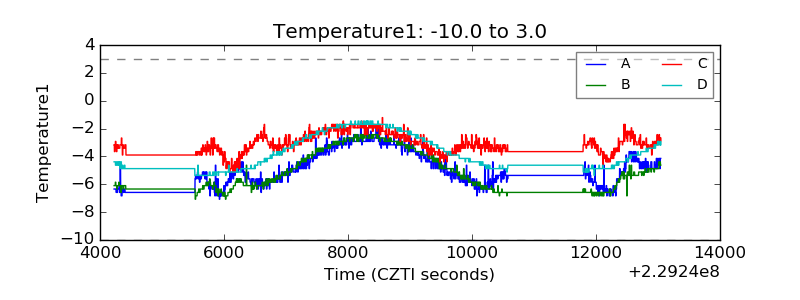 |
| Veto HV Monitor | 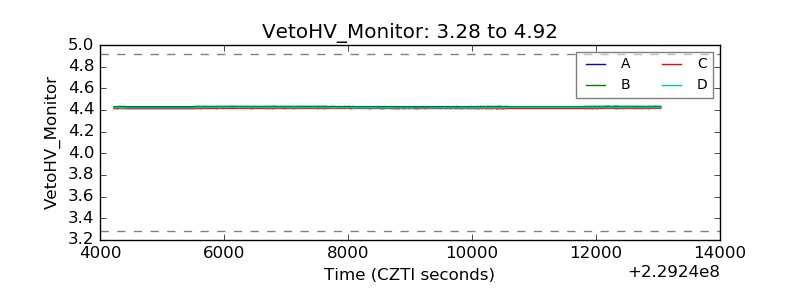 |
| Veto LLD | 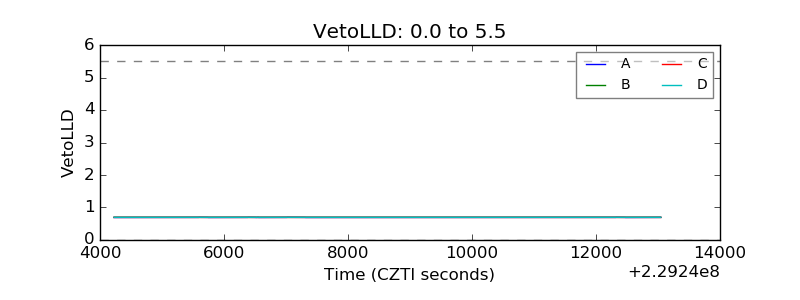 |
| Alpha Counter | 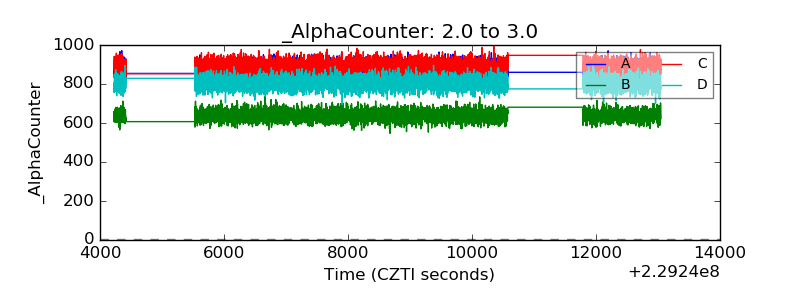 |
| _CPM_Rate | 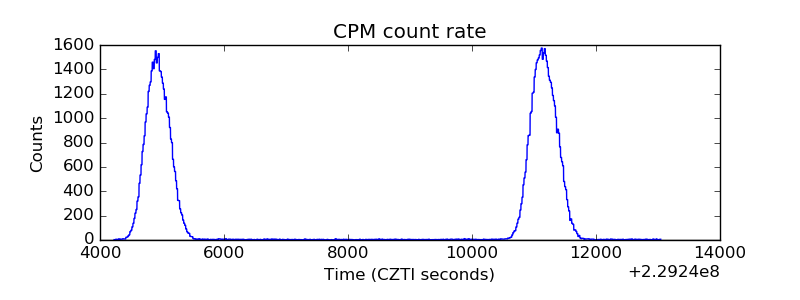 |
| CZT Counter | 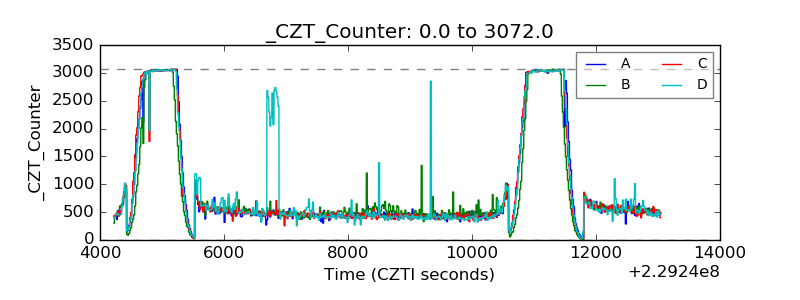 |
| +2.5 Volts monitor |  |
| +5 Volts monitor |  |
| _ROLL_ROT | 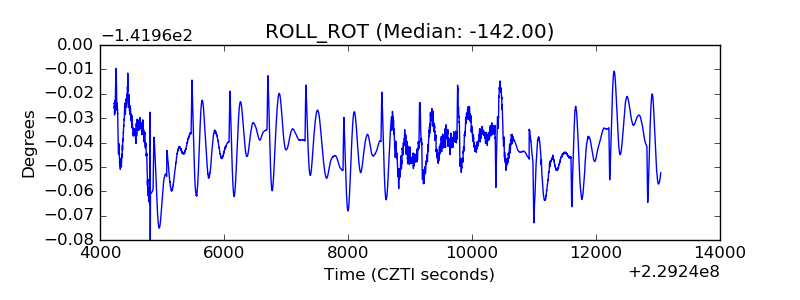 |
| _Roll_DEC | 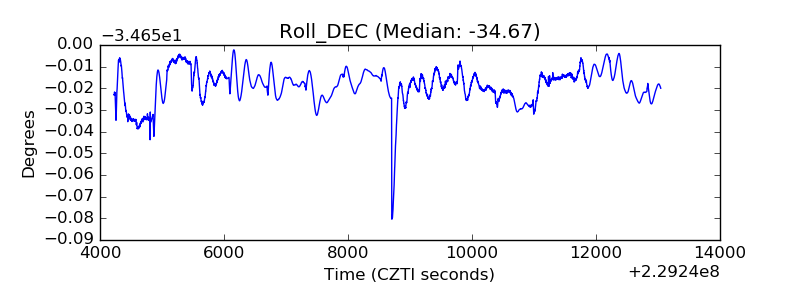 |
| _Roll_RA | 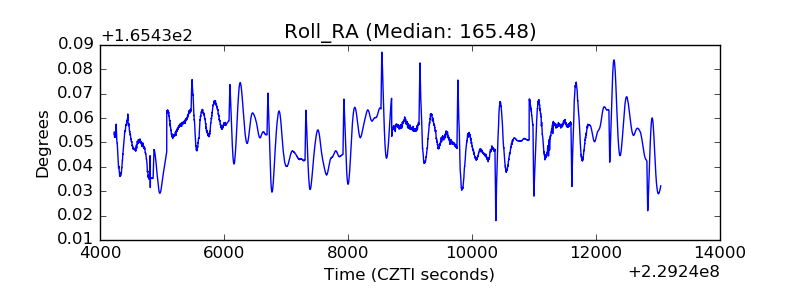 |
| Veto Counter | 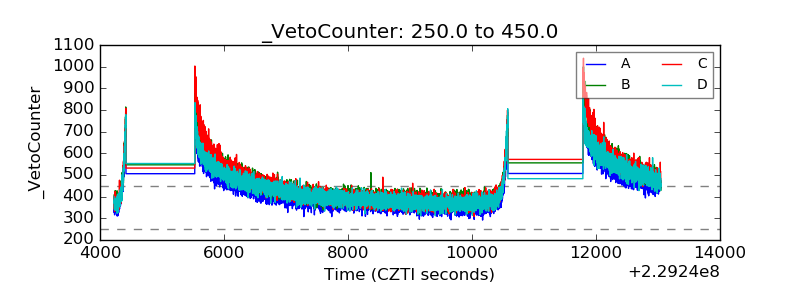 |