| Param | Original file | Final file |
|---|---|---|
| Filename | modeM0/AS1G07_086T01_9000001142_08249cztM0_level2.evt | modeM0/AS1G07_086T01_9000001142_08249cztM0_level2_quad_clean.evt |
| Size (bytes) | 447,024,960 | 77,158,080 |
| Size | 426.3 MB | 73.6 MB |
| Events in quadrant A | 3,209,002 | 476,429 |
| Events in quadrant B | 3,480,638 | 480,244 |
| Events in quadrant C | 3,145,776 | 474,077 |
| Events in quadrant D | 3,270,080 | 461,273 |
| Mode M0 | |||
|---|---|---|---|
| Quadrant | BADHDUFLAG | Total packets | Discarded packets |
| A | 0 | 13463 | 3 |
| B | 0 | 14110 | 2 |
| C | 0 | 13488 | 2 |
| D | 0 | 14050 | 4 |
| Mode SS | |||
|---|---|---|---|
| Quadrant | BADHDUFLAG | Total packets | Discarded packets |
| A | 0 | 130 | 0 |
| B | 0 | 130 | 0 |
| C | 0 | 130 | 0 |
| D | 0 | 130 | 0 |
| Mode M9 | |||
|---|---|---|---|
| Quadrant | BADHDUFLAG | Total packets | Discarded packets |
| A | 0 | 18 | 0 |
| B | 0 | 18 | 0 |
| C | 0 | 18 | 0 |
| D | 0 | 19 | 0 |
| Quadrant | Total seconds | Saturated seconds | Saturation percentage |
|---|---|---|---|
| A | 6365 | 87 | 1.366850% |
| B | 6365 | 101 | 1.586803% |
| C | 6365 | 72 | 1.131186% |
| D | 6364 | 87 | 1.367065% |
Noise dominated data is calculated using 1-second bins in cleaned event files. If a bin has >2000 counts, and if more than 50% of those come from <1% of pixels, then it is considered to be noise-dominated and hence unusable.
| Quadrant | # 1 sec bins | Bins with >0 counts | Bins with >2000 counts | High rate bins dominated by noise | Noise dominated (total time) | Noise dominated (detector-on time) | Marked lightcurve |
|---|---|---|---|---|---|---|---|
| A | 7625 | 6365 | 0 | 0 | 0.00% | 0.00% | 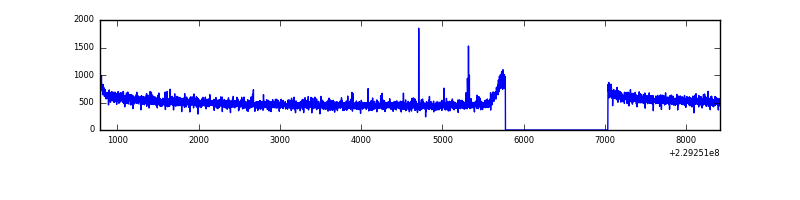 |
| B | 7625 | 6365 | 12 | 12 | 0.16% | 0.19% |  |
| C | 7625 | 6365 | 2 | 2 | 0.03% | 0.03% | 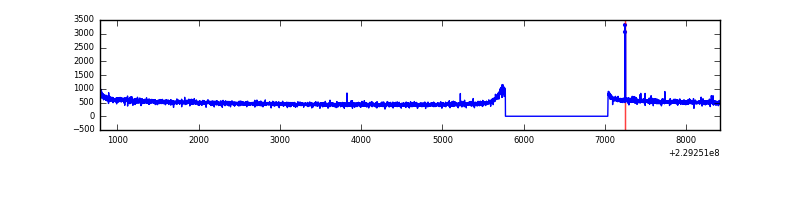 |
| D | 7625 | 6365 | 14 | 14 | 0.18% | 0.22% | 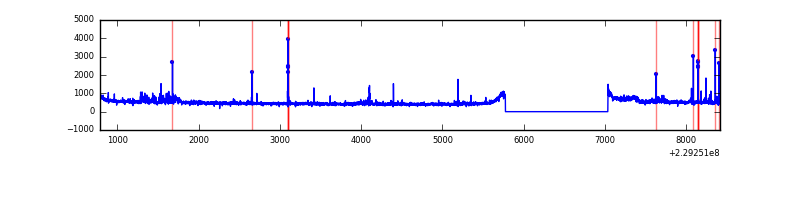 |
Top three noisy pixels from each quadrant. If the there are fewer than three noisy pixels in the level2.evt file, extra rows are filled as -1
| Pixel properties | Quadrant properties | ||||||
|---|---|---|---|---|---|---|---|
| Quadrant | DetID | PixID | Counts | Sigma | Mean | Median | Sigma |
| A | 8 | 15 | 13093 | 73.76 | 828 | 812 | 166.5 |
| A | 13 | 248 | 7819 | 42.08 | 828 | 812 | 166.5 |
| A | 0 | 226 | 7792 | 41.92 | 828 | 812 | 166.5 |
| B | 0 | 214 | 107296 | 690.23 | 831 | 813 | 154.3 |
| B | 11 | 51 | 81583 | 523.56 | 831 | 813 | 154.3 |
| B | 10 | 16 | 58659 | 374.96 | 831 | 813 | 154.3 |
| C | 5 | 128 | 9447 | 46.68 | 804 | 808 | 185.1 |
| C | 13 | 61 | 6302 | 29.69 | 804 | 808 | 185.1 |
| C | 3 | 202 | 2147 | 7.24 | 804 | 808 | 185.1 |
| D | 2 | 152 | 75393 | 356.49 | 799 | 779 | 209.3 |
| D | 8 | 230 | 57787 | 272.37 | 799 | 779 | 209.3 |
| D | 1 | 52 | 46757 | 219.67 | 799 | 779 | 209.3 |
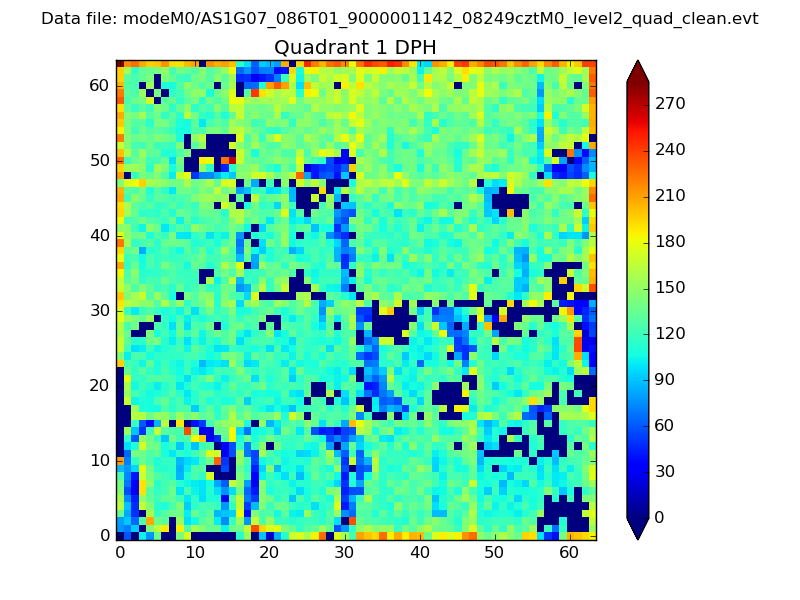
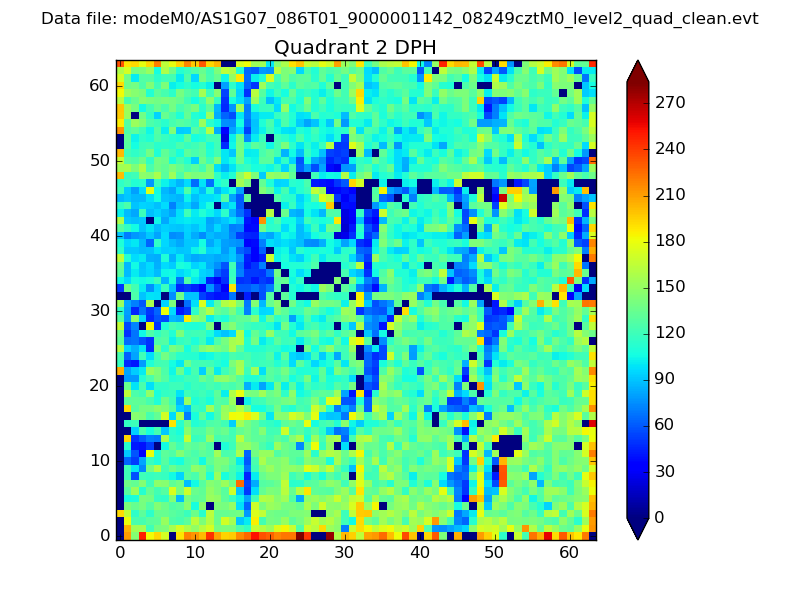
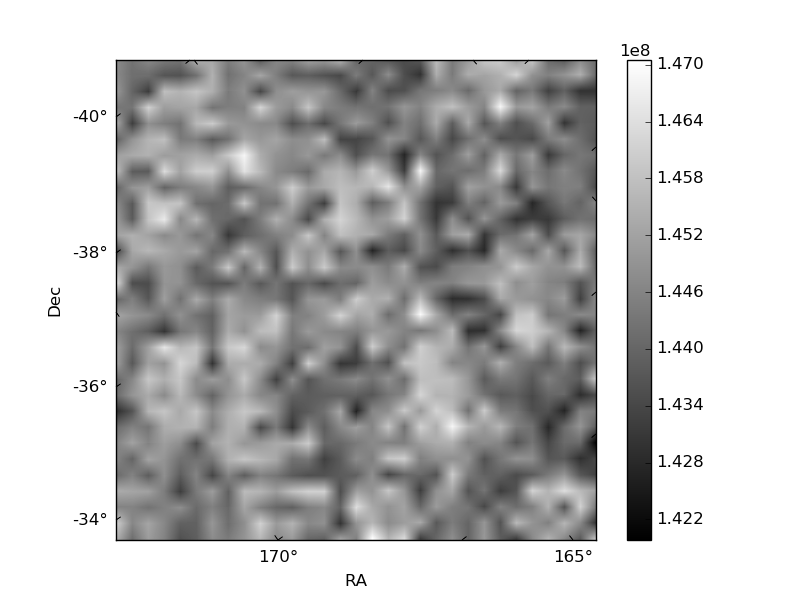
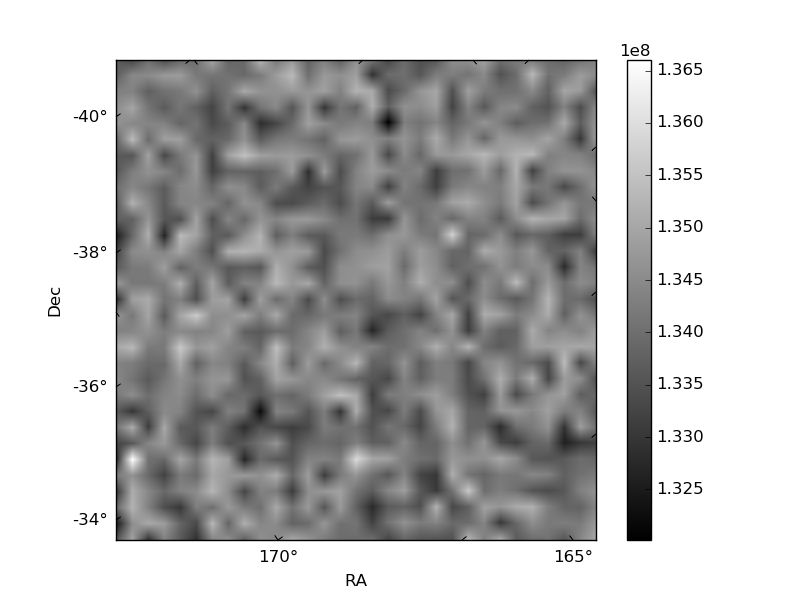
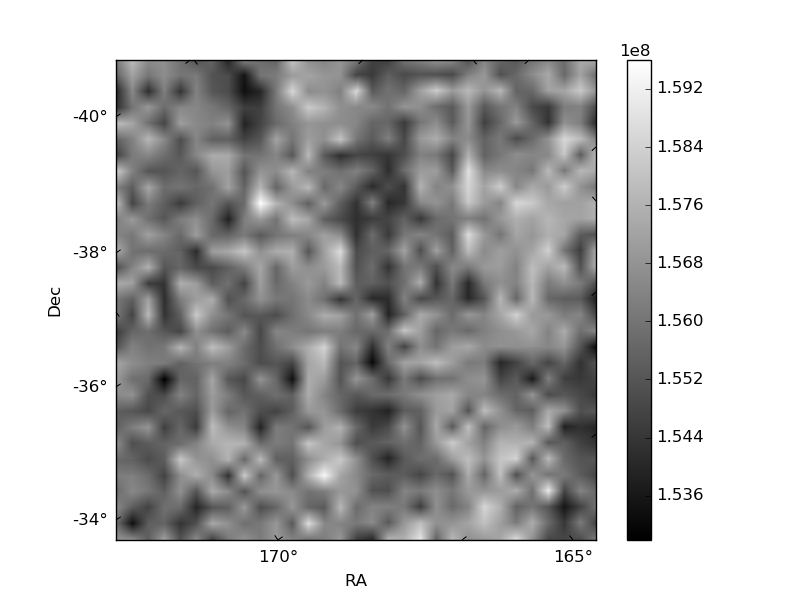
Histogram calculated using DETX and DETY for each event in the final _common_clean file
| Quadrant A | 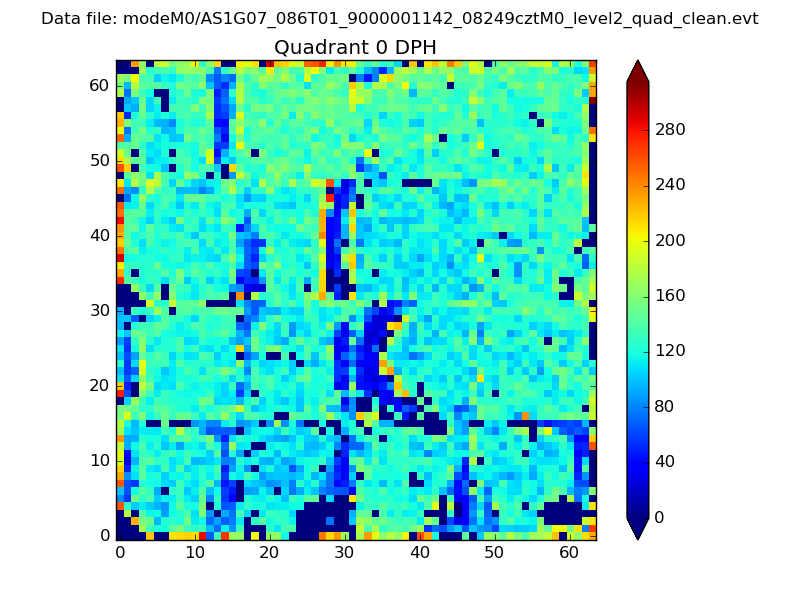 |
 |
Quadrant B |
|---|---|---|---|
| Quadrant D |  |
 |
Quadrant C |
| Plot type | Count rate plots | Images |
|---|---|---|
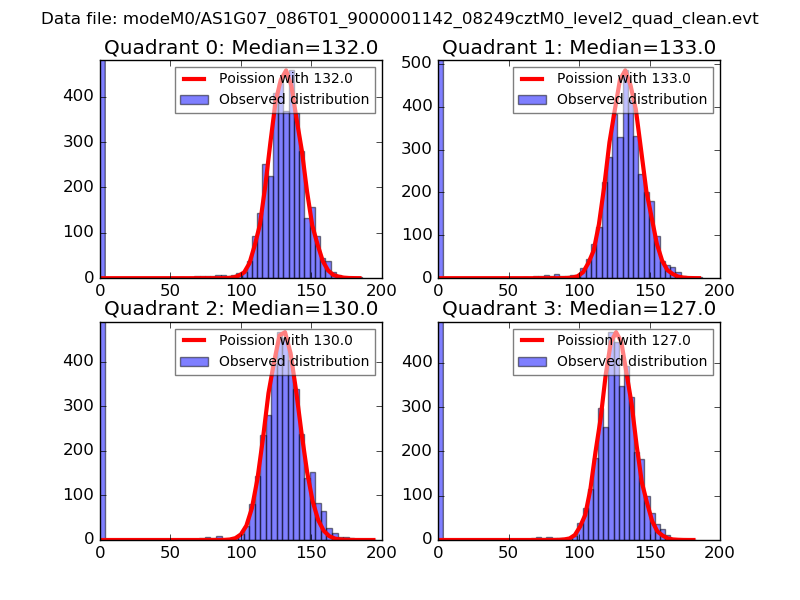
| Comparison with Poisson distribution Blue bars denote a histogram of data divided into 1 sec bins. Red curve is a Poisson curve with rate = median count rate of data. |
 |
 |
| Quadrant-wise count rates Data is divided into 100 sec bins |
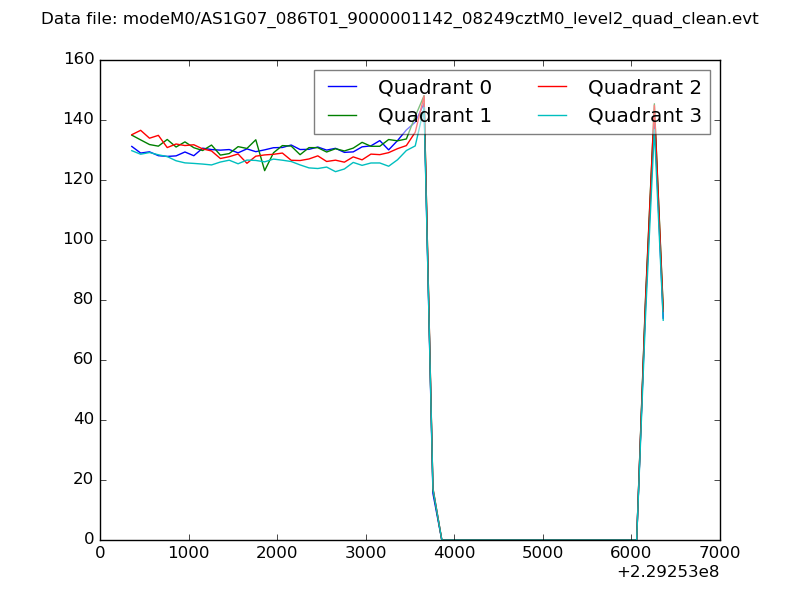 |
|
| Module-wise count rates for Quadrant A Data is divided into 100 sec bins |
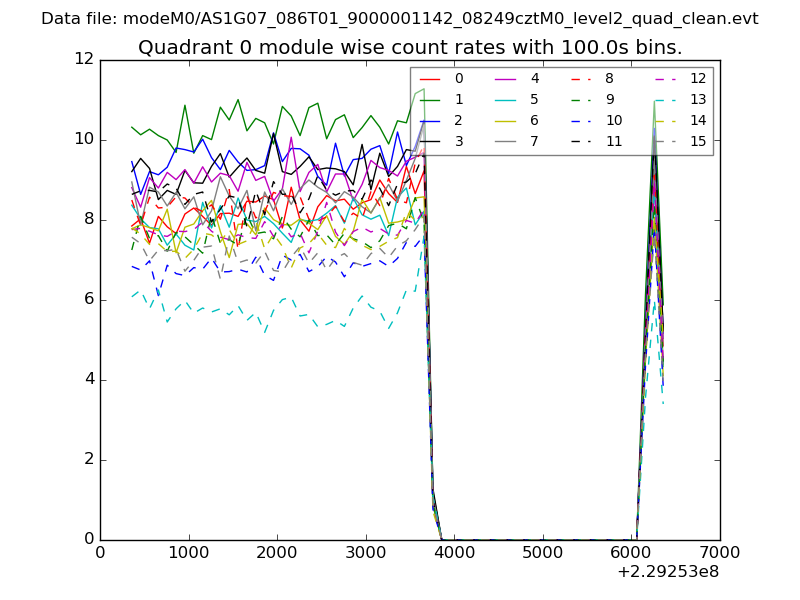 |
 |
| Module-wise count rates for Quadrant B Data is divided into 100 sec bins |
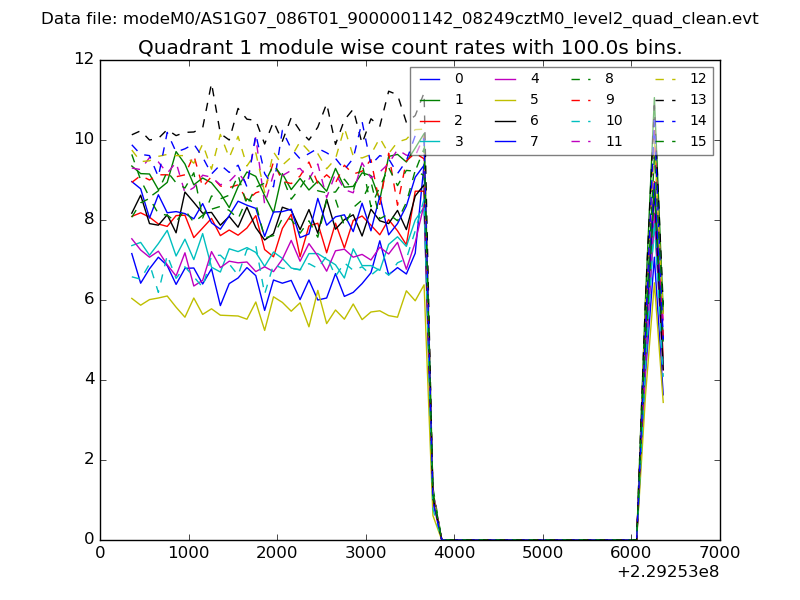 |
 |
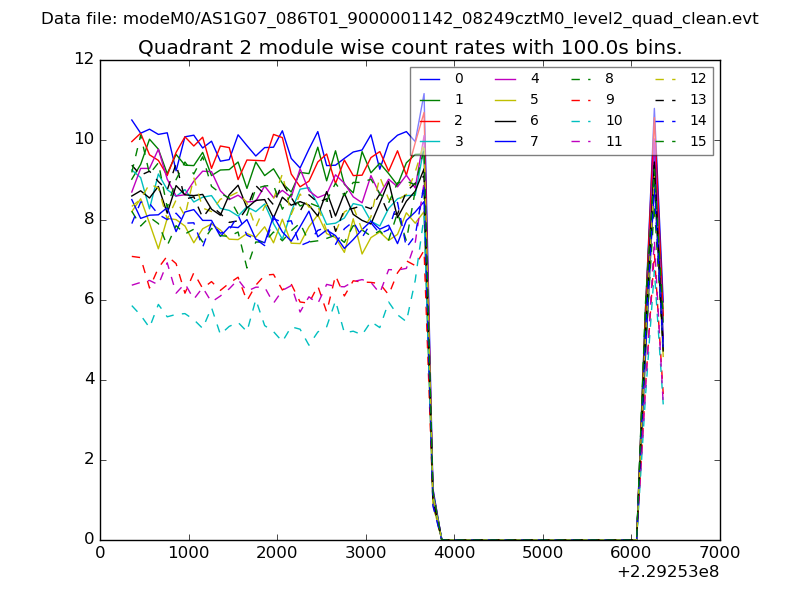
| Module-wise count rates for Quadrant C Data is divided into 100 sec bins |
 |
 |
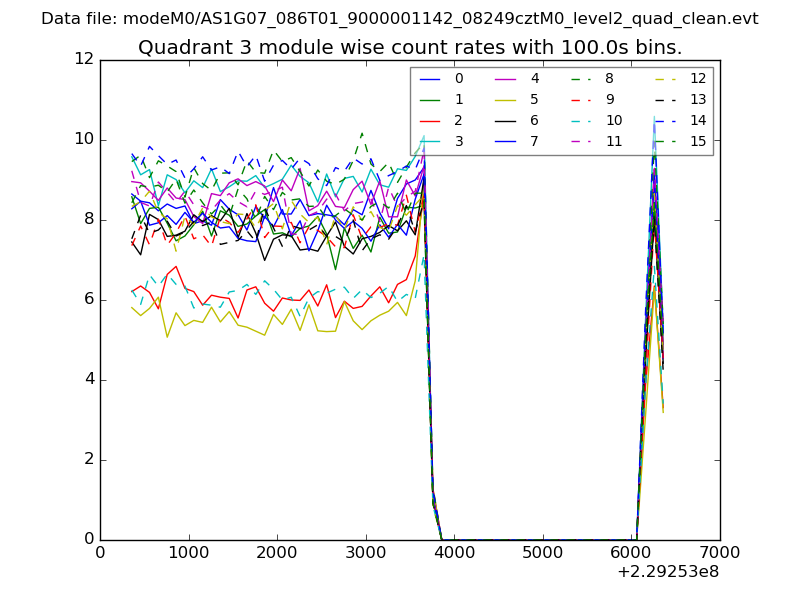
| Module-wise count rates for Quadrant D Data is divided into 100 sec bins |
 |
 |
| Parameter | Plot |
|---|---|
| CZT HV Monitor | 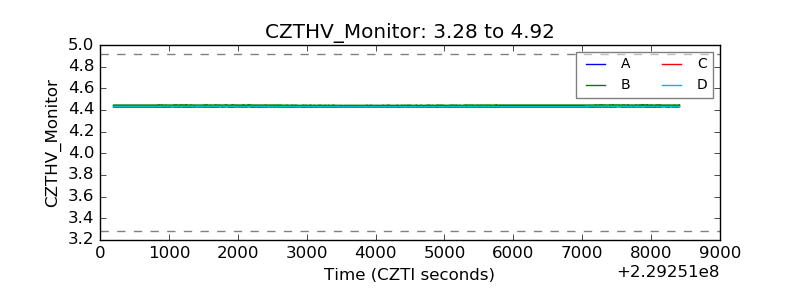 |
| D_VDD | 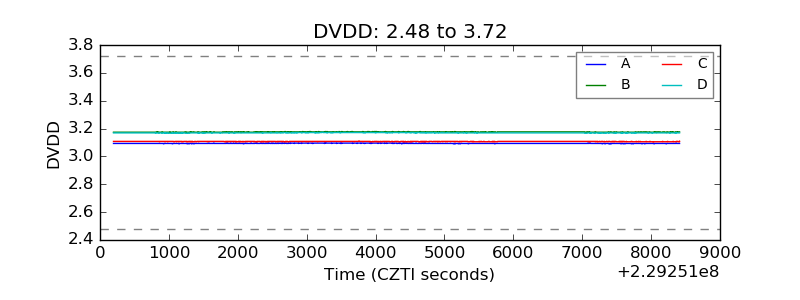 |
| Temperature 1 | 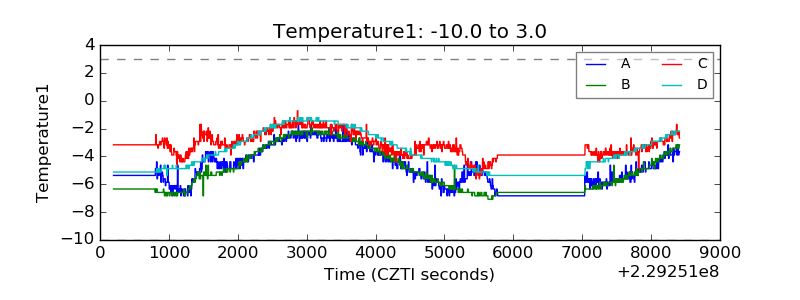 |
| Veto HV Monitor | 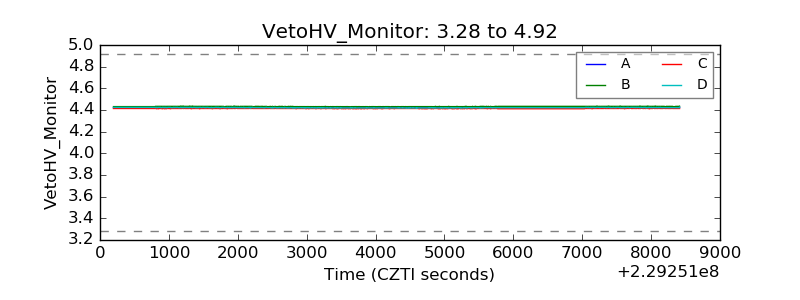 |
| Veto LLD | 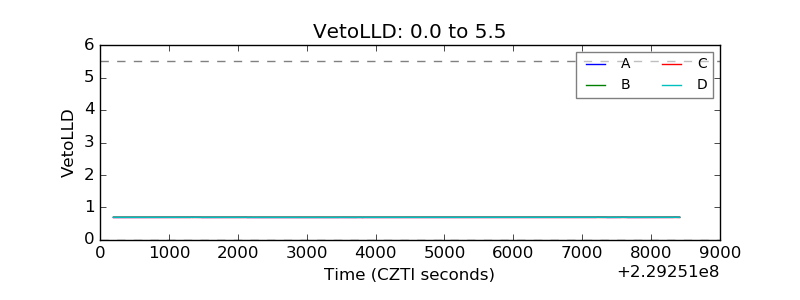 |
| Alpha Counter | 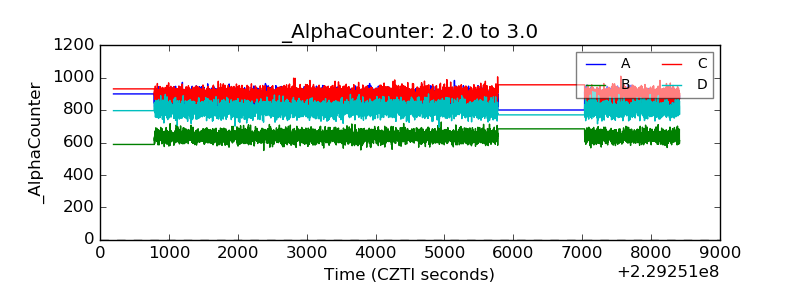 |
| _CPM_Rate | 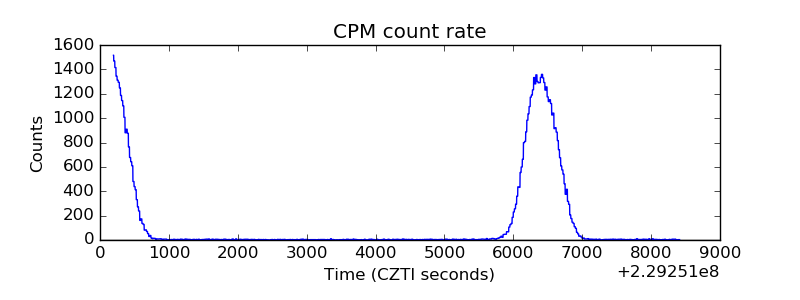 |
| CZT Counter | 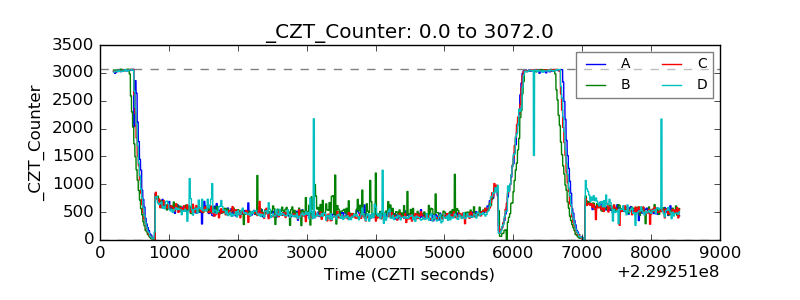 |
| +2.5 Volts monitor |  |
| +5 Volts monitor | 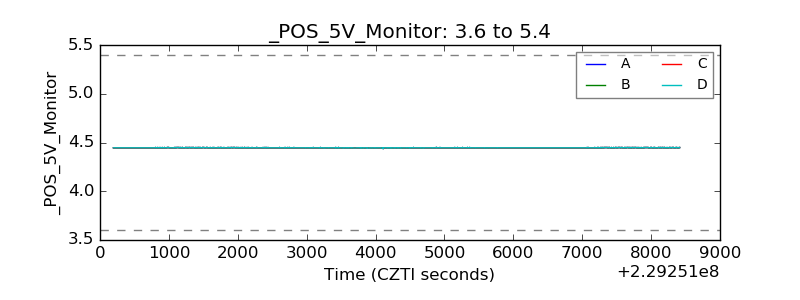 |
| _ROLL_ROT | 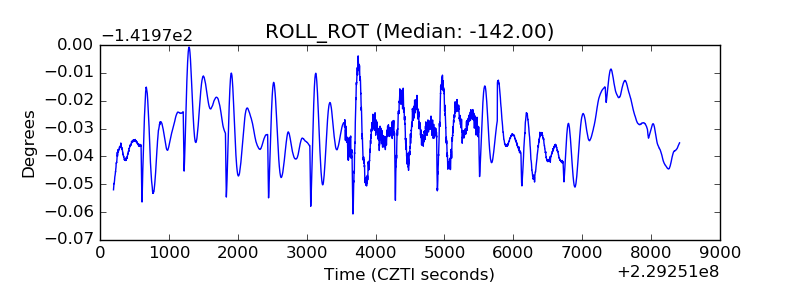 |
| _Roll_DEC | 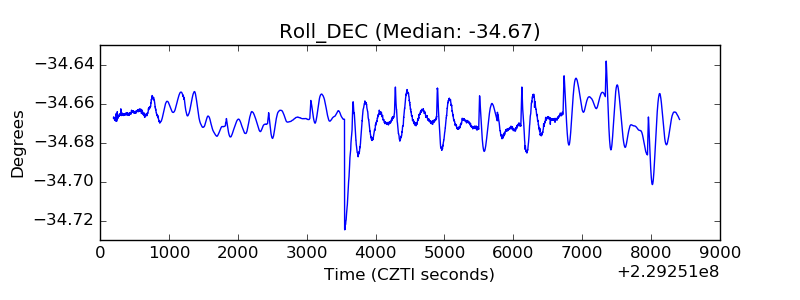 |
| _Roll_RA | 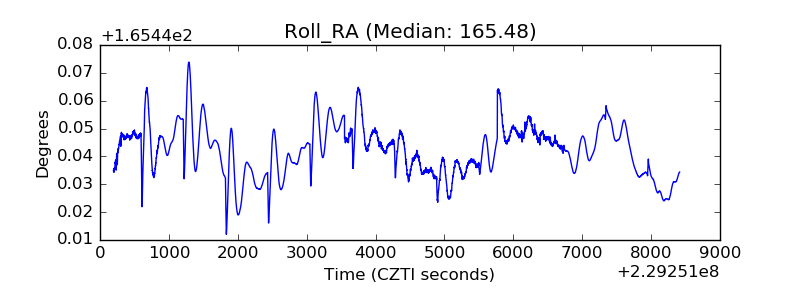 |
| Veto Counter | 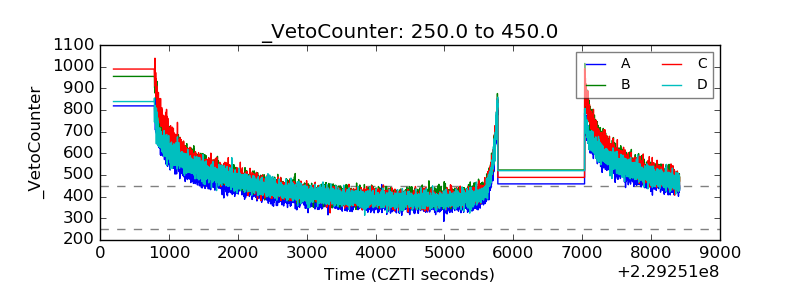 |