| Param | Original file | Final file |
|---|---|---|
| Filename | modeM0/AS1G07_086T01_9000001142_08250cztM0_level2.evt | modeM0/AS1G07_086T01_9000001142_08250cztM0_level2_quad_clean.evt |
| Size (bytes) | 446,849,280 | 90,417,600 |
| Size | 426.1 MB | 86.2 MB |
| Events in quadrant A | 3,214,102 | 578,666 |
| Events in quadrant B | 3,399,940 | 587,634 |
| Events in quadrant C | 3,134,760 | 574,002 |
| Events in quadrant D | 3,351,131 | 553,711 |
| Mode M0 | |||
|---|---|---|---|
| Quadrant | BADHDUFLAG | Total packets | Discarded packets |
| A | 0 | 13463 | 3 |
| B | 0 | 13880 | 2 |
| C | 0 | 13434 | 4 |
| D | 0 | 14184 | 2 |
| Mode SS | |||
|---|---|---|---|
| Quadrant | BADHDUFLAG | Total packets | Discarded packets |
| A | 0 | 130 | 0 |
| B | 0 | 130 | 0 |
| C | 0 | 130 | 0 |
| D | 0 | 130 | 0 |
| Mode M9 | |||
|---|---|---|---|
| Quadrant | BADHDUFLAG | Total packets | Discarded packets |
| A | 0 | 23 | 0 |
| B | 0 | 23 | 0 |
| C | 0 | 23 | 0 |
| D | 0 | 24 | 0 |
| Quadrant | Total seconds | Saturated seconds | Saturation percentage |
|---|---|---|---|
| A | 6362 | 151 | 2.373467% |
| B | 6362 | 146 | 2.294876% |
| C | 6361 | 134 | 2.106587% |
| D | 6362 | 166 | 2.609242% |
Noise dominated data is calculated using 1-second bins in cleaned event files. If a bin has >2000 counts, and if more than 50% of those come from <1% of pixels, then it is considered to be noise-dominated and hence unusable.
| Quadrant | # 1 sec bins | Bins with >0 counts | Bins with >2000 counts | High rate bins dominated by noise | Noise dominated (total time) | Noise dominated (detector-on time) | Marked lightcurve |
|---|---|---|---|---|---|---|---|
| A | 7577 | 6362 | 0 | 0 | 0.00% | 0.00% | 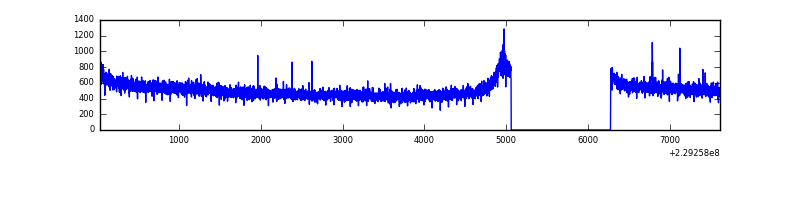 |
| B | 7577 | 6362 | 1 | 1 | 0.01% | 0.02% | 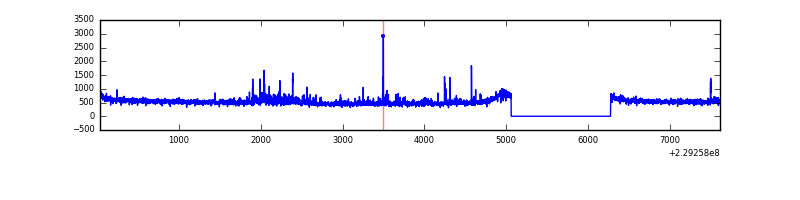 |
| C | 7577 | 6362 | 2 | 2 | 0.03% | 0.03% | 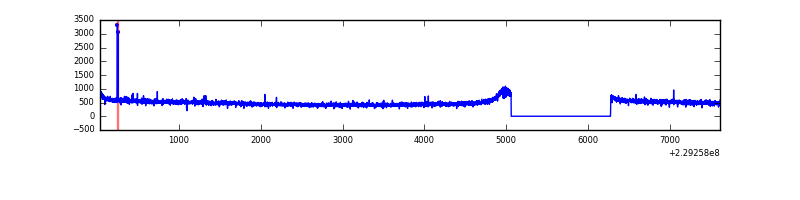 |
| D | 7577 | 6362 | 25 | 25 | 0.33% | 0.39% | 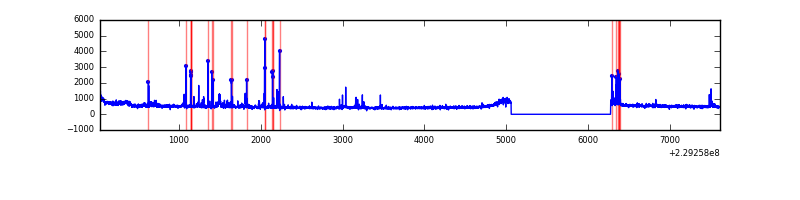 |
Top three noisy pixels from each quadrant. If the there are fewer than three noisy pixels in the level2.evt file, extra rows are filled as -1
| Pixel properties | Quadrant properties | ||||||
|---|---|---|---|---|---|---|---|
| Quadrant | DetID | PixID | Counts | Sigma | Mean | Median | Sigma |
| A | 8 | 15 | 16498 | 93.62 | 830 | 814 | 167.5 |
| A | 0 | 226 | 7994 | 42.86 | 830 | 814 | 167.5 |
| A | 12 | 194 | 7583 | 40.41 | 830 | 814 | 167.5 |
| B | 0 | 214 | 81415 | 520.77 | 830 | 811 | 154.8 |
| B | 11 | 51 | 69660 | 444.82 | 830 | 811 | 154.8 |
| B | 10 | 16 | 24411 | 152.48 | 830 | 811 | 154.8 |
| C | 5 | 128 | 9712 | 48.49 | 801 | 805 | 183.7 |
| C | 13 | 61 | 6167 | 29.19 | 801 | 805 | 183.7 |
| C | 12 | 4 | 1998 | 6.49 | 801 | 805 | 183.7 |
| D | 1 | 52 | 129569 | 616.05 | 800 | 780 | 209.1 |
| D | 13 | 105 | 96466 | 457.7 | 800 | 780 | 209.1 |
| D | 8 | 230 | 58651 | 276.82 | 800 | 780 | 209.1 |
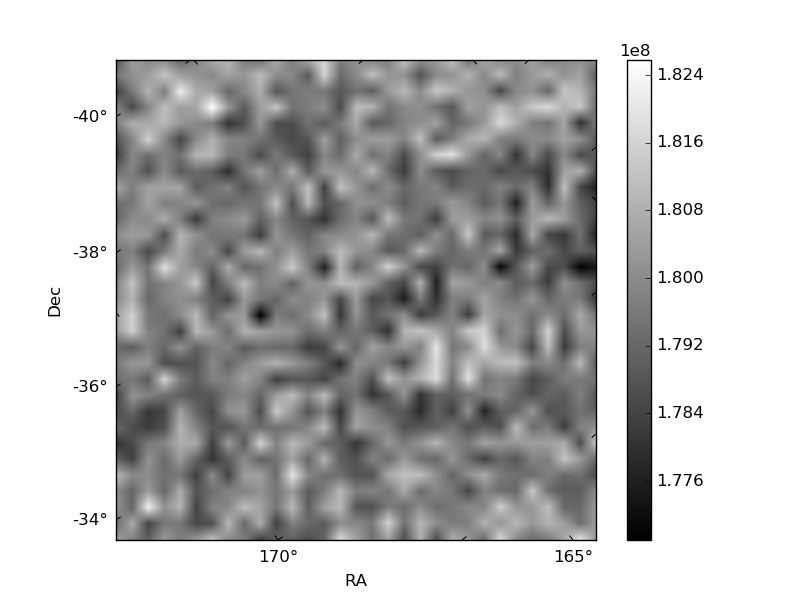
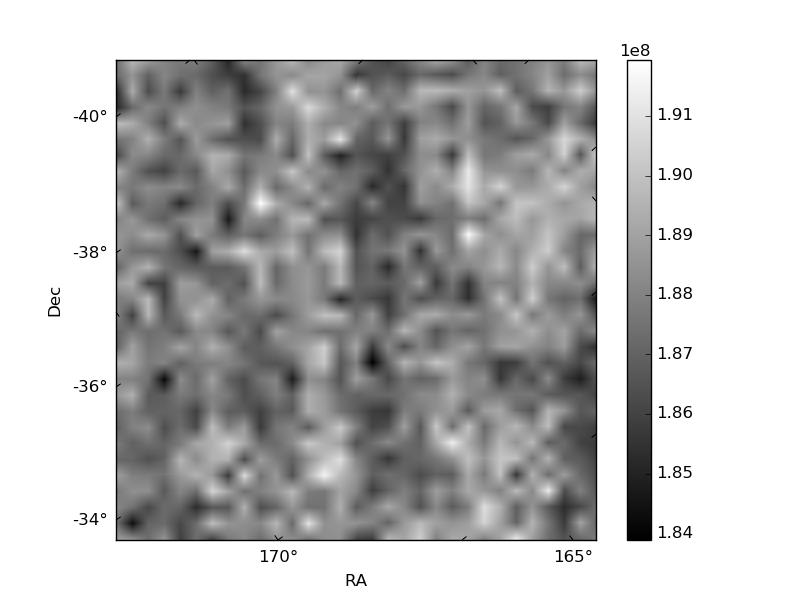
Histogram calculated using DETX and DETY for each event in the final _common_clean file
| Quadrant A | 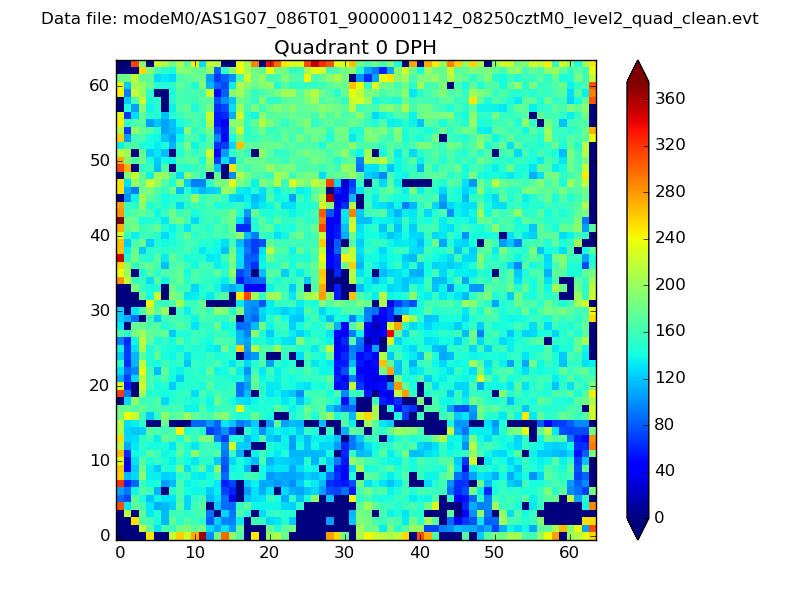 |
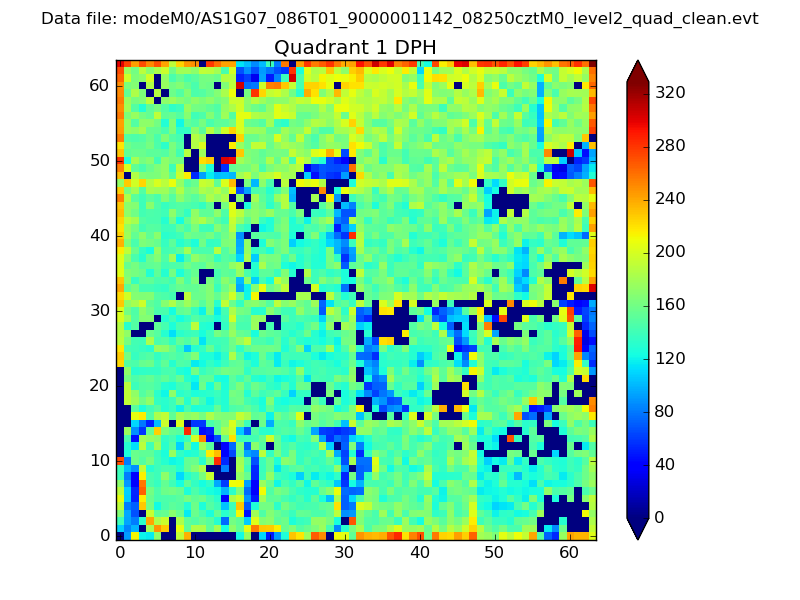 |
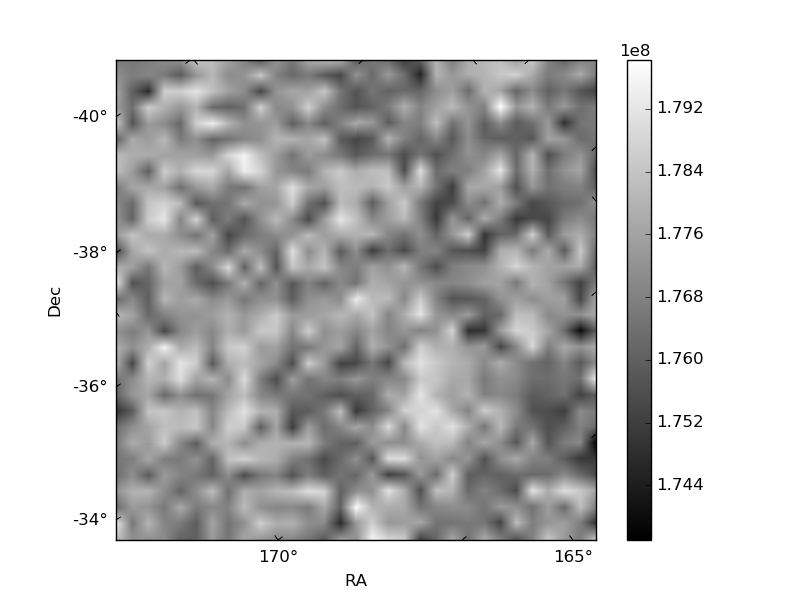
Quadrant B |
|---|---|---|---|
| Quadrant D |  |
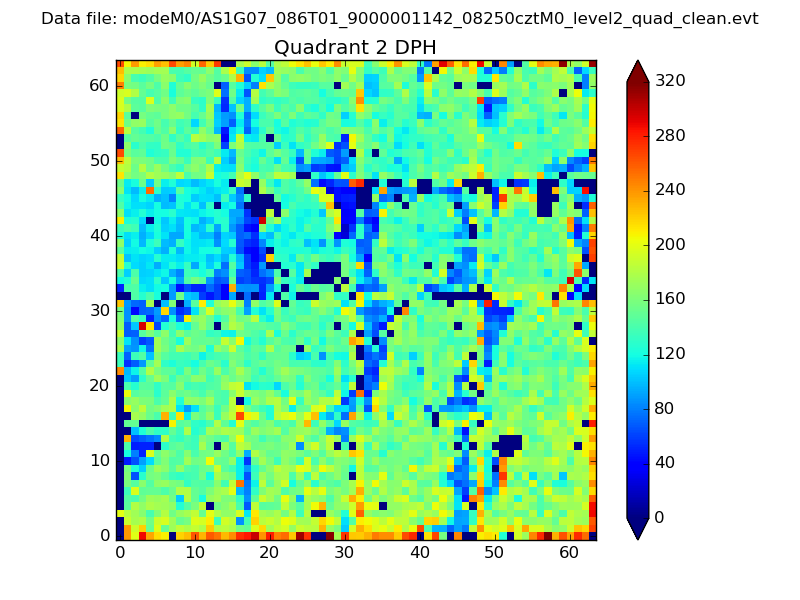 |
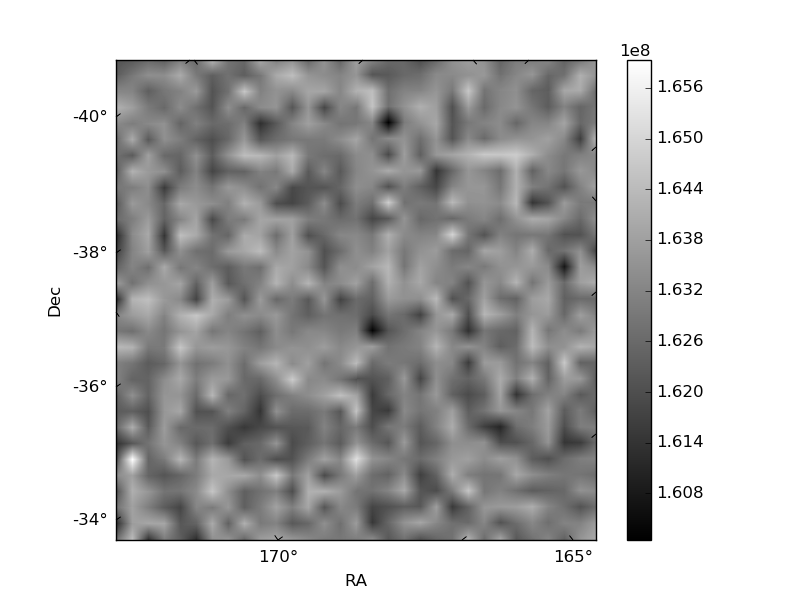
Quadrant C |
| Plot type | Count rate plots | Images |
|---|---|---|
| Comparison with Poisson distribution Blue bars denote a histogram of data divided into 1 sec bins. Red curve is a Poisson curve with rate = median count rate of data. |
 |
 |
| Quadrant-wise count rates Data is divided into 100 sec bins |
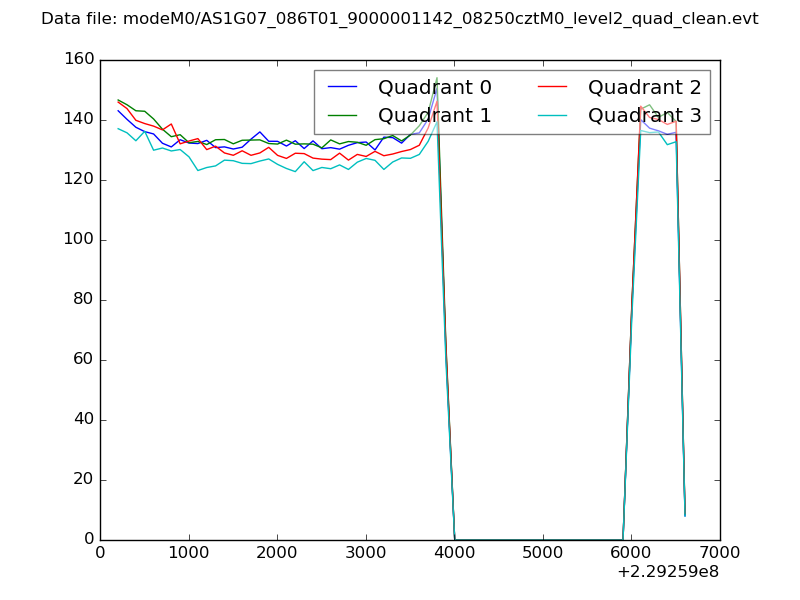 |
|
| Module-wise count rates for Quadrant A Data is divided into 100 sec bins |
 |
 |
| Module-wise count rates for Quadrant B Data is divided into 100 sec bins |
 |
 |
| Module-wise count rates for Quadrant C Data is divided into 100 sec bins |
 |
 |
| Module-wise count rates for Quadrant D Data is divided into 100 sec bins |
 |
 |
| Parameter | Plot |
|---|---|
| CZT HV Monitor |  |
| D_VDD | 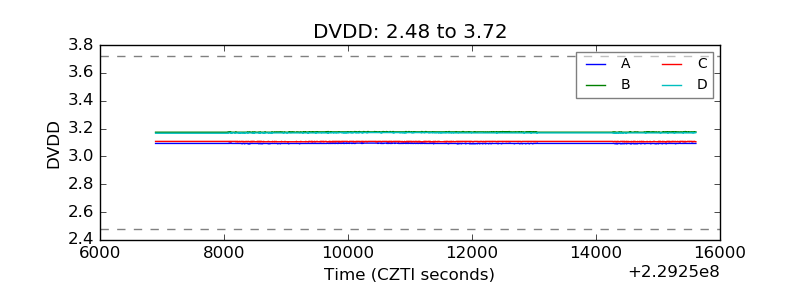 |
| Temperature 1 | 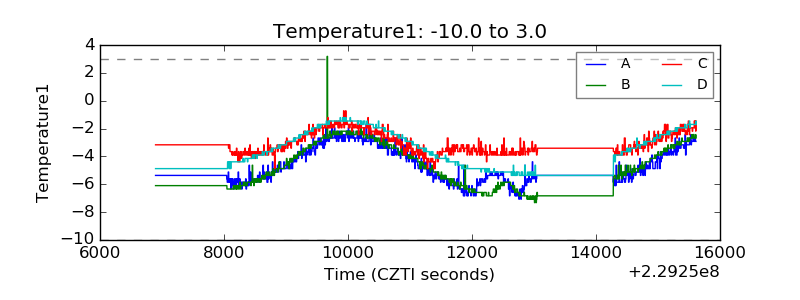 |
| Veto HV Monitor | 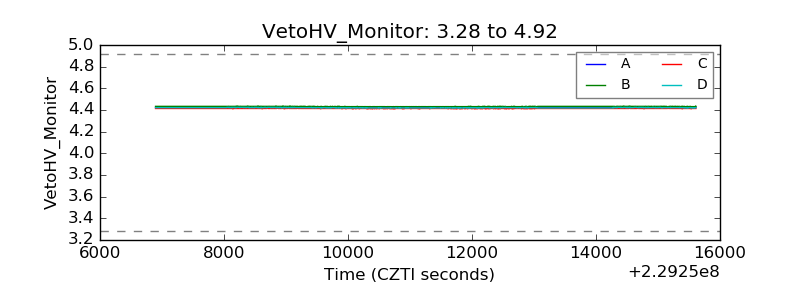 |
| Veto LLD | 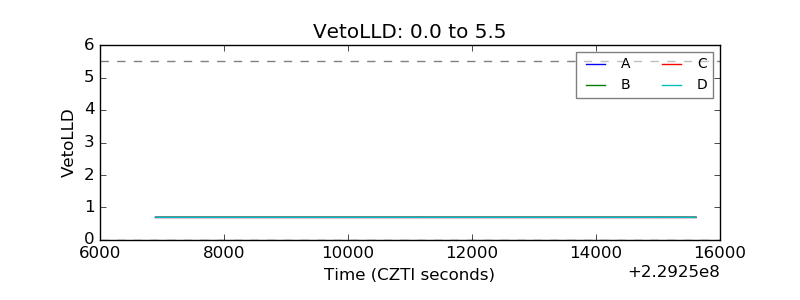 |
| Alpha Counter | 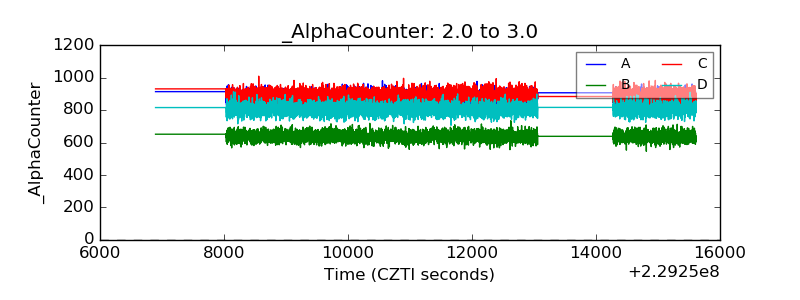 |
| _CPM_Rate | 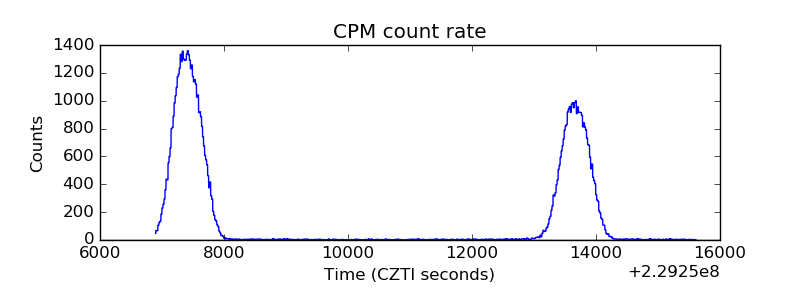 |
| CZT Counter | 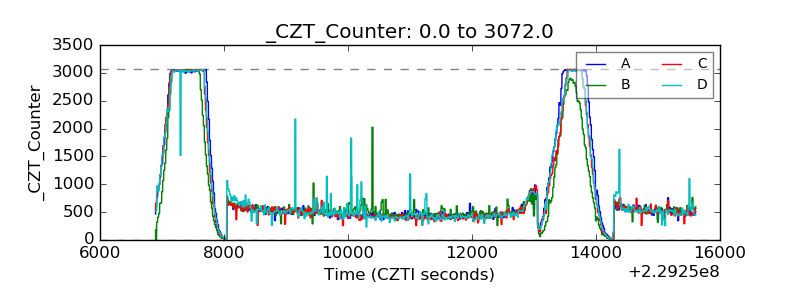 |
| +2.5 Volts monitor |  |
| +5 Volts monitor |  |
| _ROLL_ROT | 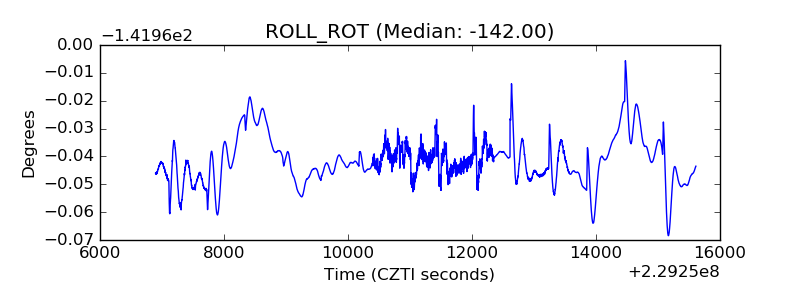 |
| _Roll_DEC | 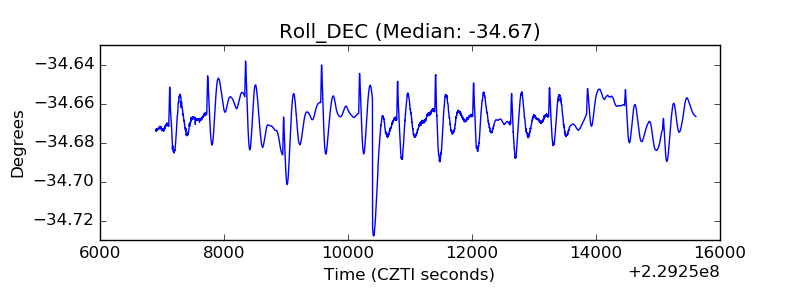 |
| _Roll_RA | 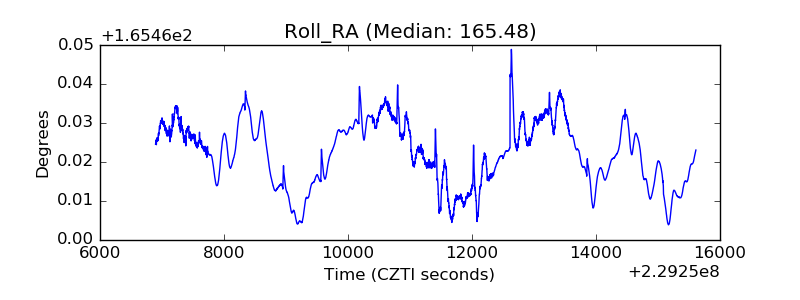 |
| Veto Counter |  |