| Param | Original file | Final file |
|---|---|---|
| Filename | modeM0/AS1G07_086T01_9000001142_08251cztM0_level2.evt | modeM0/AS1G07_086T01_9000001142_08251cztM0_level2_quad_clean.evt |
| Size (bytes) | 254,692,800 | 56,113,920 |
| Size | 242.9 MB | 53.5 MB |
| Events in quadrant A | 1,850,507 | 363,300 |
| Events in quadrant B | 2,056,866 | 367,422 |
| Events in quadrant C | 1,726,659 | 361,029 |
| Events in quadrant D | 1,828,500 | 348,298 |
| Mode M0 | |||
|---|---|---|---|
| Quadrant | BADHDUFLAG | Total packets | Discarded packets |
| A | 0 | 7881 | 63 |
| B | 0 | 8426 | 78 |
| C | 0 | 7708 | 51 |
| D | 0 | 8016 | 53 |
| Mode SS | |||
|---|---|---|---|
| Quadrant | BADHDUFLAG | Total packets | Discarded packets |
| A | 0 | 76 | 0 |
| B | 0 | 76 | 0 |
| C | 0 | 76 | 0 |
| D | 0 | 76 | 2 |
| Mode M9 | |||
|---|---|---|---|
| Quadrant | BADHDUFLAG | Total packets | Discarded packets |
| A | 0 | 12 | 0 |
| B | 0 | 12 | 0 |
| C | 0 | 12 | 0 |
| D | 0 | 12 | 0 |
| Quadrant | Total seconds | Saturated seconds | Saturation percentage |
|---|---|---|---|
| A | 3659 | 135 | 3.689533% |
| B | 3656 | 144 | 3.938731% |
| C | 3664 | 123 | 3.356987% |
| D | 3663 | 138 | 3.767404% |
Noise dominated data is calculated using 1-second bins in cleaned event files. If a bin has >2000 counts, and if more than 50% of those come from <1% of pixels, then it is considered to be noise-dominated and hence unusable.
| Quadrant | # 1 sec bins | Bins with >0 counts | Bins with >2000 counts | High rate bins dominated by noise | Noise dominated (total time) | Noise dominated (detector-on time) | Marked lightcurve |
|---|---|---|---|---|---|---|---|
| A | 4902 | 3685 | 2 | 2 | 0.04% | 0.05% | 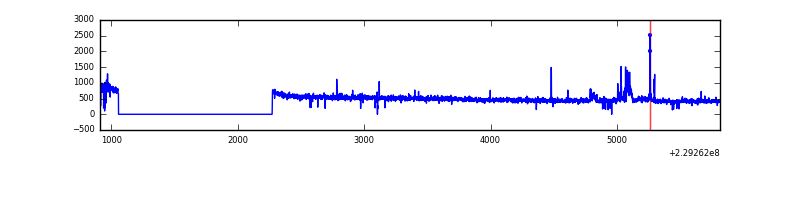 |
| B | 4902 | 3686 | 14 | 14 | 0.29% | 0.38% | 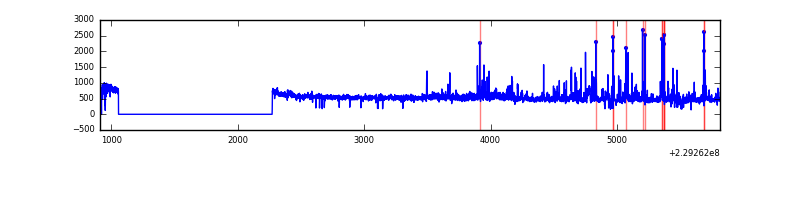 |
| C | 4902 | 3686 | 0 | 0 | 0.00% | 0.00% |  |
| D | 4902 | 3686 | 17 | 17 | 0.35% | 0.46% | 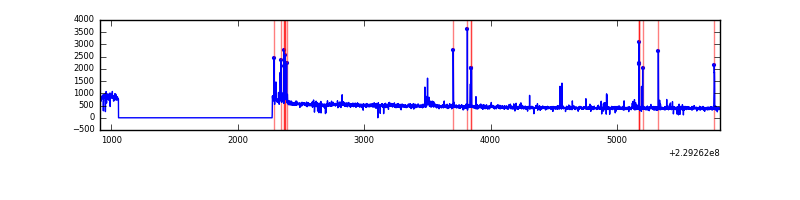 |
Top three noisy pixels from each quadrant. If the there are fewer than three noisy pixels in the level2.evt file, extra rows are filled as -1
| Pixel properties | Quadrant properties | ||||||
|---|---|---|---|---|---|---|---|
| Quadrant | DetID | PixID | Counts | Sigma | Mean | Median | Sigma |
| A | 15 | 234 | 63345 | 669.56 | 461 | 452 | 93.9 |
| A | 8 | 15 | 5906 | 58.06 | 461 | 452 | 93.9 |
| A | 0 | 226 | 4490 | 42.99 | 461 | 452 | 93.9 |
| B | 10 | 16 | 98457 | 1117.7 | 459 | 449 | 87.7 |
| B | 0 | 214 | 97474 | 1106.49 | 459 | 449 | 87.7 |
| B | 11 | 51 | 60039 | 679.58 | 459 | 449 | 87.7 |
| C | 5 | 128 | 5317 | 47.89 | 441 | 444 | 101.7 |
| C | 13 | 61 | 3341 | 28.47 | 441 | 444 | 101.7 |
| C | 12 | 4 | 1281 | 8.23 | 441 | 444 | 101.7 |
| D | 13 | 105 | 68185 | 617.96 | 446 | 432 | 109.6 |
| D | 11 | 144 | 44952 | 406.05 | 446 | 432 | 109.6 |
| D | 2 | 14 | 14544 | 128.71 | 446 | 432 | 109.6 |
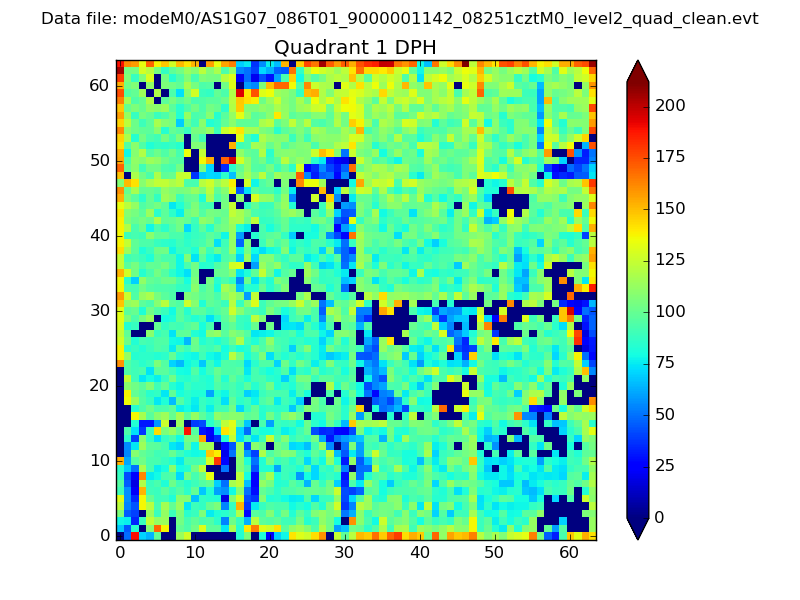
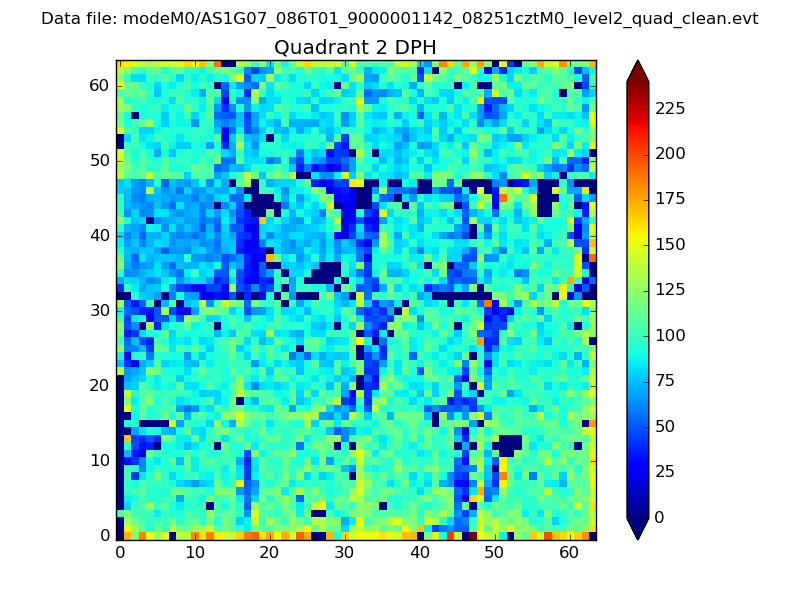
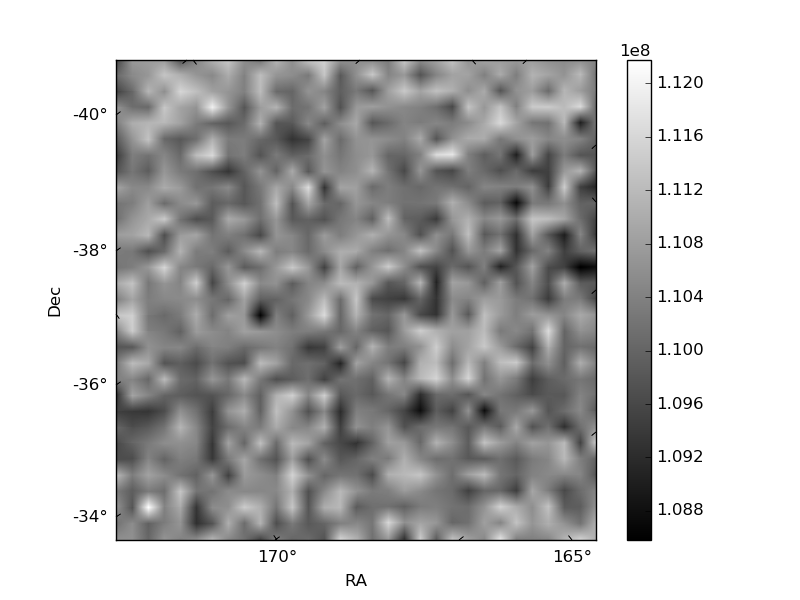
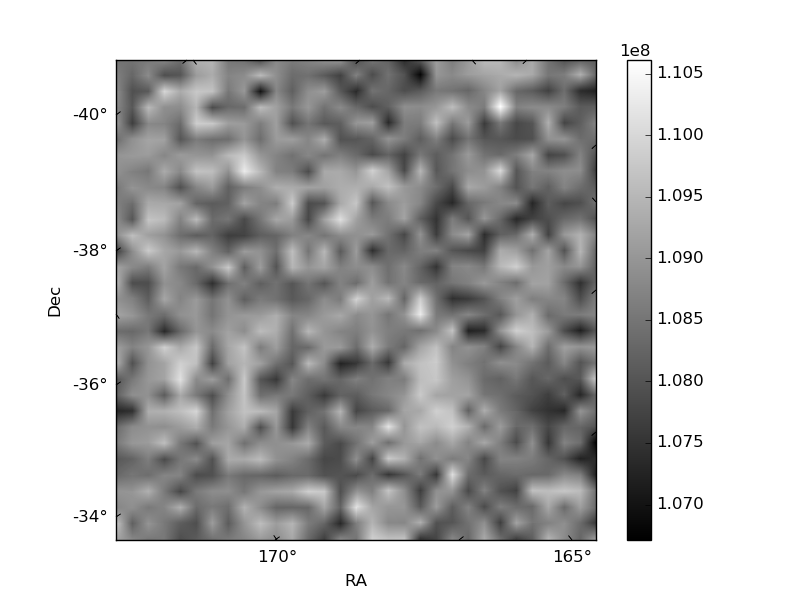
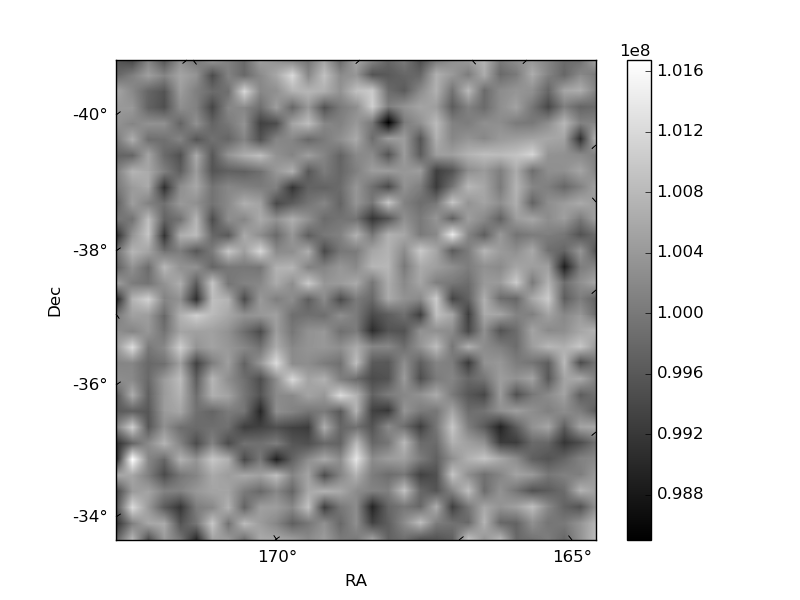
Histogram calculated using DETX and DETY for each event in the final _common_clean file
| Quadrant A | 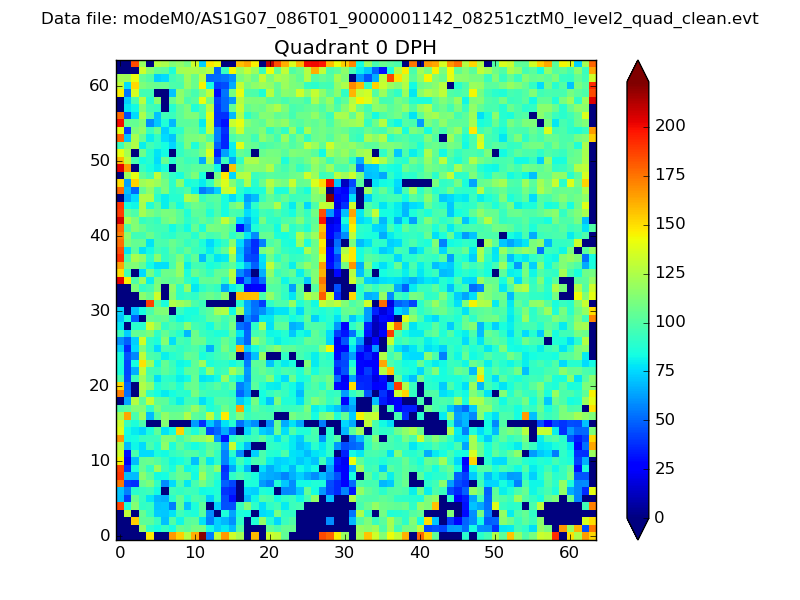 |
 |
Quadrant B |
|---|---|---|---|
| Quadrant D | 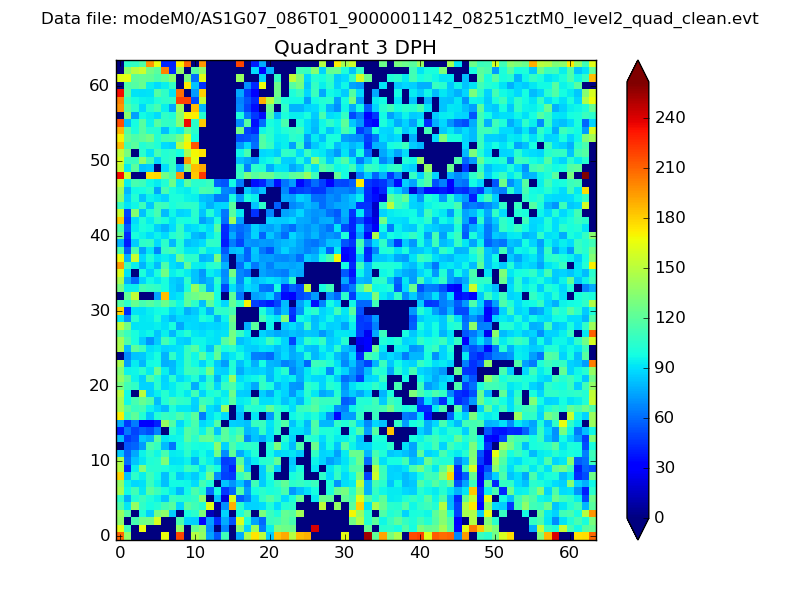 |
 |
Quadrant C |
| Plot type | Count rate plots | Images |
|---|---|---|
| Comparison with Poisson distribution Blue bars denote a histogram of data divided into 1 sec bins. Red curve is a Poisson curve with rate = median count rate of data. |
 |
 |
| Quadrant-wise count rates Data is divided into 100 sec bins |
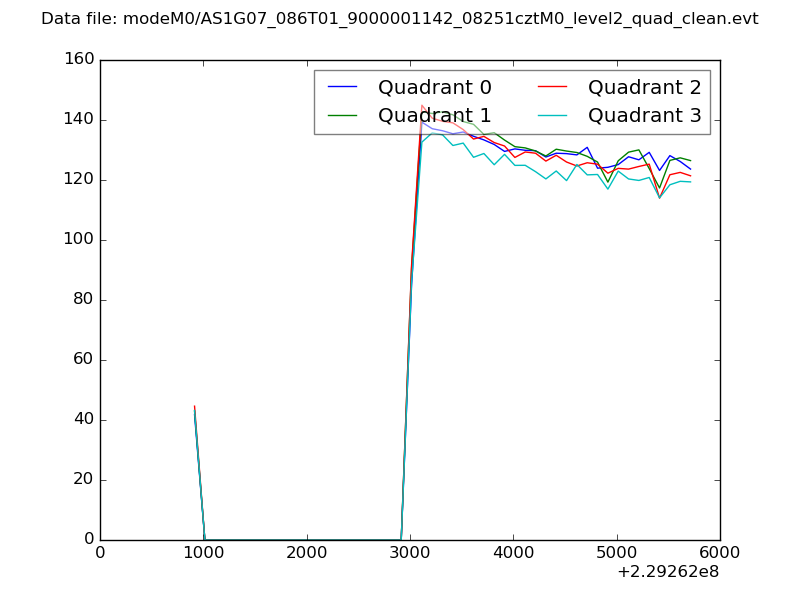 |
|
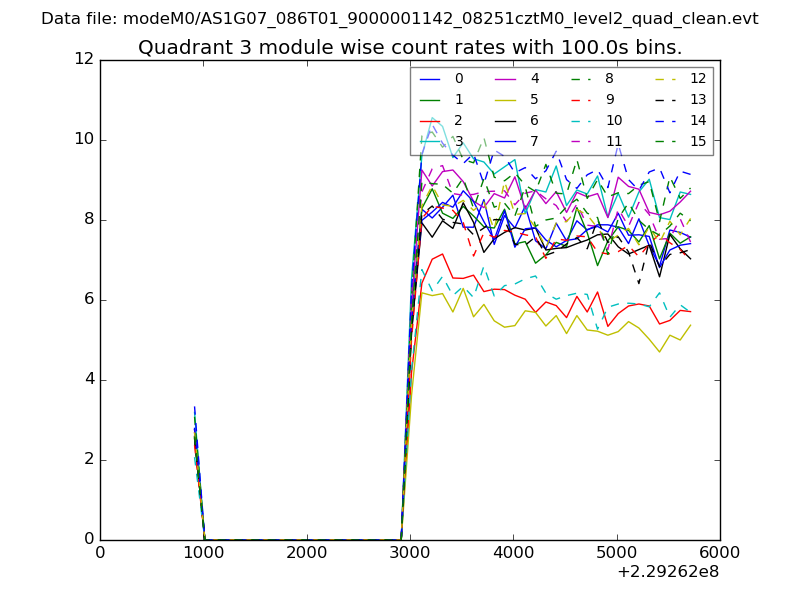
| Module-wise count rates for Quadrant A Data is divided into 100 sec bins |
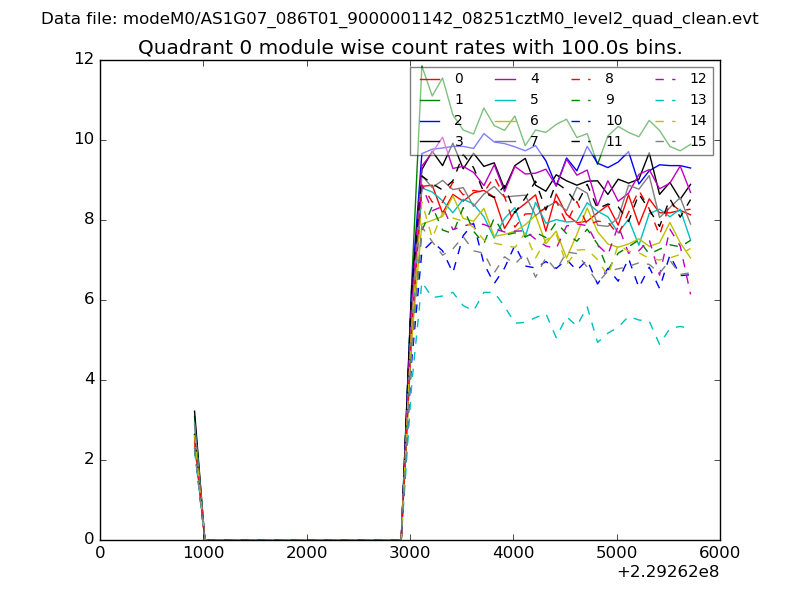 |
 |
| Module-wise count rates for Quadrant B Data is divided into 100 sec bins |
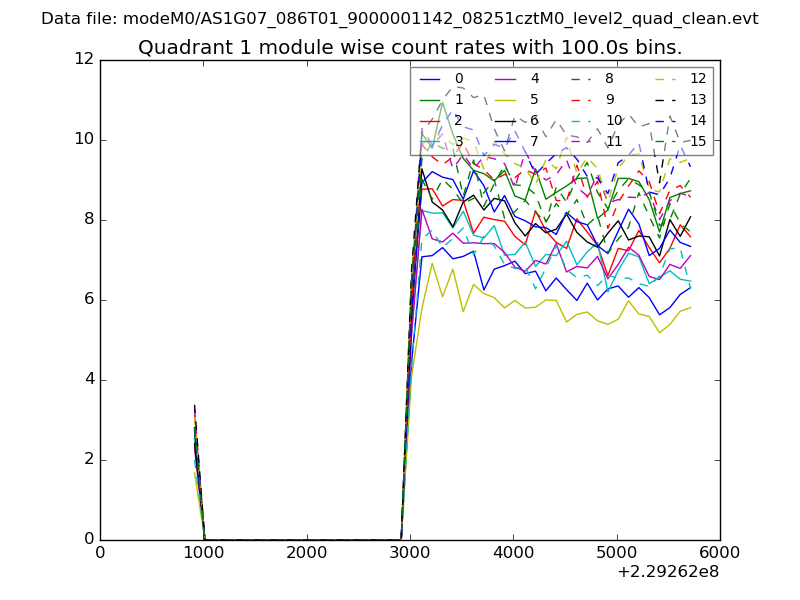 |
 |
| Module-wise count rates for Quadrant C Data is divided into 100 sec bins |
 |
 |
| Module-wise count rates for Quadrant D Data is divided into 100 sec bins |
 |
 |
| Parameter | Plot |
|---|---|
| CZT HV Monitor |  |
| D_VDD | 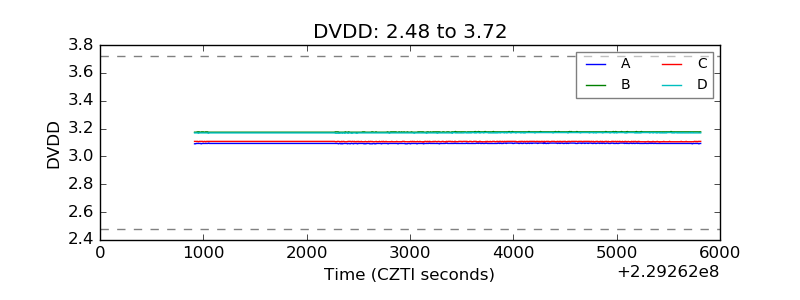 |
| Temperature 1 | 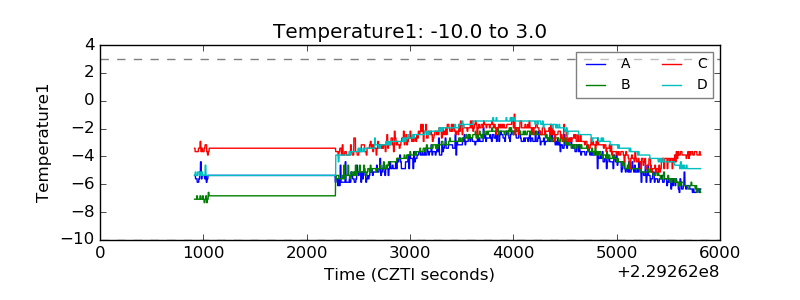 |
| Veto HV Monitor | 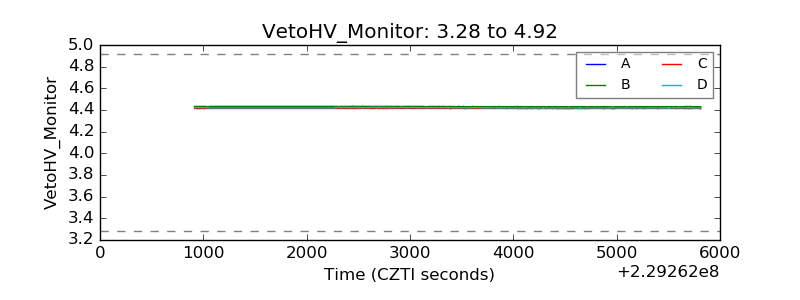 |
| Veto LLD | 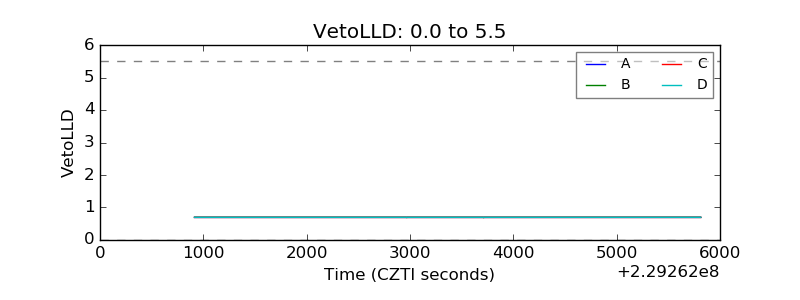 |
| Alpha Counter | 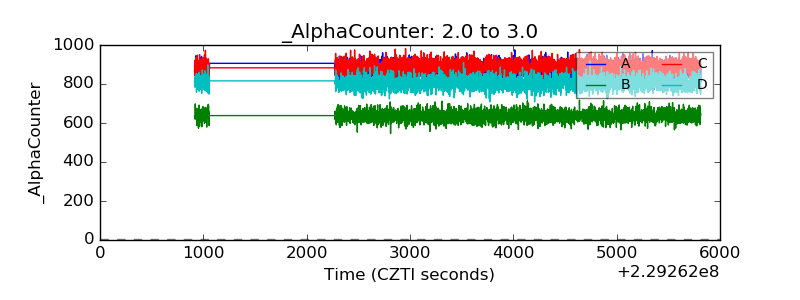 |
| _CPM_Rate | 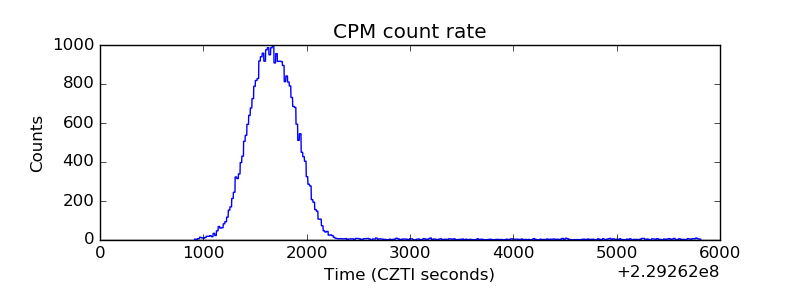 |
| CZT Counter | 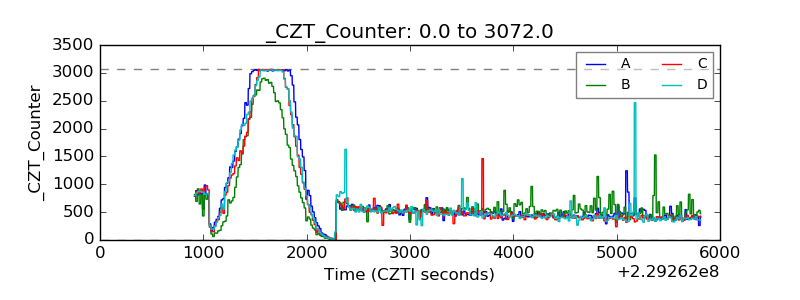 |
| +2.5 Volts monitor | 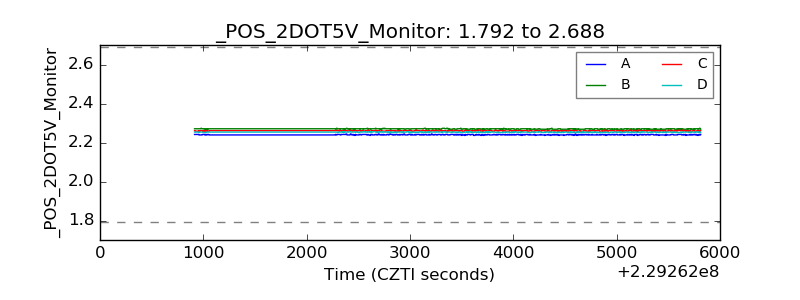 |
| +5 Volts monitor |  |
| _ROLL_ROT | 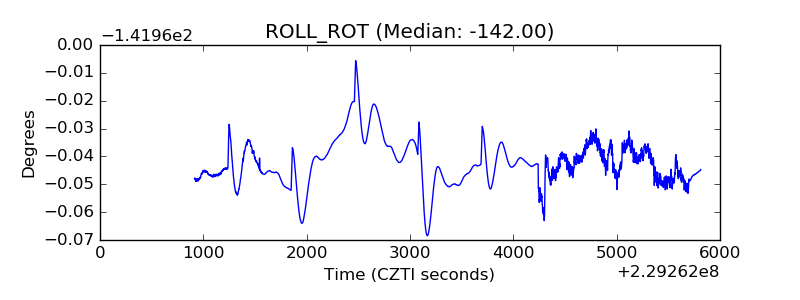 |
| _Roll_DEC | 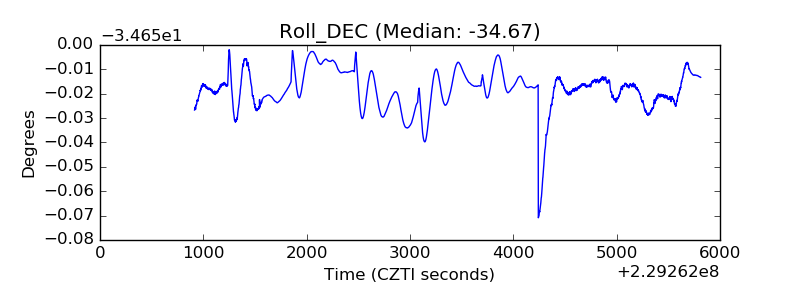 |
| _Roll_RA | 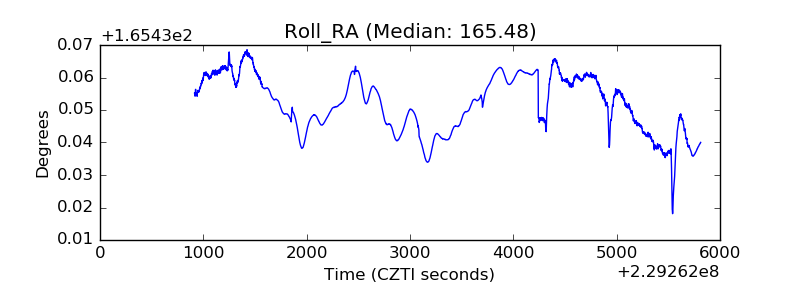 |
| Veto Counter | 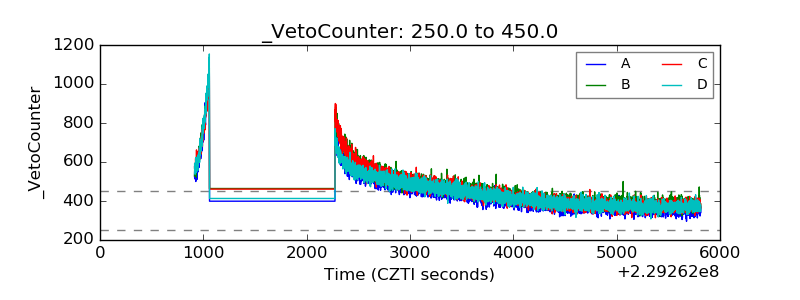 |