| Param | Original file | Final file |
|---|---|---|
| Filename | modeM0/AS1T01_164T01_9000001140_08237cztM0_level2.evt | modeM0/AS1T01_164T01_9000001140_08237cztM0_level2_quad_clean.evt |
| Size (bytes) | 143,242,560 | 11,787,840 |
| Size | 136.6 MB | 11.2 MB |
| Events in quadrant A | 1,076,860 | 55,078 |
| Events in quadrant B | 1,096,865 | 56,096 |
| Events in quadrant C | 957,165 | 57,601 |
| Events in quadrant D | 1,081,547 | 54,723 |
| Mode M0 | |||
|---|---|---|---|
| Quadrant | BADHDUFLAG | Total packets | Discarded packets |
| A | 0 | 4277 | 2 |
| B | 0 | 4359 | 1 |
| C | 0 | 4000 | 1 |
| D | 0 | 4395 | 1 |
| Mode SS | |||
|---|---|---|---|
| Quadrant | BADHDUFLAG | Total packets | Discarded packets |
| A | 0 | 38 | 0 |
| B | 0 | 38 | 0 |
| C | 0 | 38 | 0 |
| D | 0 | 38 | 0 |
| Mode M9 | |||
|---|---|---|---|
| Quadrant | BADHDUFLAG | Total packets | Discarded packets |
| A | 0 | 11 | 0 |
| B | 0 | 11 | 0 |
| C | 0 | 11 | 0 |
| D | 0 | 11 | 0 |
| Quadrant | Total seconds | Saturated seconds | Saturation percentage |
|---|---|---|---|
| A | 1812 | 94 | 5.187638% |
| B | 1812 | 113 | 6.236203% |
| C | 1812 | 56 | 3.090508% |
| D | 1812 | 78 | 4.304636% |
Noise dominated data is calculated using 1-second bins in cleaned event files. If a bin has >2000 counts, and if more than 50% of those come from <1% of pixels, then it is considered to be noise-dominated and hence unusable.
| Quadrant | # 1 sec bins | Bins with >0 counts | Bins with >2000 counts | High rate bins dominated by noise | Noise dominated (total time) | Noise dominated (detector-on time) | Marked lightcurve |
|---|---|---|---|---|---|---|---|
| A | 2917 | 1812 | 2 | 2 | 0.07% | 0.11% | 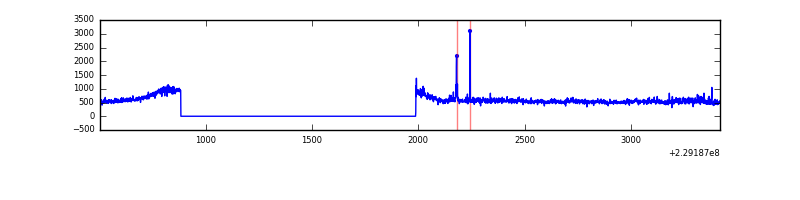 |
| B | 2917 | 1812 | 6 | 6 | 0.21% | 0.33% | 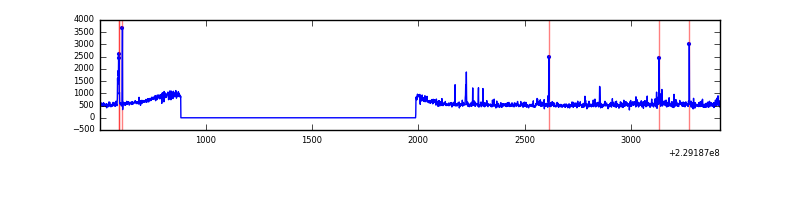 |
| C | 2917 | 1812 | 0 | 0 | 0.00% | 0.00% | 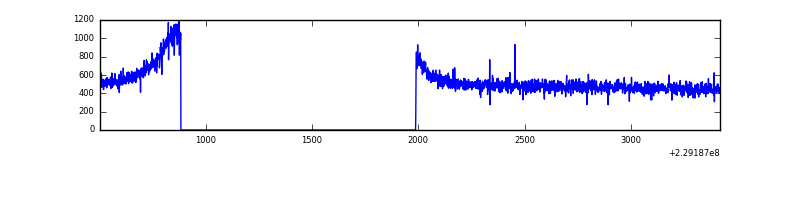 |
| D | 2917 | 1813 | 9 | 9 | 0.31% | 0.50% | 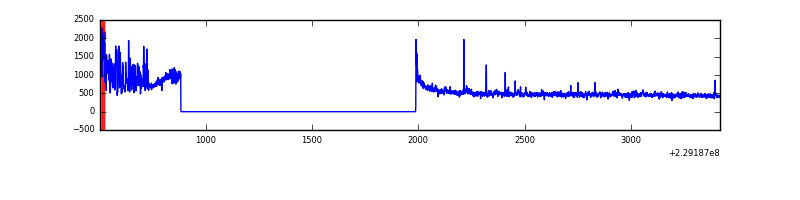 |
Top three noisy pixels from each quadrant. If the there are fewer than three noisy pixels in the level2.evt file, extra rows are filled as -1
| Pixel properties | Quadrant properties | ||||||
|---|---|---|---|---|---|---|---|
| Quadrant | DetID | PixID | Counts | Sigma | Mean | Median | Sigma |
| A | 8 | 15 | 78917 | 1437.11 | 255 | 249 | 54.7 |
| A | 0 | 254 | 8826 | 156.68 | 255 | 249 | 54.7 |
| A | 0 | 226 | 2615 | 43.22 | 255 | 249 | 54.7 |
| B | 11 | 51 | 53206 | 1019.0 | 254 | 248 | 52.0 |
| B | 10 | 16 | 41892 | 801.3 | 254 | 248 | 52.0 |
| B | 0 | 214 | 7246 | 134.65 | 254 | 248 | 52.0 |
| C | 13 | 61 | 1865 | 27.31 | 245 | 245 | 59.3 |
| C | 3 | 202 | 589 | 5.8 | 245 | 245 | 59.3 |
| C | -1 | -1 | -1 | -1.0 | 245 | 245 | 59.3 |
| D | 1 | 52 | 120870 | 1907.97 | 249 | 241 | 63.2 |
| D | 13 | 105 | 7959 | 122.07 | 249 | 241 | 63.2 |
| D | 2 | 234 | 6657 | 101.48 | 249 | 241 | 63.2 |
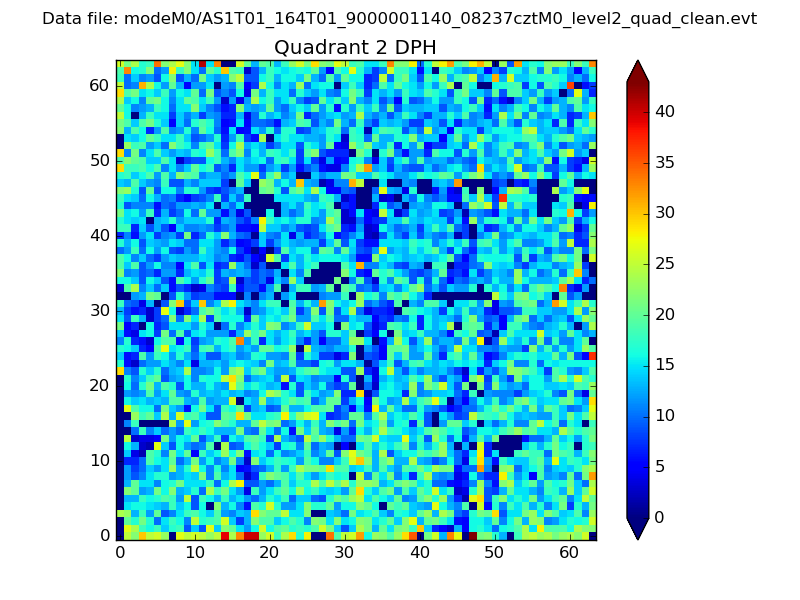
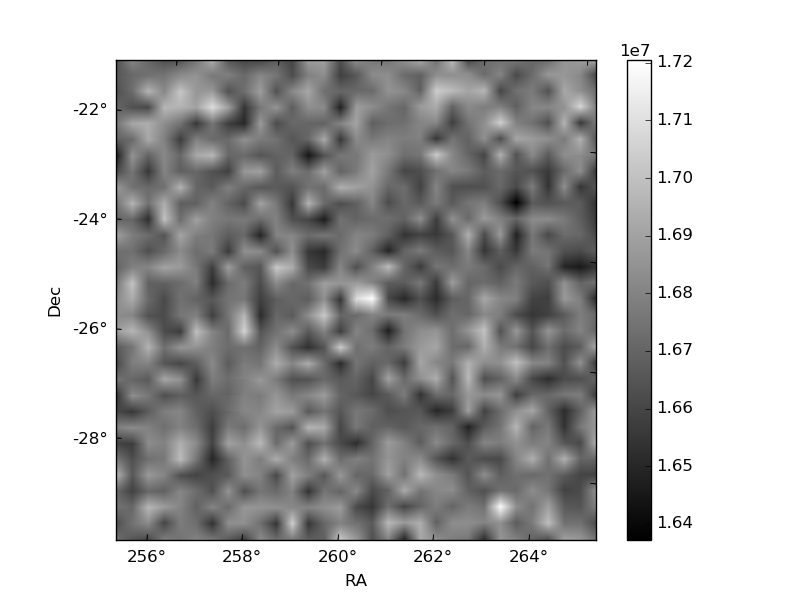
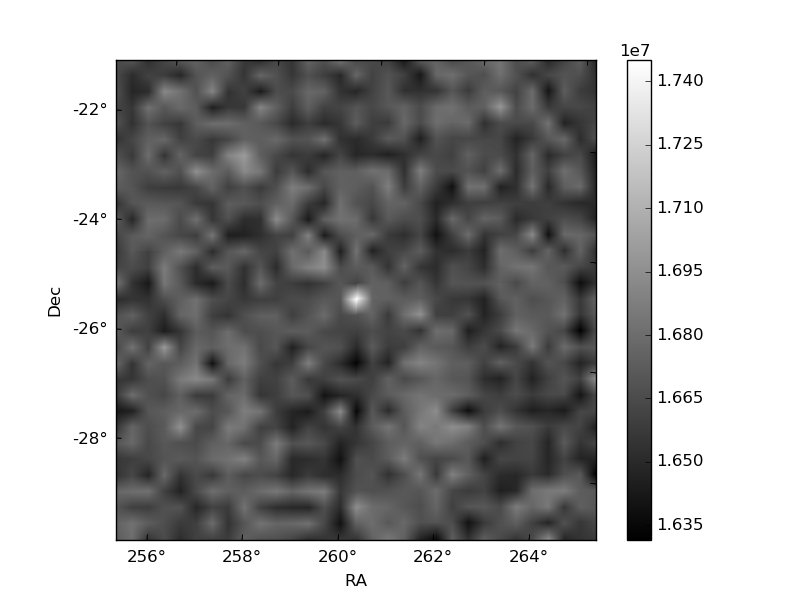
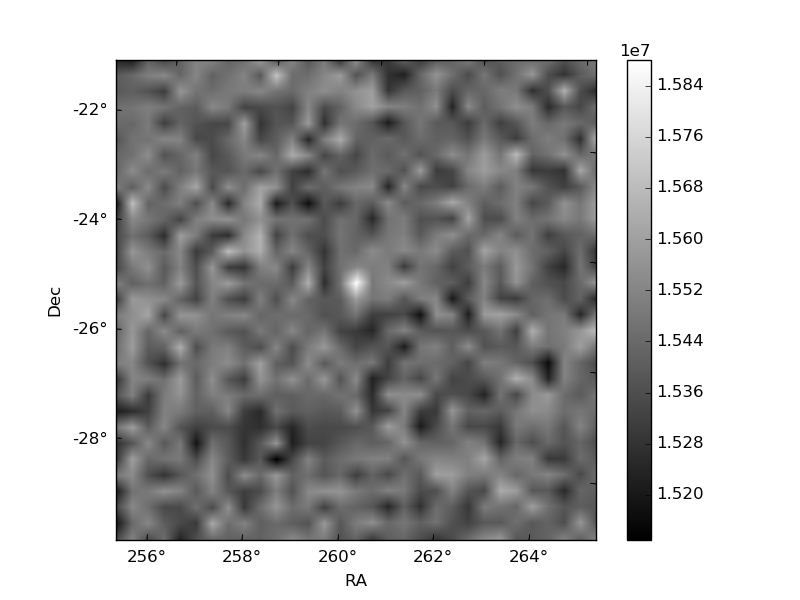
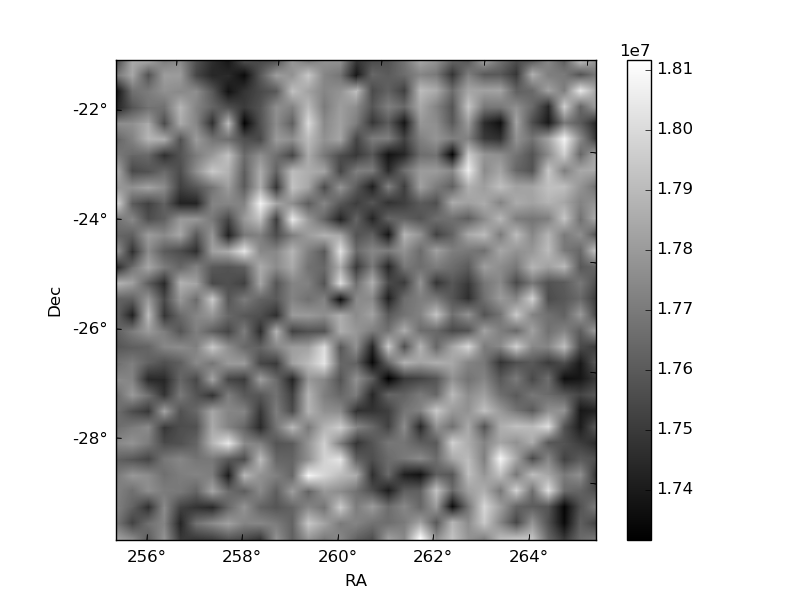
Histogram calculated using DETX and DETY for each event in the final _common_clean file
| Quadrant A | 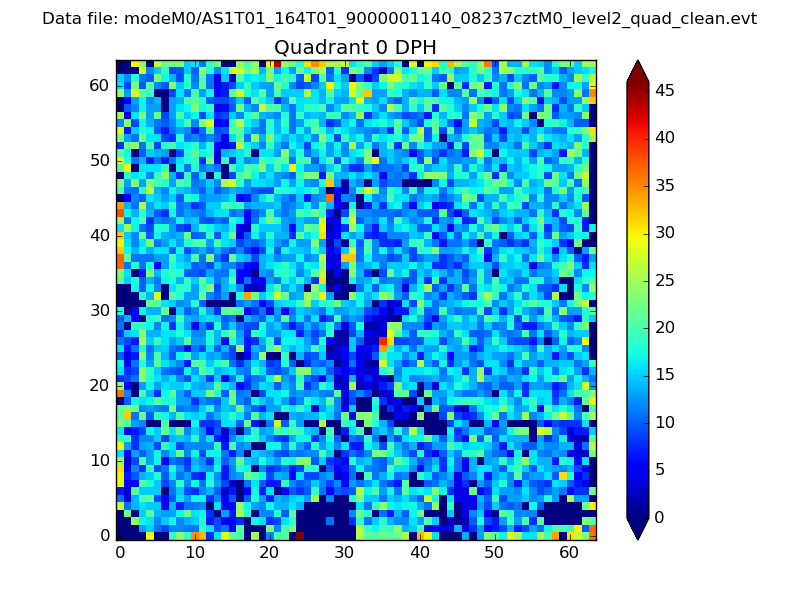 |
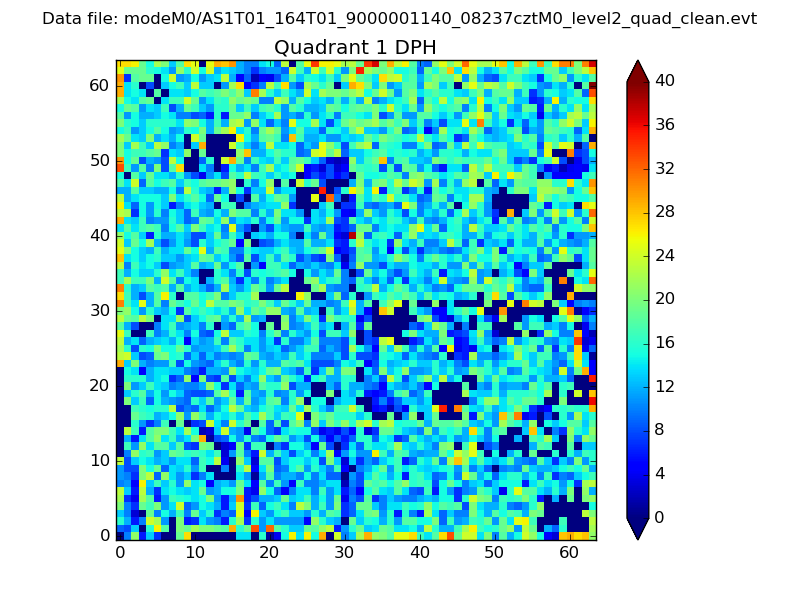 |
Quadrant B |
|---|---|---|---|
| Quadrant D | 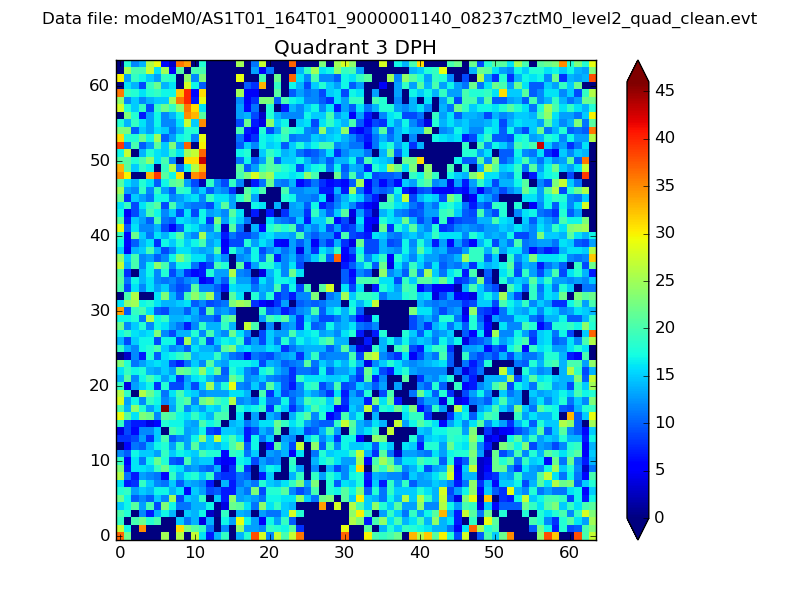 |
 |
Quadrant C |
| Plot type | Count rate plots | Images |
|---|---|---|
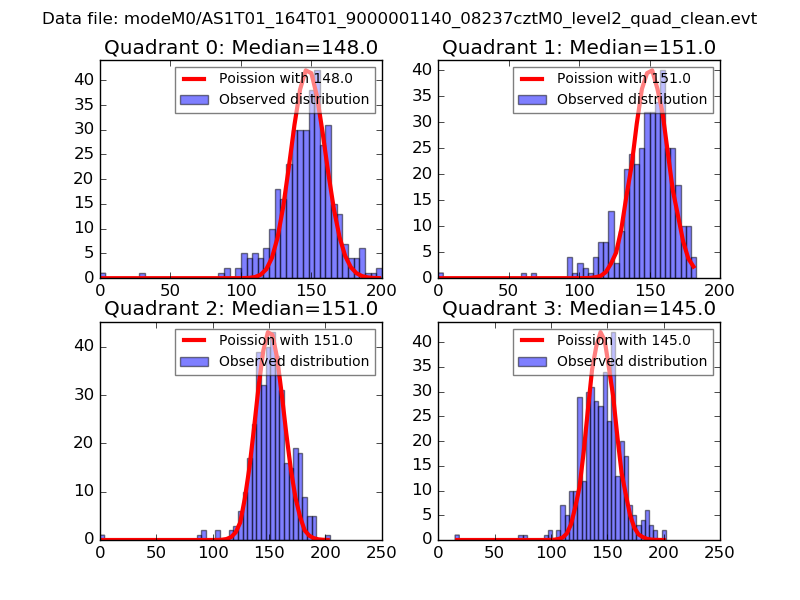
| Comparison with Poisson distribution Blue bars denote a histogram of data divided into 1 sec bins. Red curve is a Poisson curve with rate = median count rate of data. |
 |
 |
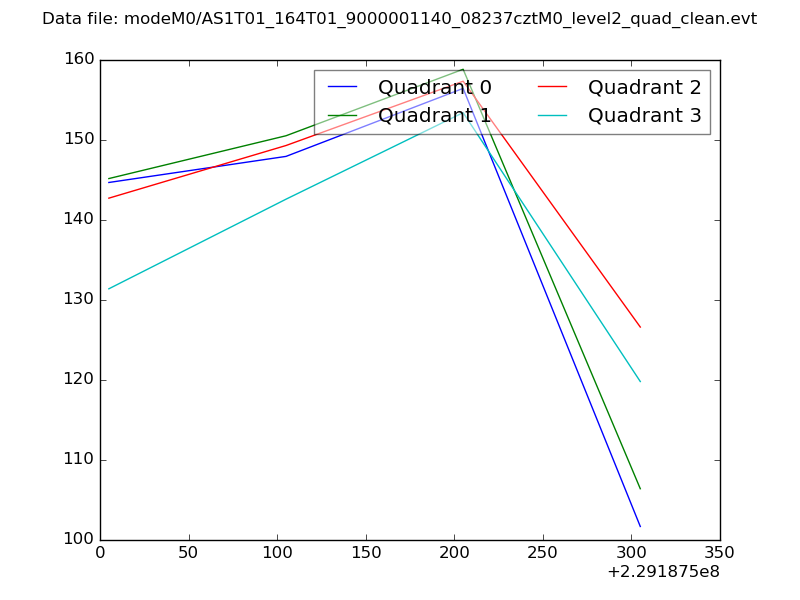
| Quadrant-wise count rates Data is divided into 100 sec bins |
 |
|
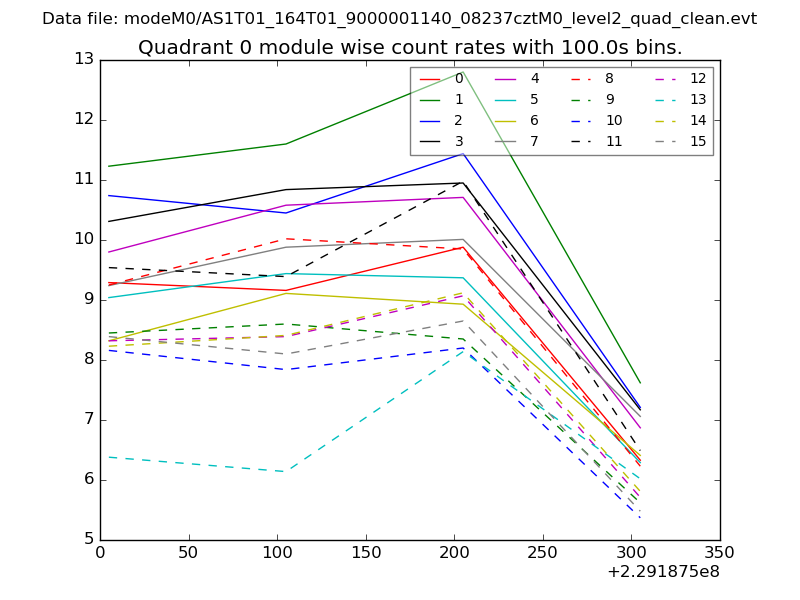
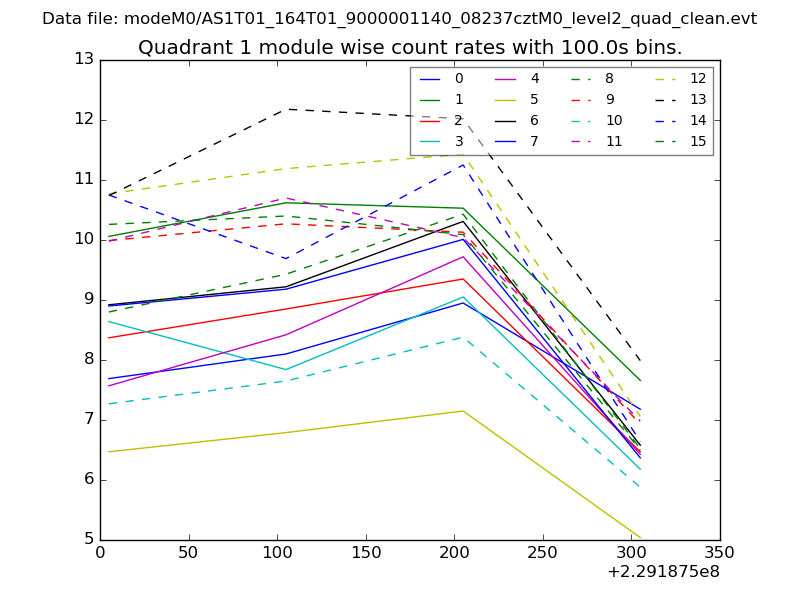
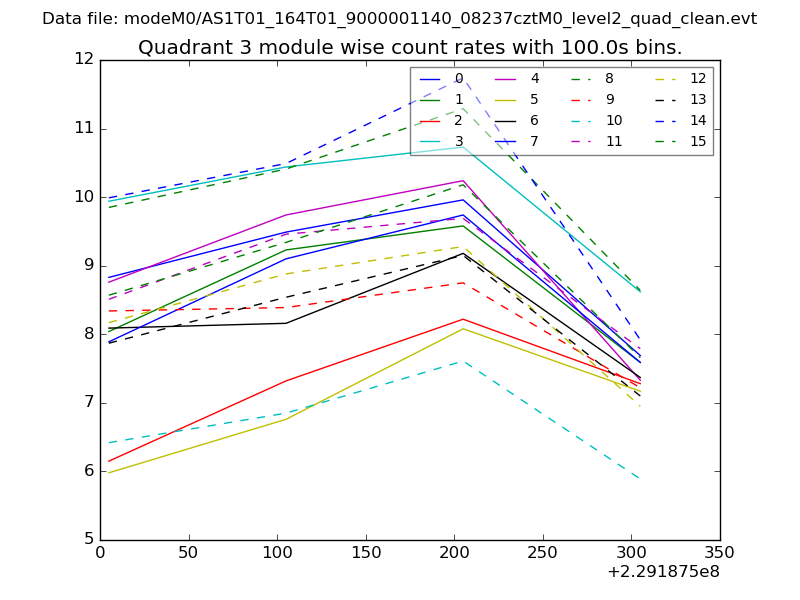
| Module-wise count rates for Quadrant A Data is divided into 100 sec bins |
 |
 |
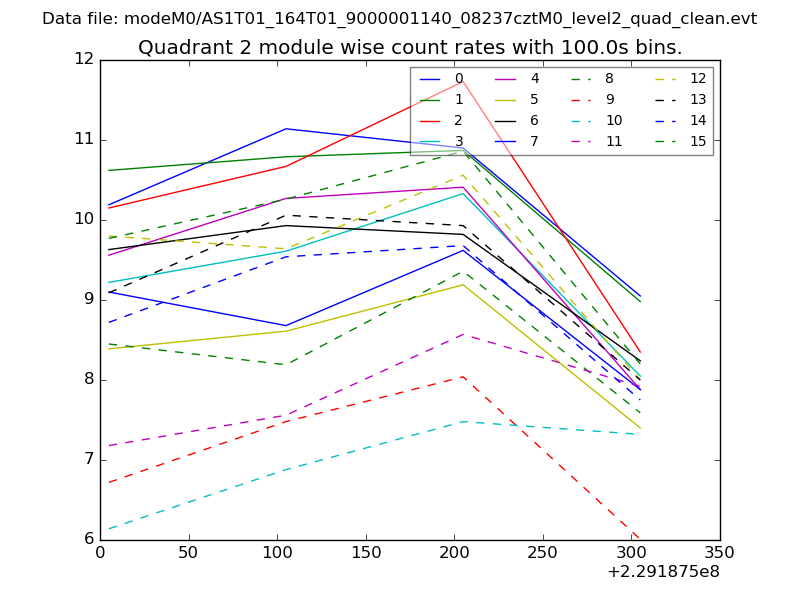
| Module-wise count rates for Quadrant B Data is divided into 100 sec bins |
 |
 |
| Module-wise count rates for Quadrant C Data is divided into 100 sec bins |
 |
 |
| Module-wise count rates for Quadrant D Data is divided into 100 sec bins |
 |
 |
| Parameter | Plot |
|---|---|
| CZT HV Monitor | 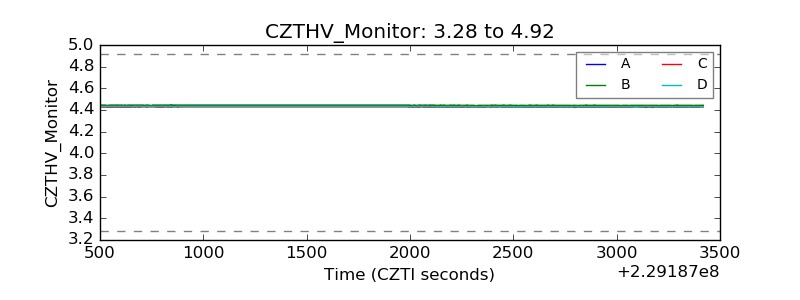 |
| D_VDD | 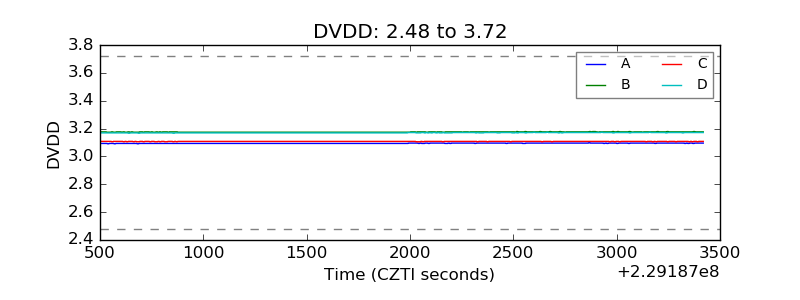 |
| Temperature 1 | 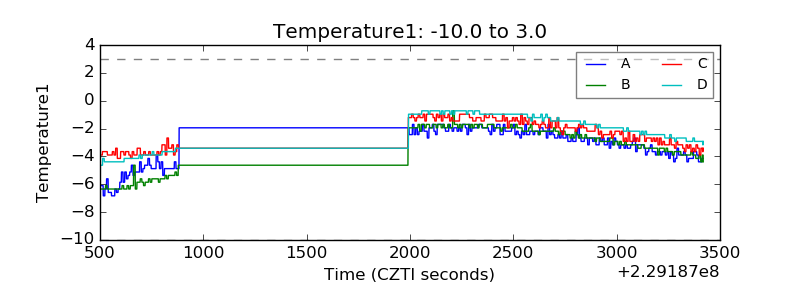 |
| Veto HV Monitor | 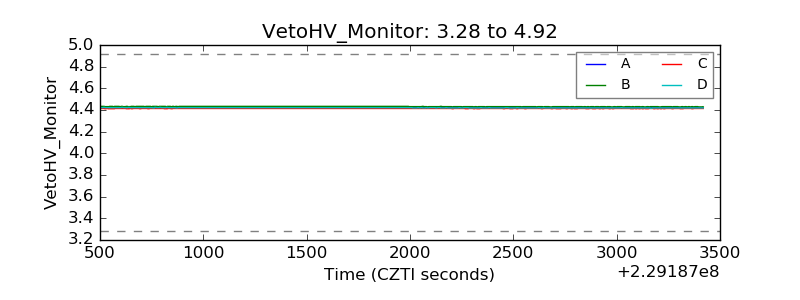 |
| Veto LLD | 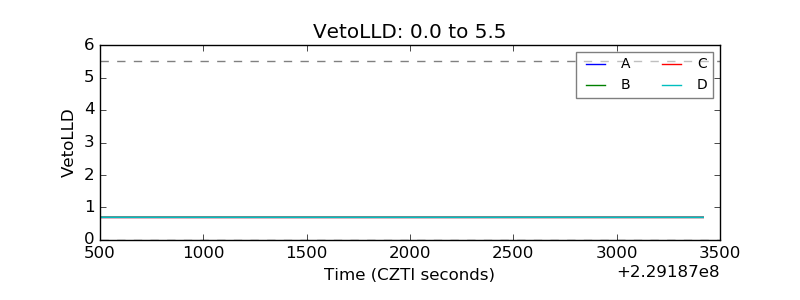 |
| Alpha Counter | 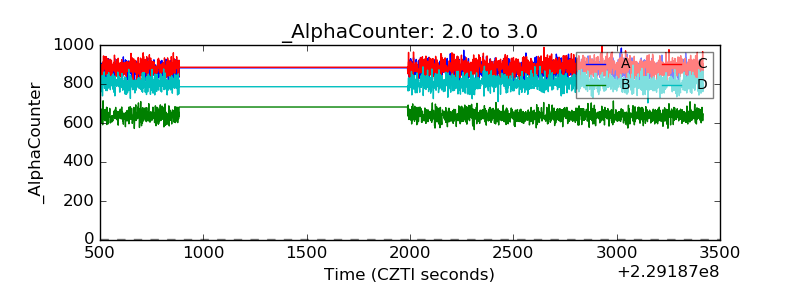 |
| _CPM_Rate | 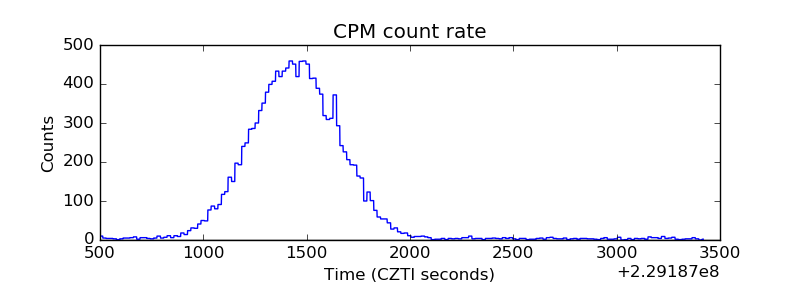 |
| CZT Counter | 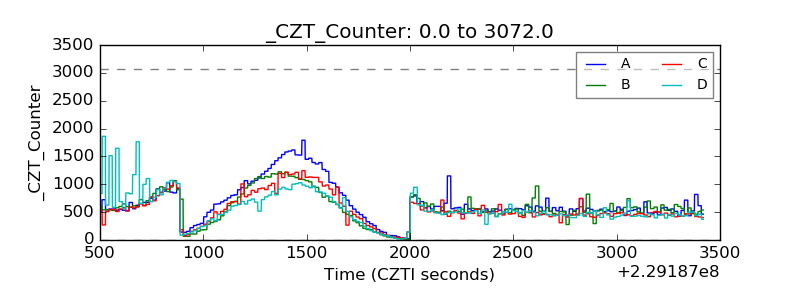 |
| +2.5 Volts monitor |  |
| +5 Volts monitor | 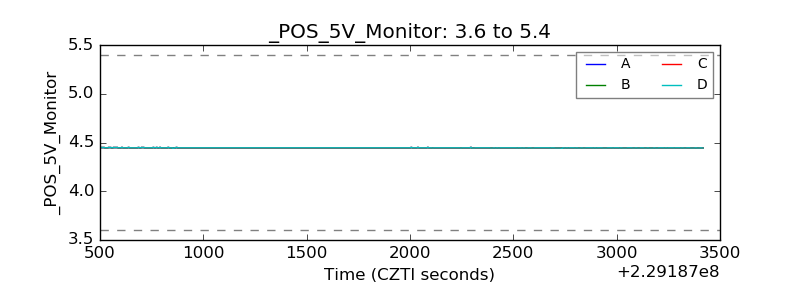 |
| _ROLL_ROT | 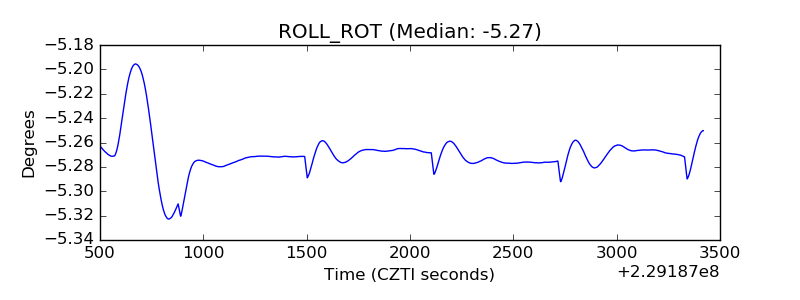 |
| _Roll_DEC |  |
| _Roll_RA | 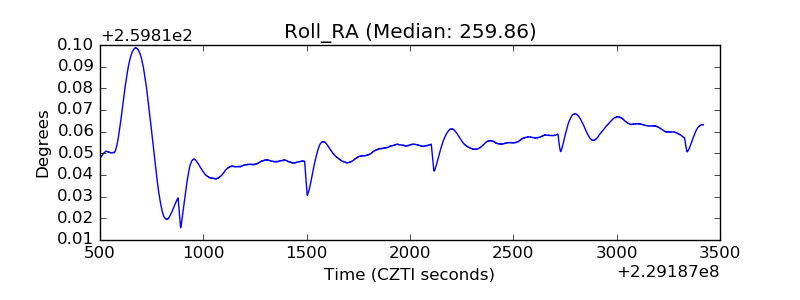 |
| Veto Counter | 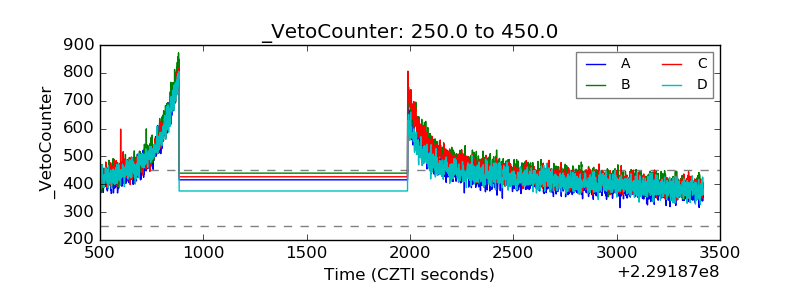 |