| Param | Original file | Final file |
|---|---|---|
| Filename | modeM0/AS1T01_164T01_9000001140_08238cztM0_level2.evt | modeM0/AS1T01_164T01_9000001140_08238cztM0_level2_quad_clean.evt |
| Size (bytes) | 448,830,720 | 78,773,760 |
| Size | 428.0 MB | 75.1 MB |
| Events in quadrant A | 3,361,563 | 483,033 |
| Events in quadrant B | 3,521,995 | 488,777 |
| Events in quadrant C | 3,111,223 | 485,089 |
| Events in quadrant D | 3,143,569 | 462,356 |
| Mode M0 | |||
|---|---|---|---|
| Quadrant | BADHDUFLAG | Total packets | Discarded packets |
| A | 0 | 14212 | 34 |
| B | 0 | 14708 | 35 |
| C | 0 | 13750 | 33 |
| D | 0 | 14050 | 51 |
| Mode SS | |||
|---|---|---|---|
| Quadrant | BADHDUFLAG | Total packets | Discarded packets |
| A | 0 | 136 | 0 |
| B | 0 | 136 | 0 |
| C | 0 | 136 | 0 |
| D | 0 | 136 | 0 |
| Mode M9 | |||
|---|---|---|---|
| Quadrant | BADHDUFLAG | Total packets | Discarded packets |
| A | 0 | 10 | 0 |
| B | 0 | 10 | 0 |
| C | 0 | 10 | 0 |
| D | 0 | 11 | 0 |
| Quadrant | Total seconds | Saturated seconds | Saturation percentage |
|---|---|---|---|
| A | 6687 | 68 | 1.016898% |
| B | 6686 | 79 | 1.181573% |
| C | 6687 | 21 | 0.314042% |
| D | 6678 | 42 | 0.628931% |
Noise dominated data is calculated using 1-second bins in cleaned event files. If a bin has >2000 counts, and if more than 50% of those come from <1% of pixels, then it is considered to be noise-dominated and hence unusable.
| Quadrant | # 1 sec bins | Bins with >0 counts | Bins with >2000 counts | High rate bins dominated by noise | Noise dominated (total time) | Noise dominated (detector-on time) | Marked lightcurve |
|---|---|---|---|---|---|---|---|
| A | 7543 | 6700 | 2 | 2 | 0.03% | 0.03% | 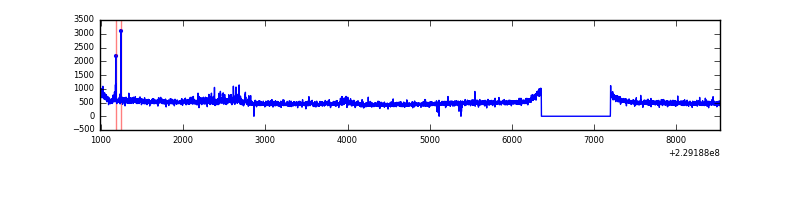 |
| B | 7543 | 6702 | 7 | 7 | 0.09% | 0.10% | 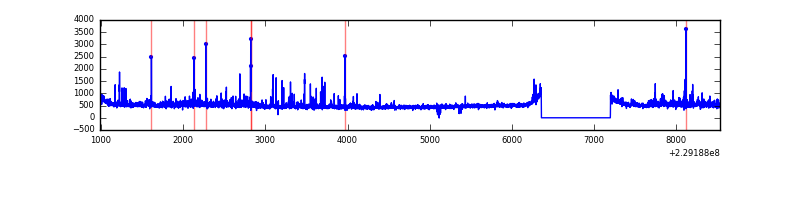 |
| C | 7543 | 6700 | 0 | 0 | 0.00% | 0.00% | 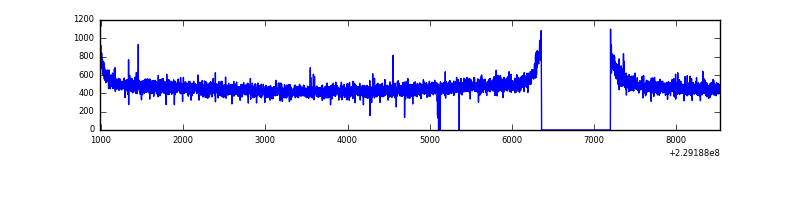 |
| D | 7543 | 6699 | 8 | 8 | 0.11% | 0.12% | 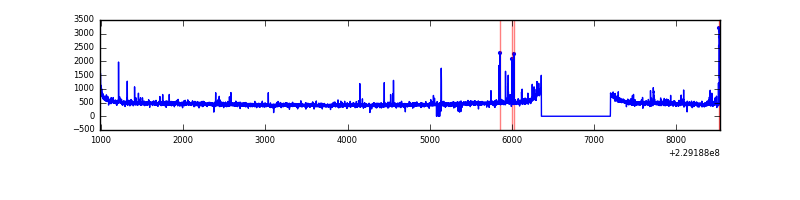 |
Top three noisy pixels from each quadrant. If the there are fewer than three noisy pixels in the level2.evt file, extra rows are filled as -1
| Pixel properties | Quadrant properties | ||||||
|---|---|---|---|---|---|---|---|
| Quadrant | DetID | PixID | Counts | Sigma | Mean | Median | Sigma |
| A | 8 | 15 | 185567 | 1097.24 | 819 | 804 | 168.4 |
| A | 0 | 254 | 14019 | 78.48 | 819 | 804 | 168.4 |
| A | 0 | 226 | 7799 | 41.54 | 819 | 804 | 168.4 |
| B | 11 | 51 | 167758 | 1061.83 | 823 | 806 | 157.2 |
| B | 10 | 16 | 90816 | 572.47 | 823 | 806 | 157.2 |
| B | 0 | 219 | 23753 | 145.94 | 823 | 806 | 157.2 |
| C | 13 | 61 | 6082 | 28.39 | 797 | 804 | 185.9 |
| C | 3 | 202 | 1913 | 5.96 | 797 | 804 | 185.9 |
| C | 3 | 233 | 1853 | 5.64 | 797 | 804 | 185.9 |
| D | 13 | 105 | 65530 | 331.15 | 796 | 773 | 195.6 |
| D | 1 | 52 | 35709 | 178.65 | 796 | 773 | 195.6 |
| D | 2 | 234 | 25644 | 127.18 | 796 | 773 | 195.6 |
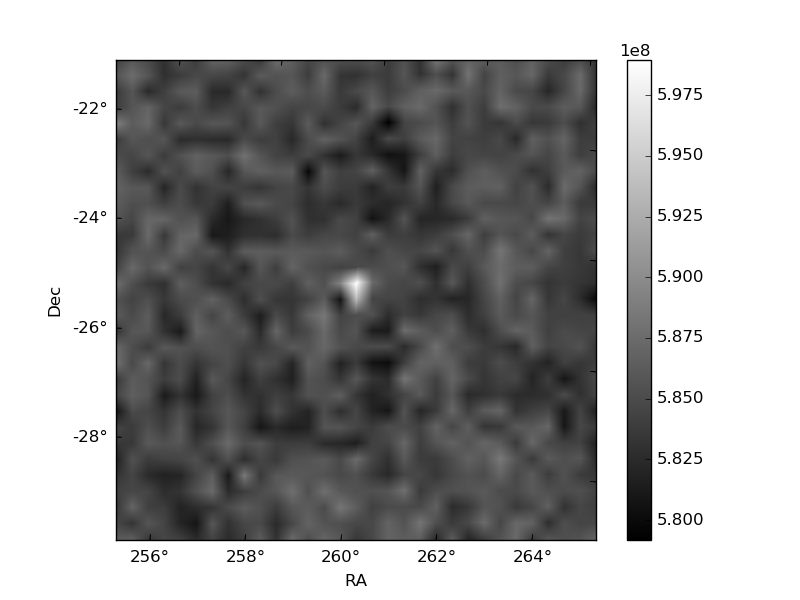
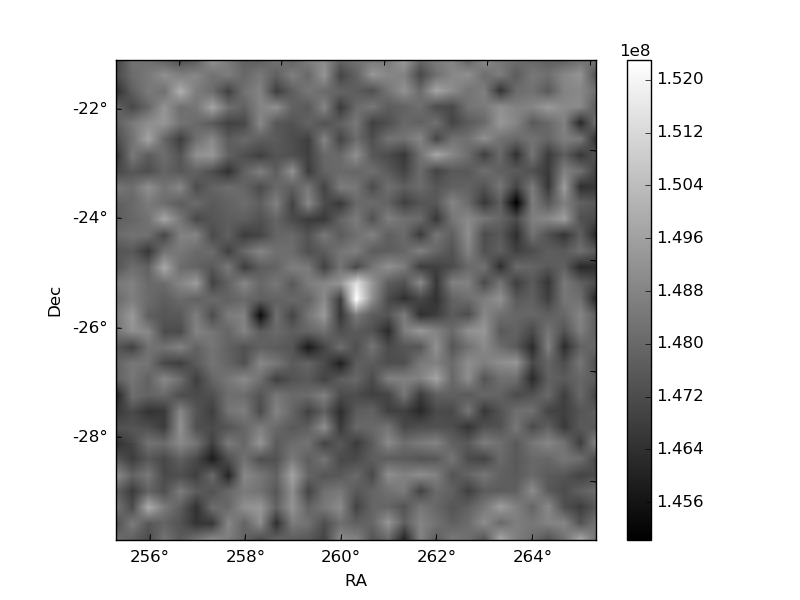
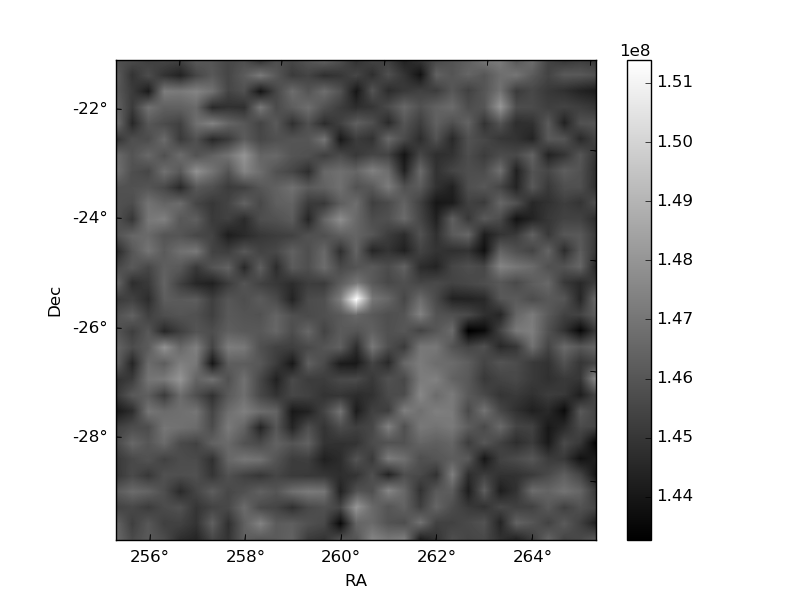
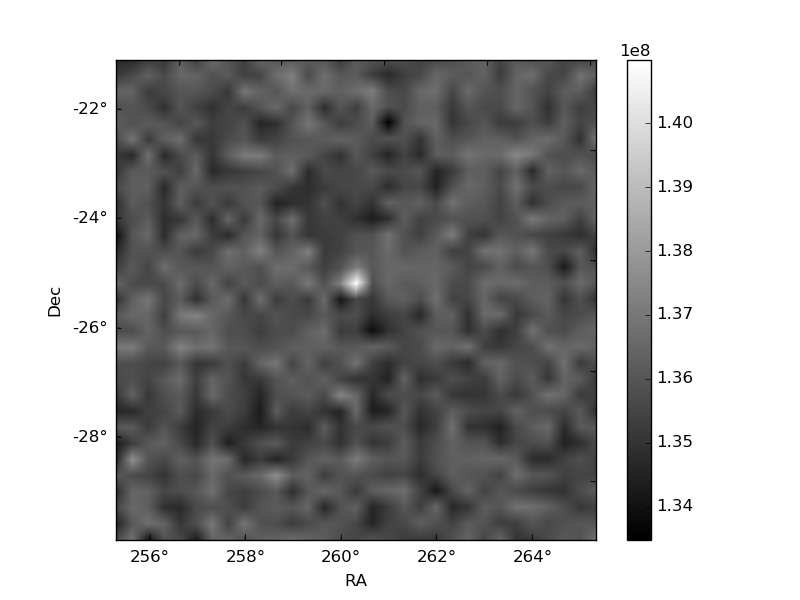
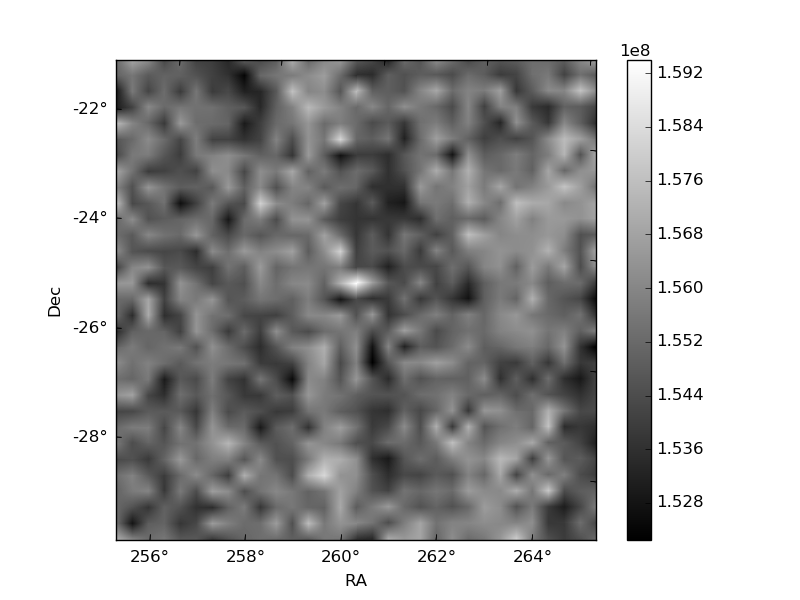
Histogram calculated using DETX and DETY for each event in the final _common_clean file
| Quadrant A | 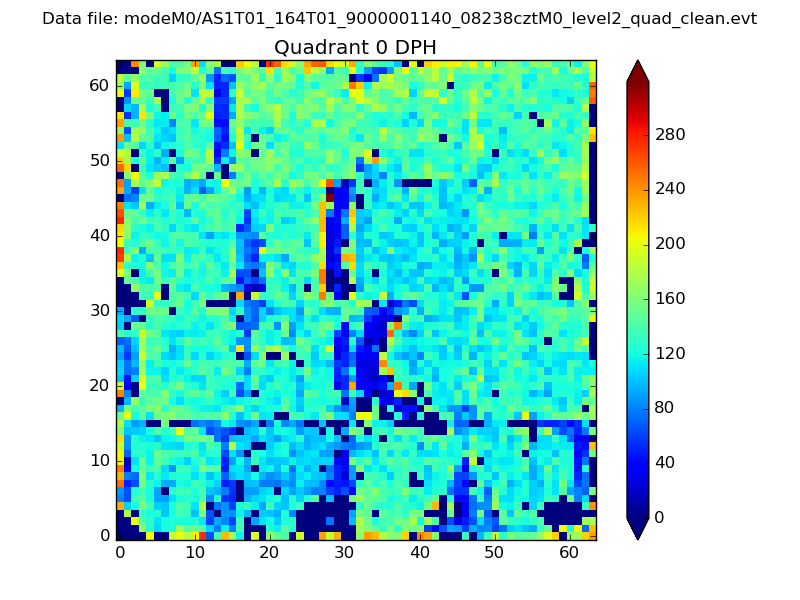 |
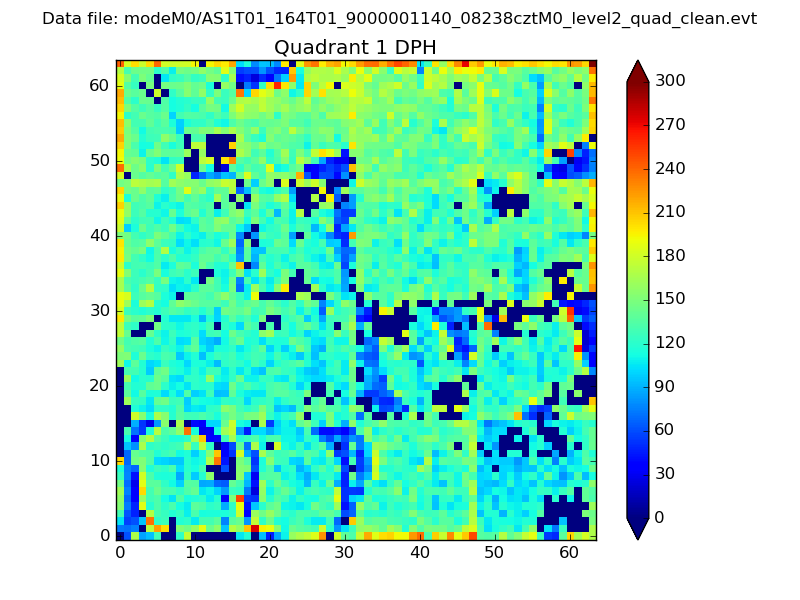 |
Quadrant B |
|---|---|---|---|
| Quadrant D | 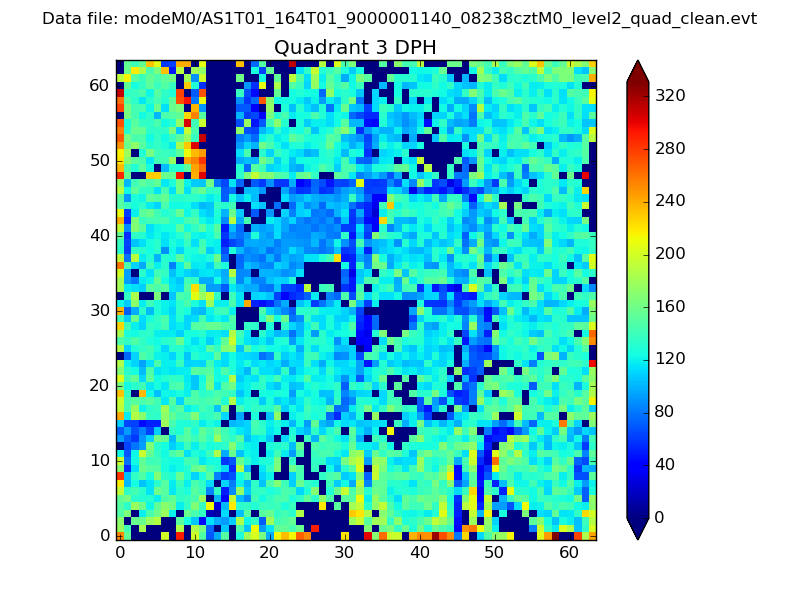 |
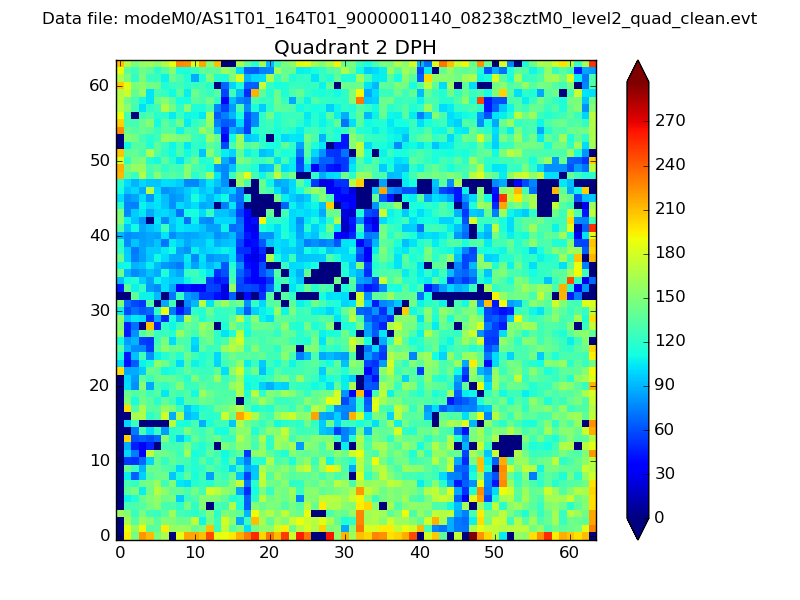 |
Quadrant C |
| Plot type | Count rate plots | Images |
|---|---|---|
| Comparison with Poisson distribution Blue bars denote a histogram of data divided into 1 sec bins. Red curve is a Poisson curve with rate = median count rate of data. |
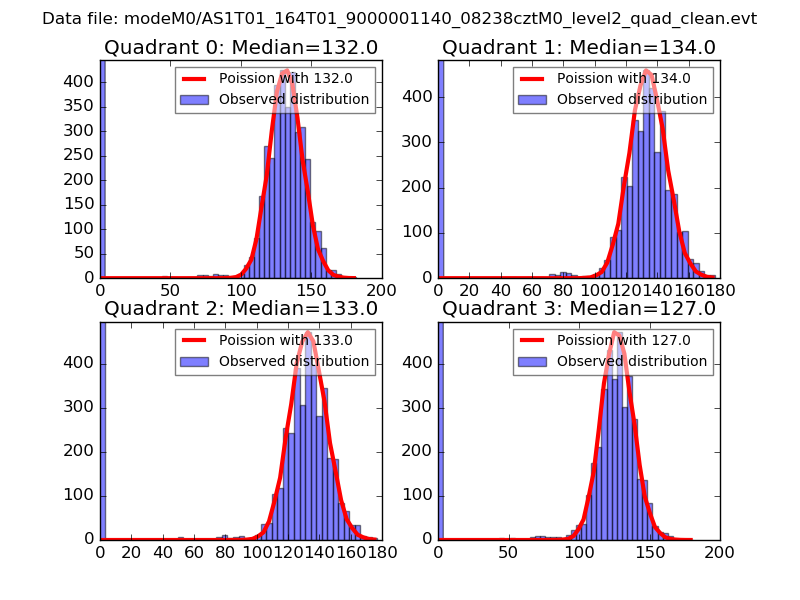 |
 |
| Quadrant-wise count rates Data is divided into 100 sec bins |
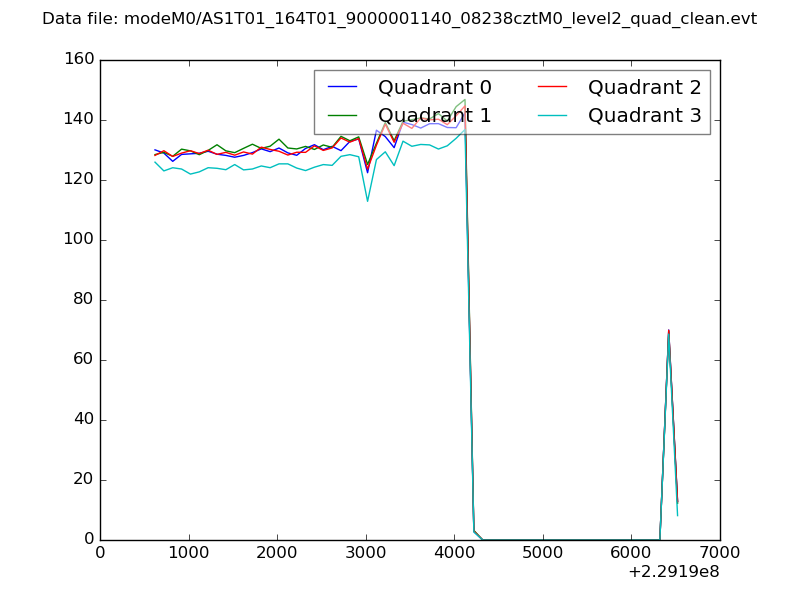 |
|
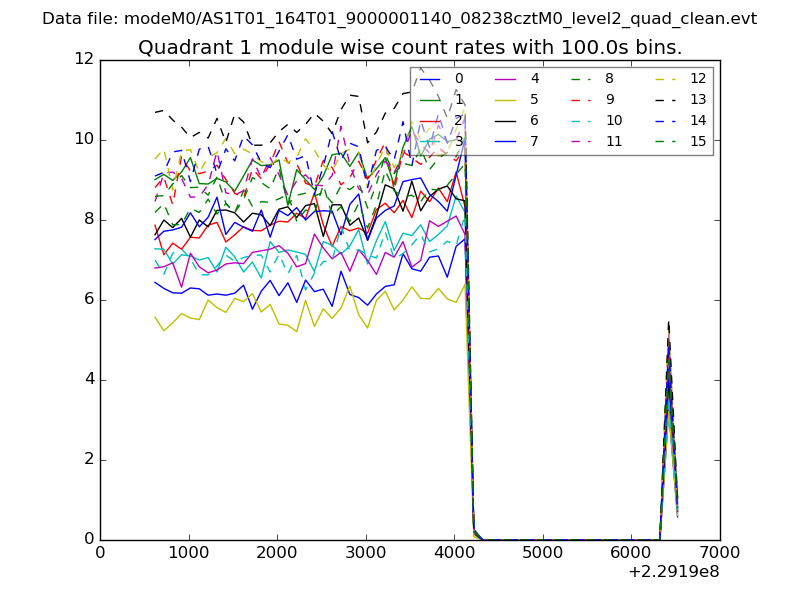
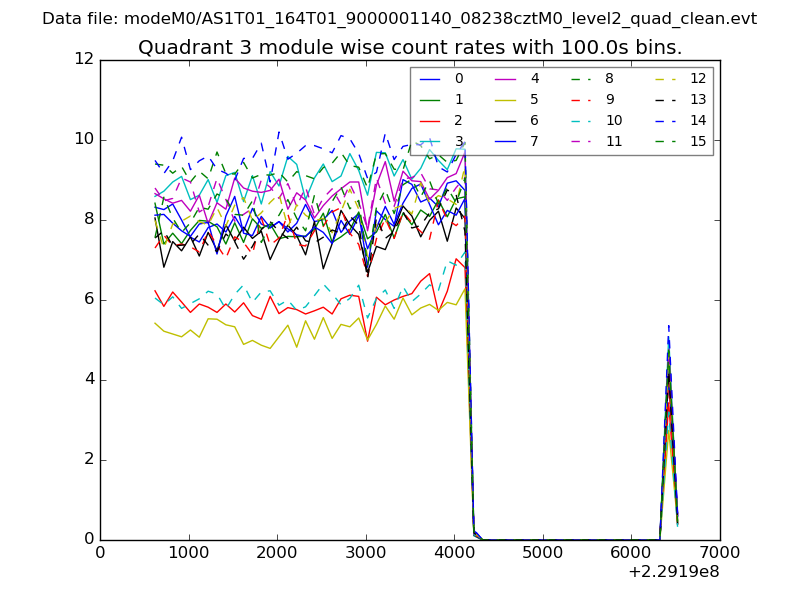
| Module-wise count rates for Quadrant A Data is divided into 100 sec bins |
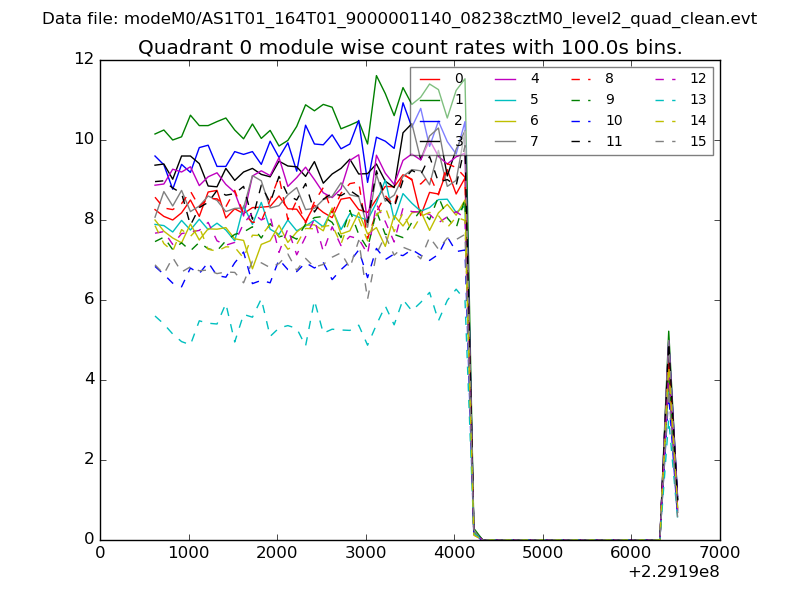 |
 |
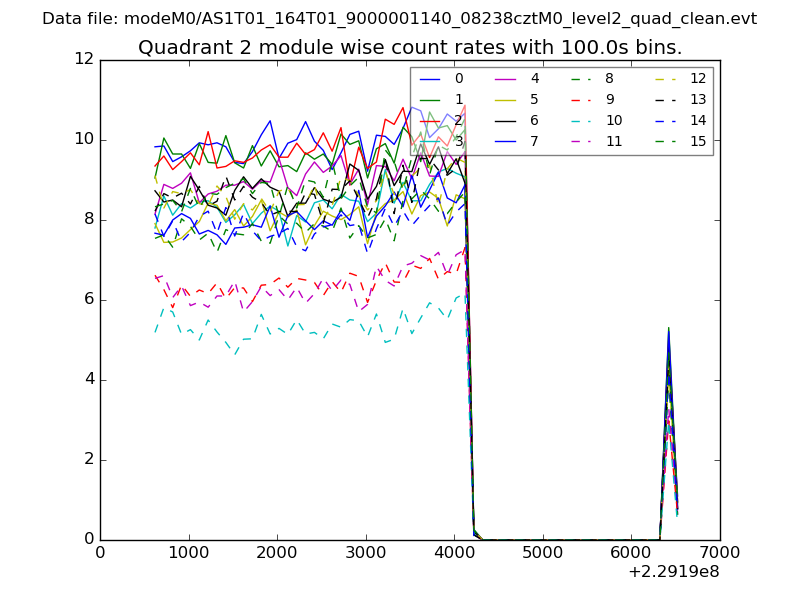
| Module-wise count rates for Quadrant B Data is divided into 100 sec bins |
 |
 |
| Module-wise count rates for Quadrant C Data is divided into 100 sec bins |
 |
 |
| Module-wise count rates for Quadrant D Data is divided into 100 sec bins |
 |
 |
| Parameter | Plot |
|---|---|
| CZT HV Monitor | 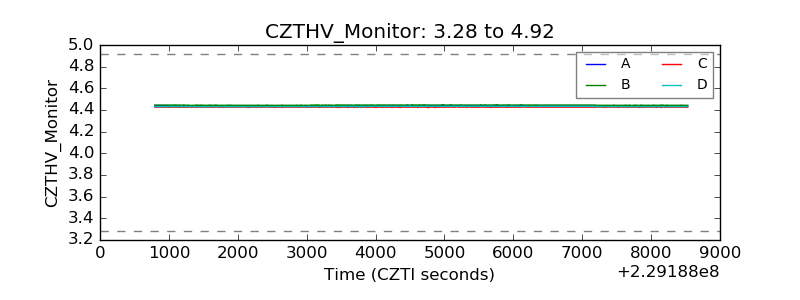 |
| D_VDD | 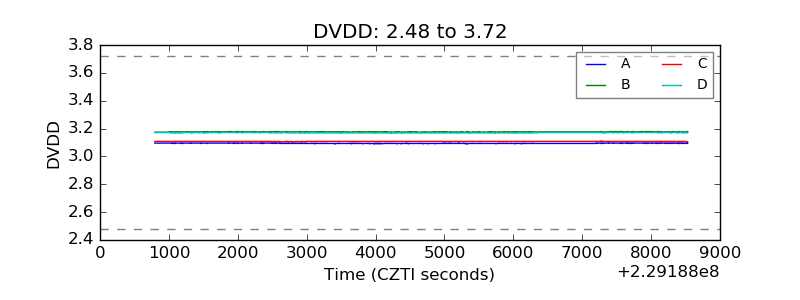 |
| Temperature 1 | 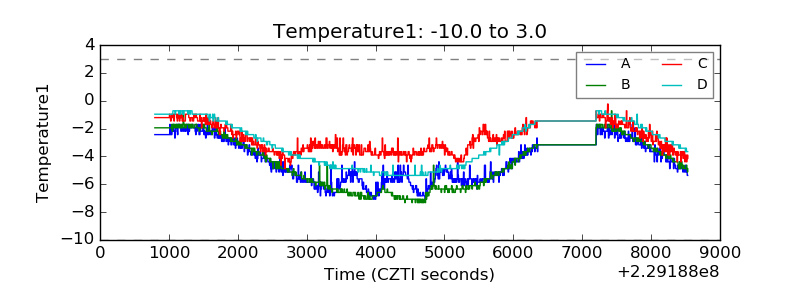 |
| Veto HV Monitor | 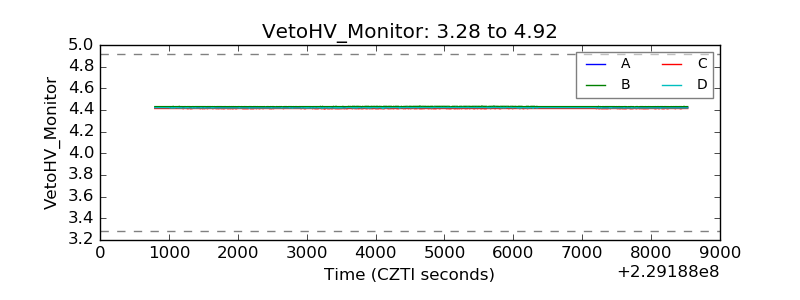 |
| Veto LLD | 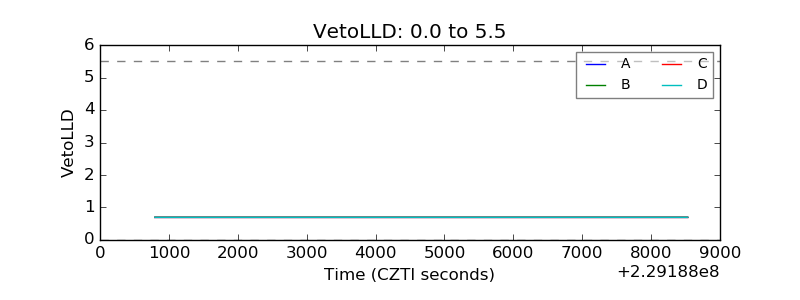 |
| Alpha Counter | 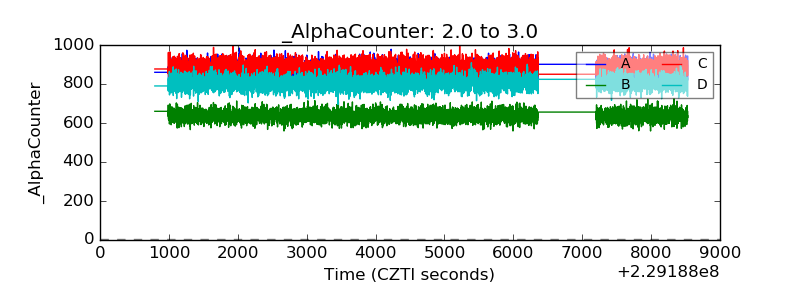 |
| _CPM_Rate | 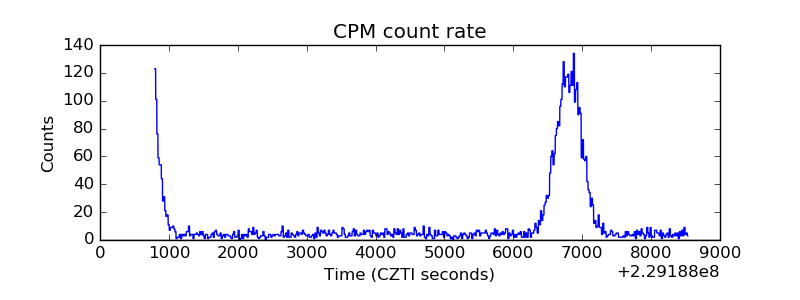 |
| CZT Counter | 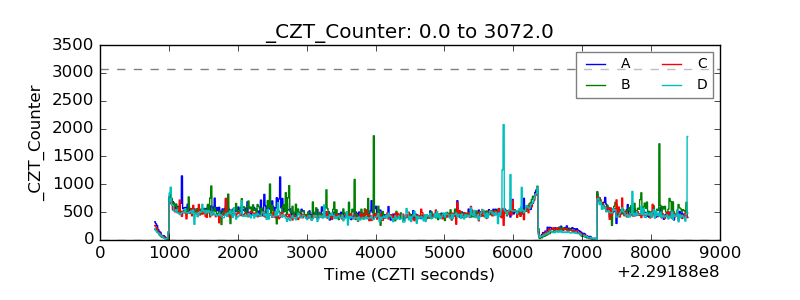 |
| +2.5 Volts monitor |  |
| +5 Volts monitor | 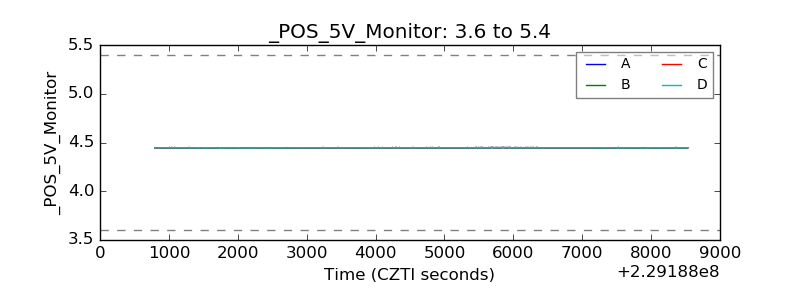 |
| _ROLL_ROT | 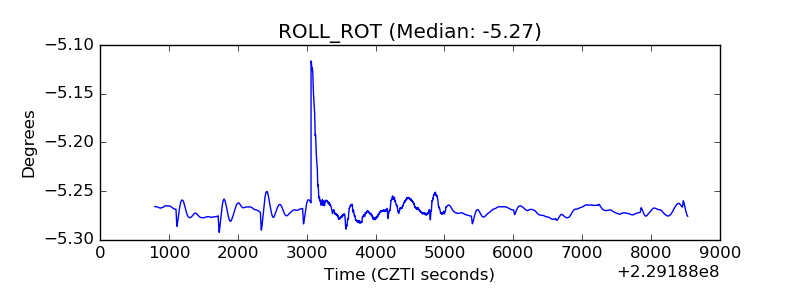 |
| _Roll_DEC | 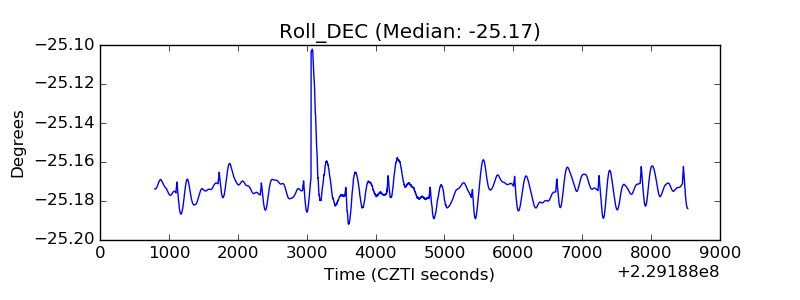 |
| _Roll_RA | 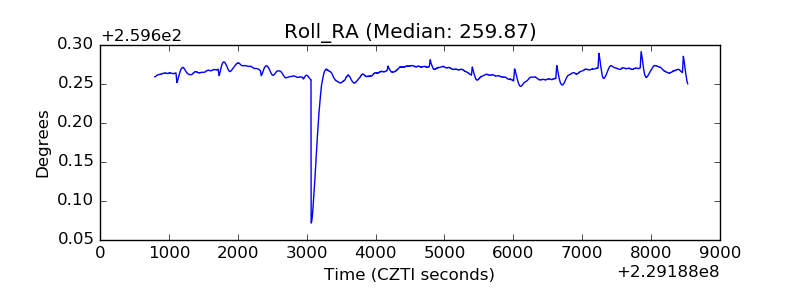 |
| Veto Counter | 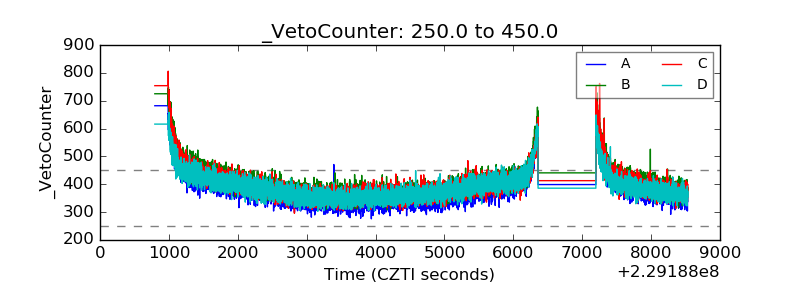 |